|
|
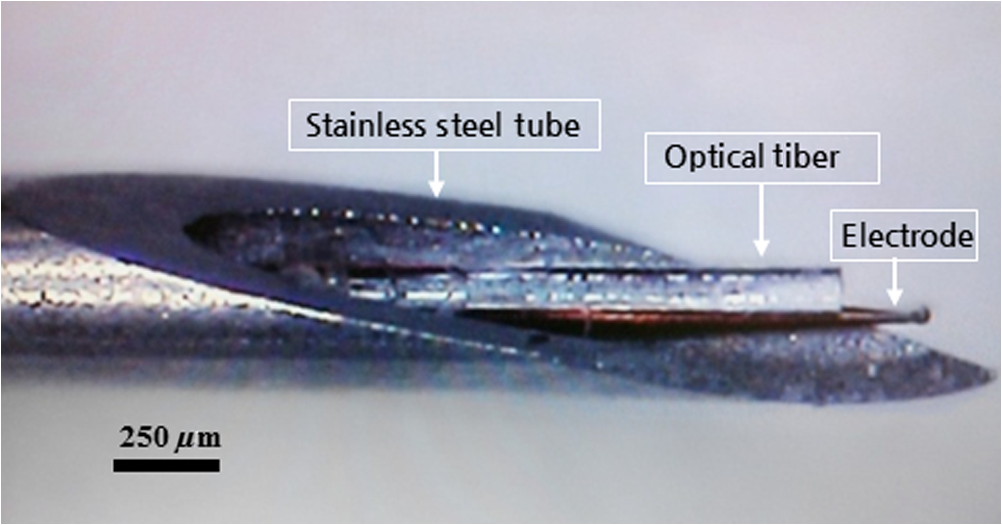
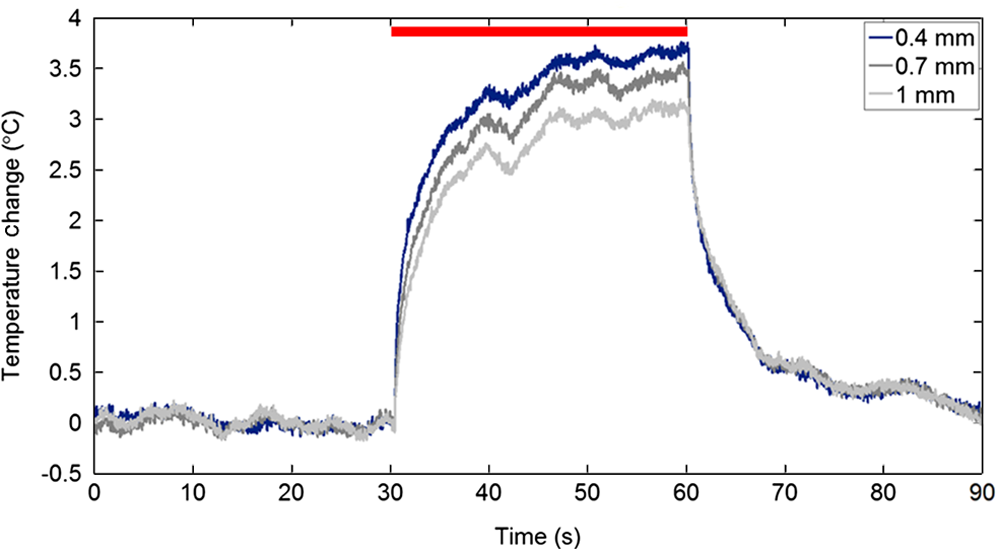
1.IntroductionNear-infrared stimulation (NIS) has retained its potential as another option to elicit neuronal activity changes besides electrical stimulation for more than five decades.1 Recently, optical stimulation using near-infrared light has been increasingly reported to alter the electrophysiological activities of the nervous system. As suggested and proven by Wells et al.2 and Shapiro et al.,3 respectively, the basic mechanism to elicit neuronal behavioral modulations has recently been understood as a temperature increase by light energy exposure in a targeted area. Several reports previously showed the possibility of using infrared light to induce action potentials in a variety of peripheral nerves, and consequently, the effects of infrared neural stimulation on peripheral nerves such as sciatic, facial, vestibular, and cochlear nerves are well characterized.4–7 Successful activation of peripheral nerves using NIS suggested that NIS has the potential to address the limitations of current clinical electrical stimulation techniques. Furthermore, it has been demonstrated that NIS can successfully alter the electrophysiological characteristics in cultured cortical neurons and in thalamo-cortical brain slices.8,9 Recently, Cayce et al.10 reported that pulsed infrared light with a wavelength of 1.876 μm and a pulse width of 250 μs, with a repetition rate of 50–200 Hz, can stimulate the somatosensory cortex of anesthetized rats and induce inhibitory responses. They found that the degree of neuronal modulation induced by NIS was dependent on the light stimulation energy. In addition to pulsed light waves, optical stimulation of cavernous nerves using continuous wave has also been introduced as an alternative mode of stimulation for intraoperative applications.11 However, the translation of NIS from the peripheral nervous system or from ex-vivo preparations to the in-vivo central nervous system demands further challenges for the precise and uniform control of modulatory effects due to the unique and complex anatomy and physiology of the brain. The globus pallidus (GP) and subthalamic nucleus (STN) are critical anatomical structures that constitute the cortico-basal ganglia circuit which controls coordinated movement. In particular, for example, globus pallidum shows abnormal firing patterns and loss of spatial selectivity in cases of Parkinson’s disease. Thus, the GP has been the traditional target for surgical therapies that destroy firing neurons (pallidotomy) or that disrupt the propagation of firing patterns into neighboring cortico-basal ganglia circuits (deep brain stimulation or in short DBS).12–14 However, DBS has inherent problems of limited spatial precision because of the uncontrollable spread of the electrical field created by the passage of currents, which can have undesired effects on neighboring neural tissues. Furthermore, electrical stimulation can give rise to stimulation artifacts which can mask the relevant neuronal signals resulting from stimulation.15,16 In contrast, recent experiments of optical stimulation suggest that optical stimulation is advantageous over the conventional electrical stimulation methods in several aspects, for (1) fine spatial resolution of stimulation can be attained, (2) no stimulation artifact is generated to disturb the simultaneous recording of electrical signals from neurons, and (3) there is no damage caused by electrochemical reaction between the stimulation source and tissue.17 Therefore, optical stimulation using NIS can be an ideal alternative, if it is feasible, to alter the firing patterns in GP and STN. Nonetheless, there has been a paucity of reports that correlate NIS with neuronal alteration in the central nervous system. In the present study, we aimed to investigate the possibility of neuronal modulation in GP and STN of normal rats using near-infrared radiation (808 nm) at low power output (), which are considered to have minimal damage on the brain tissue from thermal effects due to the minimal light absorption.18 To the authors’ knowledge, comparable NIS of GP or STN neurons has not been demonstrated to date. We found that the neurons in GP and STN were responsive to optical stimulation with the light power used, and the dominant response was excitation in GP and inhibition in STN. We also measured the temperature increases in tissues around the stimulation site, which coincided with the onset of optical stimulation and changes in neuronal activity, indicating a strong correlation among them. Based on the experimental results, we demonstrated the feasibility of near-infrared laser stimulation in in-vivo deep brain structures, suggesting the possibility of this technique as a promising new tool to potentially supplement or replace the current method of electrical DBS. 2.Methods2.1.Surgical ProceduresAll procedures were performed in accordance with protocols approved by the Institutional Animal Care and Use Committee of Gwangju Institute of Science and Technology (GIST). Male Sprague–Dawley rats (300–500 g, ; Samtako, Osan, South Korea) were anesthetized by 50% urethane in a saline solution (I.P. ) to maintain anesthesia for the whole experimental process. A toe-pinch test was used to verify the proper state of anesthesia. Each animal was placed on a homeothermic device (ATC 1000, World Precision Instruments, Inc., Sarasota, Florida) to maintain the body temperature at . The animal was fixed in a stereotaxic frame (Lab Standard Stereotaxic, Stoelting Co., Wood Dale, Illinois). A 2-cm midline incision was made on the scalp and a rectangular craniotomy was made to expose the dura mater above the GP and STN areas. During the experiment, saline solution (0.9% NaCl) was intermittently applied to prevent dehydration of the exposed cortex. 2.2.OptrodeA custom-made optrode was devised for simultaneous stimulation and recording as shown in Fig. 1. The optrode was composed of a tungsten electrode (0.127 mm diameter, 5 MΩ, AM systems, Inc., Carlsborg, Washington) attached to an optical fiber (62.5-μm diameter, Multimode 62.5/125, , Korea Optron, Gwangju, Korea). The distance between the tips of the electrode and optical fiber was adjusted to about 250 μm, thereby defining the working distance, and heat-cured epoxy was applied to hold the electrode and fiber firmly affixed to each other. Then, the bonded electrode and optical fiber were inserted into a stainless steel cannula. The cannula provided mechanical robustness to the optrode: the sharp tapered tip of the cannula prevented the electrode and fiber from deformation by contact with the dura mater and brain tissues. The optrode was positioned stereotaxically according to the atlas of Paxinos and Watson (AP 1.3 mm for GP and 3.2–4.0 mm for STN posterior to bregma, lateral 3.5 mm for GP and 2.0–3.0 mm for STN from the midline, and depth 4.5–7.2 mm for GP and 7.2–8.8 mm for STN from the dura).19 2.3.Optical StimulationThe light source was a semiconductor laser (L808P200, Thorlabs Inc., Newton, New Jersey) with a wavelength of 808 nm and a maximum output power of 200 mW. A near-infrared laser with the wavelength of 808 nm was chosen because it has relatively deeper penetration and thereby less tissue damage than that of other ranges of wavelength due to less scattering and absorption properties of the composing media (fat, water, oxy-, and deoxyhemoglobin) of the brain tissue. The absorption and scattering coefficients of light at 808 nm in the brain tissue are reported to be and , respectively.20 Particularly in water, the absorption coefficient at 808 nm () is lower by at least three orders of magnitude than that at wavelengths from 1.8 to 2.2 μm (about )21,22 that have been frequently used in pulsed-mode optical stimulation. The deeper penetration depth that resulted from this low absorption property can provide efficient stimulation with less damage for photons that are distributed over a wider area with reduced heat-induced injury.17 The laser diode (LD) was controlled using an LD driver (WLD3343 HB, Wavelength Electronics, Bozeman, Montana). The fiber was coupled to the diode using a plano-convex lens by focusing the light from the LD to the fiber. The laser output was focused into a 62.5-μm core diameter optical fiber and measured at the fiber tip using a laser power meter (PM100A, Thorlabs Inc., Newton, New Jersey). The light was continuously delivered to the GP or STN for 2 min at four different powers of 40, 30, 20, and 10 mW measured at the fiber tip, respectively. By decreasing the power from 40 to 10 mW, it was ensured that no functional damage was introduced even during the experiments with the maximum power used. 2.4.Electrophysiology RecordingsNeuronal activities in the GP and STN were recorded via the tungsten microelectrode of the constructed optrode. Recording sites were determined such that neurons showed continuous firing and the number of spikes per second remained within a prescribed range (). Once a stable neuronal signal was detected, a total of four neural recordings at four different laser powers of 40, 30, 20, and 10 mW at the tip of the fiber, respectively, were conducted at each recording site to investigate how the power of the laser stimulation affects the neural responses. The entire process of recordings in each case was performed for 6 min; 2 min before the stimulation, 2 min during the stimulation, and 2 min after the stimulation. For signal processing, a computer-controlled data acquisition system (ARIS-22, Neurostar, Sindelfingen, Germany) with digital signal processing in real time was used to detect the electrical activities from the GP and STN areas. Using a 300–5000 Hz bandpass filter, the raw signals were filtered and then amplified with a gain of 10,000. The amplified signals then were digitized at a sampling rate of 20 kHz using a 16-bit analog-to-digital converter. 2.5.Data Analysis and StatisticsA packaged data analysis program, sigTOOL, was used to import and transform the data to appropriate formats.23 A MATLAB-based spike sorting program named “Wave_clus” was used to sort spike trains.24 A clustering algorithm with superparamagnetic clustering was used to discriminate the spikes from multiple cells.25 An example of the clustered groups of spikes is shown in Fig. 2(a). Approximated numbers of spikes in grouped clusters are seen in Fig. 2(b) and Fig. 2(c) describes typical spike shapes detected from two different neurons in a single recording. Among the discriminated spike groups, the spikes of neurons that have unreliable interspike interval (ISI) histograms were eliminated in further analysis. Reliable spikes from a neuron should show that an ISI histogram of the first few bins, each of which represents the length of spike intervals in milliseconds, be empty as a result of a relative refractory period as shown in Fig. 2(d). Next, the number of firings per second was evaluated for the first 2 min (“before”), for the second 2 min (“during”), and for the final 2 min (“after”). In order to summarize the information on neuronal activities, all numbers of firings per second collected during each 120 s were averaged. Then these averaged spike rates were grouped into excitatory cases and inhibitory cases by comparing the mean spikes of “before” and “during”—the value of “during” is greater than “before” in excitatory cases and smaller in inhibitory cases. To eliminate the effect of the variety in intrinsic spike rates of different cells, normalization was conducted for each 6-min recording by dividing the spike rates “before,” “during,” and “after” the stimulation by the mean spike rates of “before” the stimulation, respectively, so that only the changing rate between “before” and “during” or “during” and “after” could be highlighted. A paired Student’s -test was used to determine the significance of changes between normalized “before” and “during” or “during” and “after” observed in optical stimulation. The change in neuronal activity was considered significant when the changing rate reached the statistical level of . Fig. 2The windows of the sorting program show spikes detected from neurons: (a) distribution map of spikes based on wavelet coefficients that represent spike shapes detected by a threshold depending on the amplitudes of measured spikes. The clusters with distinct colors correspond to two different neurons. (b) Graph of the number of clustered spikes using the superparamagnetic algorithm. (c) Spike shapes of detected action potentials in an extracellular recording. Waveforms in blue and red colors present two different spike shapes, whereas waveform in black color is considered as noise. (d) Interspike interval histogram of the detected neuronal activities. The histogram shows diverse spike patterns of juxtaposed neurons. In other words, neighboring neurons in a region can show different behaviors. 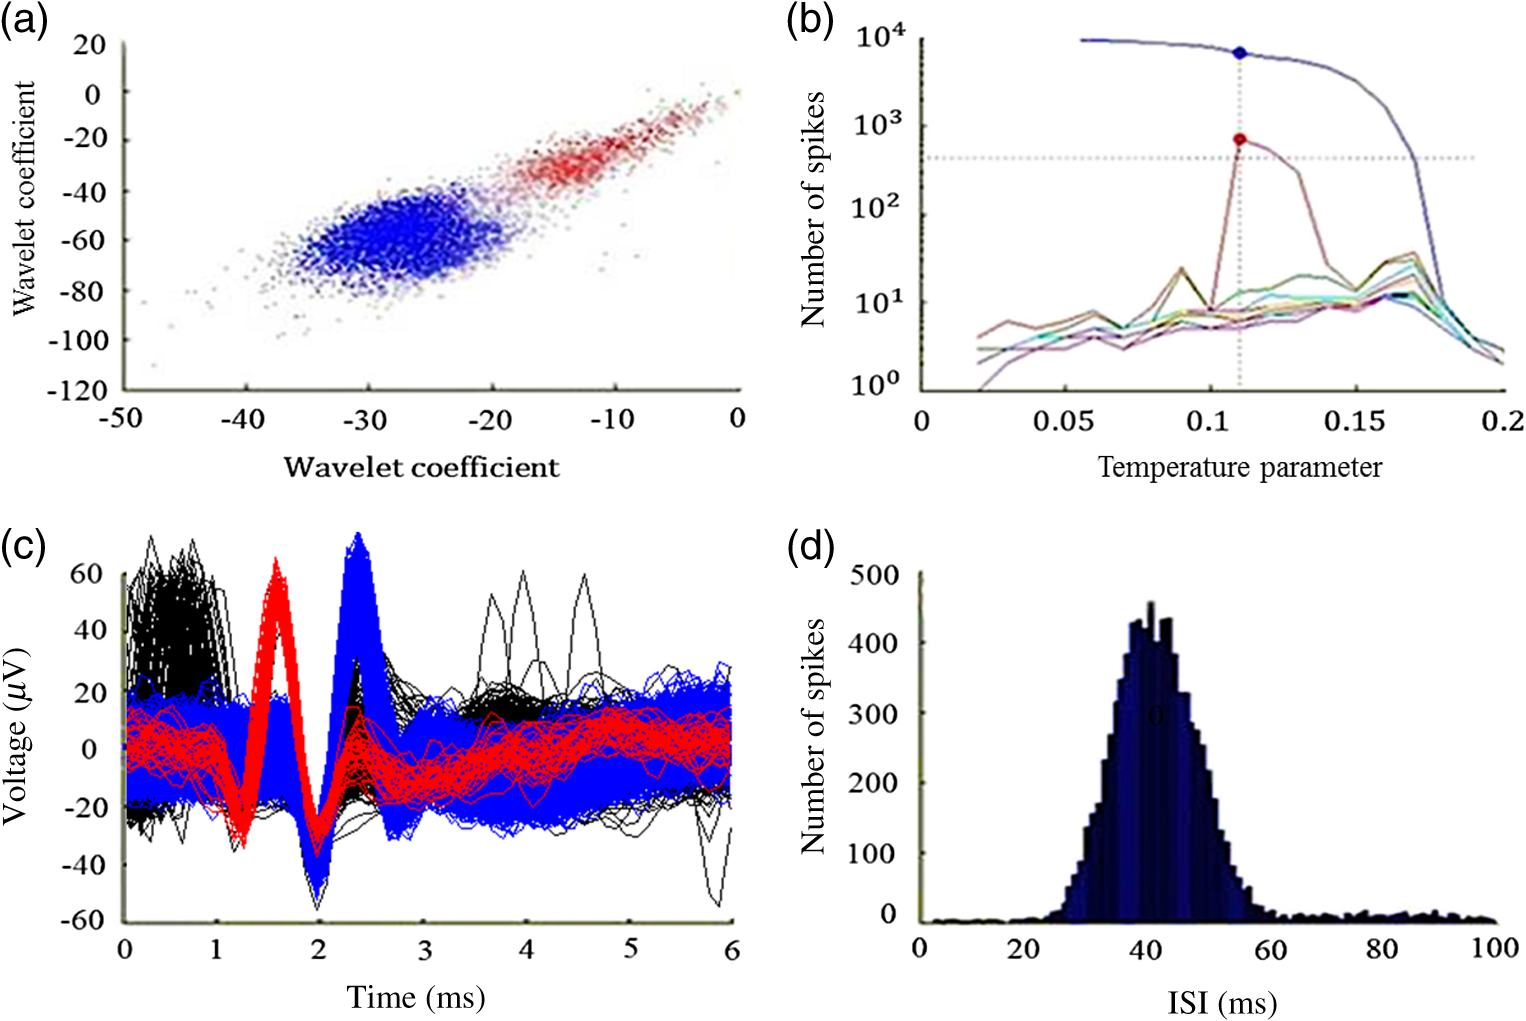 2.6.Temperature MeasurementsA device named Temptrode was devised, along with the two additional versions, to measure the temperature increases caused by optical stimulation. -type thermocouple wires with a radius of 0.12 mm (Copper/Constantan, Duplex type, Teflon coated, SANE CAL. Co. Ltd, Seoul, Korea) were used as the temperature sensor. In order to fit the wires along with the optical fiber into the limited space inside the cannula, the insulation in a thickness of 150 μm that wraps around the thermocouple wires was removed, and the exposed thermocouples were insulated by Parylene-C deposited in a thickness of about 3 μm. Next, the tips of the thermocouple wires were adhered together by soldering the wire tips to achieve spatial accuracy for temperature measurement near optical stimulation sites. After soldering, Parylene-C was deposited again on the newly soldered area to prevent possible noises coming out from the thermocouple wires through the DAQ board (NI USB-6353, National Instrument, Austin, Texas). Then, the wires were finally inserted into the stainless steel cannula and placed as close as possible to the tips of the optical fiber and electrode. In total, three types of Temptrode were devised for different measurement modes. In type 1, thermocouple wires were placed inside the cannula [Fig. 3(a)] while they were attached to the outer surface of the cannula in type 2 [Fig. 3(b)]. The distances between the tips of the optical fiber and the thermocouple wires ranged around 200–350 μm in Temptrode types 1 and 2. In type 3, three thermocouple wires were intertwined, with tips being placed at different distances from the tip of the optical fiber of 400, 700, and 1000 μm, respectively, in order to investigate the spatial distribution of temperature increases caused by NIS. In an additional experiment to investigate the spatial distribution of temperature increase, the temperature sensor, separated from the optical fiber, was attached to a microdriver and moved into the GP area by using the computer controlled manipulator (ARIS-22, Neurostar, Sindelfingen, Germany) while the optical fiber was already fixed at the target position. The separation between the optical fiber and temperature sensor enabled to measure the temperature increase at relatively farther distances from the stimulation site. 3.ResultsIn total, 19 individual cells in GP or STN were identified after spike sorting procedures. There were nine cases in which a cell showed excitatory neuronal responses and 10 cases showed inhibitory responses. Figures 4(a) and 4(b) show spike trains of a neuron before and during the laser stimulation at the power of 40 mW, respectively, in an excitatory case. Spikes appeared more frequently with light stimulation than before stimulation, as seen in Fig. 4(b) compared to Fig. 4(a). Likewise, in an inhibitory case shown in Figs. 4(c) and 4(d), the number of spikes during the stimulation noticeably decreased compared to that before stimulation. Figure 5 shows the change in firing rates in all identified cells in response to optical stimulation at a power of 40 mW. It was observed, however, that the locations of cells showing different responses to optical stimulation were not clearly distinguished. In addition, even with the same stimulation parameters, neurons showed opposite responses, excitation in some neurons, and inhibition in others. We found that both effects of excitation and inhibition could be elicited in response to optical stimulation in both GP and STN. Excitatory responses to the optical stimulation were mostly found in GP (eight out of 11), whereas inhibitory responses were predominant in STN (seven out of eight). Fig. 4Excitatory response (a) before and (b) during the optical stimulation, and inhibitory response (c) before and (d) during the stimulation. The zoomed-in images show the actual spike shapes.  Fig. 5Changes in firing rates in all identified cells in response to optical stimulation at a power of 40 mW. -axis represents time in second and -axis represents firing rate per second. GP 1 to GP 11 represent the cells in globus pallidus (GP) while STN 1 to STN 8 the cells in subthalamus, and excitatory and inhibitory responses are grouped separately. In the boxes, firing rate histograms during the 6 min of a recording session are displayed. The red bars indicate the duration of optical stimulation for 2 min. Note that the scale ranges differ in the figures, determined by the highest firing rate per second for each cell. Also, it is notable that the intrinsic firing rate in some cells (e.g., GP 4, GP 8, STN 8) changed during the recording session, which cause was unidentifiable in the present study.  3.1.Optical Stimulation in GPIn eight out of 11 cases in total, the instant spike rate increased as soon as the NIS was applied in the GP area. The initial spike rates of cells varied significantly from 2.85 to 69.06 with an average of , as shown in Fig. 6. Among the eight excitation cases (GP 1 to GP 8), the normalized increased rate during the stimulation ranged from 1.09 to 2.08 with an average of 1.44. The mean of normalized spike rates after the stimulation in those eight excitation cases was 1.14 indicating that the neural activities returned to the original state when optical stimulation ceased in most cases. In the excitation case 4 (GP 4), however, the activity remained in an excited state even after the stimulation. Furthermore, three inhibitory responses in the GP area were also found (GP 9 to GP 11). As seen in Fig. 6, neurons in inhibition cases showed relatively lower initial spike rates than those in excited cases. In particular, inhibition case 3 (GP 11) in Fig. 6 showed a greater spike rate after the stimulation than its initial state by 12%, which is called the “post inhibitory rebound” response.26,27 Interestingly, this increased neuronal activity after the stimulation in inhibition cases showed a dependency on the stimulation power: higher power induced greater rebound reactions. Fig. 6Box and whisker plot of neuronal responses of GP with optical stimulation at a power of 40 mW. The boxes represent the first to the third quartile of the data set. The bars and circles in the boxes indicate the median and mean, respectively. The bars extending outside the boxes indicate the maximum and minimum values of the data set.  3.2.Optical Stimulation in STNFigure 7 shows the results of optical stimulation of STN at the laser power of 40 mW, displaying responses of eight identified cells. The predominant response in STN was inhibition, opposite to that of GP. Seven out of eight cases in total showed inhibitory responses to optical stimulation (STN 1 to STN 7 in Fig. 7). The initial firing rates in STN ranged from 1.76 to 33.48 with an average of , which were relatively lower than that of GP. In seven cases of inhibition, the difference in spike rates between before and during the stimulation was significant (, ). The decreased rate during the stimulation ranged from 0.18 to 0.72 with an average of 0.51 after normalization by dividing by the averaged initial firing rate of each cell. This approximately 49% decrease in average rate during the stimulation compared with the initial firing rate before the stimulation was similar to the increased rate in GP of around 44%. Although all cells from STN 1 to STN 7 in Fig. 7 showed inhibitory responses during the stimulation, there were different poststimulus reactions in different neurons. For instance, STN 1 and STN 4 showed 82% and 119%, respectively, higher spike rates after the stimulation than their original spike rates, exhibiting a “post inhibitory rebound” as did GP 11 in Fig. 6. On the other hand, the spike rate remained low after the stimulation in STN 2. From observations, the poststimulus reactions can be categorized into three major patterns: back to the original spike rates, maintained spike rates at the value during the stimulation, and postinhibitory rebound. The mechanism of these different poststimulus responses should be further studied. Fig. 7Box and whisker plot of neuronal responses of subthalamic nucleus with optical stimulation at a power of 40 mW. The boxes represent the first to the third quartile of the data set. The bars and circles in the boxes indicate the median and mean, respectively. The bars extending outside the boxes indicate the maximum and minimum values of the data set.  Unlike other cases found in STN, STN 8 showed an excitatory response to optical stimulation. The firing rate after the stimulation decreased more significantly than other excitatory cases found in GP. As seen in STN 8 in Fig. 5, however, it was observed that in this particular cell, the intrinsic firing rate seemed to have been decreasing even before the stimulation was applied and continued to decrease during the stimulation. From this observation, a change in intrinsic neuronal behaviors may have been in effect even before and while the optical stimulation was applied. 3.3.Effects of Stimulation PowerFigures 8(a) and 8(b) show the normalized averages of spike rates for the nine excited cases and for the 10 inhibitory cases, respectively, as a function of the power of optical stimulation. Figure 8 shows that the level of responsiveness to optical stimulation increased as the laser power increased. The alteration in neural activities before and during the stimulation became more apparent as the optical power increased in both excitatory and inhibitory cases. The statistical significance of the change in spike rates before and during the stimulation increased as the power increased. Although a significant change in neuronal behaviors was found at the minimum power of 10 mW in excited cases, a conclusion was drawn that the power of 20 mW was the stimulation threshold at which statistically significant changes were induced in both excited and inhibited cases. Furthermore, Fig. 8 shows that the spike rates tended to return to their original pace after the stimulation was discontinued in both excited and inhibited cases. Excited cases seemed to have a greater tendency to recover the original firing rates. 3.4.Temperature MeasurementFigure 9 shows a typical temperature increase during the 2 min of optical stimulation at the power of 40 mW, the highest laser power used in the present study. It was found that as soon as the stimulation was applied, the temperature increased instantaneously, within 100 ms. Once the temperature increased and reached a peak level, it remained relatively constant during the rest of the stimulation session. It decreased also instantaneously after the optical stimulation ceased. When the stimulation ended, the temperature returned to the original temperature of about 37°C as it was before the stimulation, within 100 ms. Fig. 9Measured temperature during the optical stimulation at a power of 40 mW for 2 min. It shows the maximum temperature increase by the highest power used in this study. The bar above the plot indicates the application of optical stimulation. This is representative of three repeated measurements in two rats, each.  Figure 10 shows the temperature increases measured at the stimulation site when the NIS was applied at four different powers from 10 to 40 mW. As shown in Fig. 10, the temperature increase had a linear relationship with power used in this study. In the previous section, the threshold for neuronal behavioral modulation was found to be 20 mW. From the findings that NIS at power of 20 mW produced an average temperature increase of about 2°C in neural tissue as shown in Fig. 10, it can be concluded that the temperature increase at or above 2°C could elicit statistically reliable neural behavioral modulations. Fig. 10Temperature increase measured at the stimulation site versus laser power applied at the site. The bars indicate the standard deviations of three repeated measurements at each power.  Figure 11 shows the temperature increases measured at different distances from the site of optical stimulation at a power level of 40 mW. It needs to be mentioned that the power of 40 mW, the highest power available in the current study, was used as it could show the temperature changes more clearly, by being less affected by noises and also less limited by the measurement sensor or system itself. As the figure indicates, higher temperature increases in neighboring tissue occurred at locations closer to the stimulation site. Next, we also measured the temperature increases in surrounding tissue at distances farther away from the stimulation site (data not shown). The amount of temperature increase declined as the distance from the stimulation site increased. Furthermore, even in the regions up to 4 mm away from the optical stimulator, detectable temperature changes, although they were below the threshold, were observed at a slower pace than those in regions near to the stimulation site. From these observations, it was indicative that with continuous optical stimulation at the power of 40 mW, neuronal behavior changes could be induced not only in the close proximity to the stimulation site but also in regions up to 2.5 mm away from the stimulation site where a temperature rise of was detected. 4.Discussion4.1.Continuous NIS at 808 nm Can Modulate Neural Responses of GP and STNIn this study, we found that continuous near-infrared radiation at 808 nm induces neuronal behavioral alterations in deep brain structures such as the GP and STN in rats. Regarding the mechanism of neuronal activation changes by optical stimulation, Liang et al.28 reported the elevated local tissue temperature as a cause of changes in the activity of a single hippocampal neuron with continuous NIS with 980-nm wavelength. In addition, a recent study by Shapiro and his colleagues3 found that the rate of change in temperature gives rise to a capacitance increase in plasma membranes, thus inducing elevated active ion transmissions. Based on both studies, we can conclude that transient capacitance increases explain the neuronal modulation while temperature is changing, and the elevated temperature itself explains the neuronal responses during a thermodynamic equilibrium state. Continuously applied NIS highlights a noticeable advantage over electrical stimulation: simultaneous stimulation and recording during the entire period of stimulation, which has been challenging with electrical stimulation. Owing to this significant advantage, we found that NIS-induced neuronal activities increased or decreased instantaneously and lasted as long as the stimulation was provided. Furthermore, we could observe that neuronal modulation elicited by NIS was still sustained effectively even when the intrinsic activity of a neuron changed (see Fig. 5, GP 4 or STN 8). Although many of previous studies on NIS used wavelengths ranging from 1.8 to 2.2 μm,29–31 the results in the present study suggest the possibility of other light sources at different wavelengths, for instance, 808 nm, to be effective sources of optical stimulation, especially in the brain. Another example of using lasers at shorter wavelength is found in a recent study, in which it was revealed that a relatively significant temperature increase was caused by light with a wavelength of 445 nm, implying possible neuronal activity modulations using that wavelength as well.32 4.2.Threshold in Laser Power and Temperature Increase for Neuronal ModulationOur study showed that the degree of neuronal modulation had a linear dependency on stimulation power. A positive correlation between radiant power and temperature increases was also found in tissues near optical stimulation sites, suggesting causal links among the stimulation power, the temperature increase, and the degree of neural modulation. The linearity found in both temperature increases and changes in firing rate by optical stimulation in our study supports the findings that neuronal modulations are due to the transient temperature increase and increased temperature in thermodynamic equilibrium induced by optical stimulation.3,28 We were able to induce significant neuronal excitations and inhibitions in the subcortical structures using NIS at power of . In addition, it was found that optical stimulation at a power of 20 mW led to a temperature increase of about 2°C. From these findings, the threshold for temperature increases to elicit neuronal modulations was estimated to be around 2°C in in-vivo deep brain structures. According to the study by Tozburun et al. using continuous optical stimulation, the temperature threshold to induce neuronal responses in cavernous nerve appeared to be from 42 to 45°C,11 which is higher than the one found in the present study. To explain this discrepancy regarding the temperature threshold, different circumstances of the exposed nerve fibers and the deep brain tissues should be considered. Unlike the exposed cavernous nerves, the GP or STN is surrounded by water and other various substances including chromophores, which cause temperature increases by absorbing light energy and also act as an effective media to conduct and dissipate the increased thermal energy. Regarding the affected area by optical stimulation, a wide range of the affected area was found using continuous wave stimulation in the present study. This wide affected area is contradictory to one of the main advantages of NIS compared to electrical stimulation, the better spatial selectivity. The beam spot of the used laser on the irradiated tissue surface was estimated to be about 83 μm, sufficiently small to target a small group of neurons with a good spatial selectivity. However, heat transfer originating from the small irradiated area throughout the surrounding tissue was believed to have broadened the affected area. 4.3.Diverse Degrees in Behavioral Modulations in Different NeuronsThe varied degree of neuronal behavioral modulations in different neurons was observed in this study. For example, in Fig. 5, the cell GP 9 completely ceased its activity while others such as GP 10 and GP 11 showed decreased but sustained activities during the optical stimulations. Varying distributions of excitatory and inhibitory inputs on the dendritic domains of a recorded cell may be the main reason for the varied degrees of neuronal responses. With this postulation, we can assume that GP 9 may have been occupied mainly with GABAergic inhibitory axonal terminals and there might have been more excitatory inputs to the dendrite domain in others such as GP 10 than in GP 9, which leads to preventing the total cessation in postsynaptic activity. We also found (data not shown) that different cells located closely to each other showed opposite responses, which implies that there is no strict distinction in response types by different regions. 4.4.GP and STN Show Different ResponsesTo explain the opposite responses in GP and STN found in this study, the release of GABA or glutamate following stimulation of afferents from GABAergic or glutamatergic neurons near recorded areas can be a possible mechanism. Feng et al. found that infrared laser stimulation increased spontaneous inhibitory postsynaptic currents (sIPSCs) in cultured rat cortical neurons.9 Findings in the studies of Liang et al. and Feng et al. imply that increased temperatures by NIS may increase the rates of APs in axons that are projected to the recorded neurons. Given the distance of between the tips of the electrode and the optical fiber, it is suggested that axonal fibers between the light source and the recorded site may have been stimulated and increased their APs, leading to more released neurotransmitters upon the postsynaptic area of a recorded neuron. In GPe, glutamatergic excitatory afferents from STN are abundant forming a band-like field, while STN receives a substantial amount of GABAergic inhibitory projections from GPe.33 Therefore, it is plausible to conclude that those opposite responses found in the GPe and STN occur due to varied types of neuronal projections that are distributed unevenly in the two regions. Specifically, the population density of more glutamatergic afferent fibers from STN than GABAergic afferent fibers from the striatum region34 should have a strong causality in finding more excitatory and less inhibitory responses in the GPe area, indicating the greater likelihood of detecting a higher portion of excited neuronal responses than the inhibitory ones by optical stimulation in the GPe area. On the other hand, we found that STN showed predominantly inhibitory responses. The study by Parent and Hazrati33 showed that around two-thirds of the cells in STN are covered with GABAergic afferent projections from the GPe, and a smaller portion consists of glutamatergic afferent populations from the cerebral cortex and thalamus. These more GABAergic afferents and less glutamatergic projections in STN underpin our findings of the detected neuronal behavioral modulations of 87.5% (seven out of eight) inhibition and 12.5% (one out of eight) excitation responses in the STN area. 4.5.Further Studies Toward Clinical ApplicationsWe found that one of the most significant differences of continuous wave optical stimulation over pulsed laser stimulation is the affected area. A wider affected area was found in continuous optical stimulation, which is, however, contradictory to one of the main advantages of NIS compared with electrical stimulation, the better spatial selectivity. To retain a good spatial selectivity, pulsed light stimulation may be a solution to reduce the size of the effective area. As seen in this study, the duration that temperature increases reach a state of thermodynamic equilibrium depends on the distance from the stimulation site. Accordingly, if the duration of optical stimulation is sufficiently short, the area affected by the optical stimulation will become smaller. Hence, the pulse width of the optical stimulation could be a useful parameter to determine the range of affected regions in which neural modulations occur due to the temperature increases resulting from optical stimulation. In addition, a mathematical model that describes the heat transfer temporally and spatially, such as the one introduced in the study of Thompson et al.,35 could be devised, enabling one to predict temperature increases at a targeted area to more accurately modify neuronal behaviors with a desired level of responses. Although it was found that the temperature increases by different power levels seemed to behave linearly in the present study, it is still possible that they have a nonlinear relationship due to the complex interactions between the thermal energy delivered by light and the amount of heat dissipation in the brain tissue. Computational simulations using a mathematical model of heat transfer in the brain tissue would enable in-depth investigations on the temperature increase with an increasing laser power by reflecting all associated parameters, which is hardly achievable in in-vivo experimental setup. An investigation on the spatial distribution of temperature increase by various pulse widths or frequencies along with the power intensity of optical stimulation would introduce better options for NIS to be used in medical applications. In this study, due to the limited power level of the used light source, verification of the upper threshold was not performed. In order to investigate any possible thermal damages on neurons, the temperature elevation at the power of higher than 40 mW must be analyzed. Using continuous wave stimulation at 808 nm with a power above 50 mW, it is expected that the temperature would increase by , leading to hyperthermia that will evoke conformational changes of proteins and enzymes, membrane alternation, or tissue necrosis. As of yet, we have seen neuronal activities increased or reduced by optical stimulation only in cells that were already active before the stimulation. A case where NIS initiated neural activities in neurons which had been silent before the stimulation has not been identified. However, since the mechanism of optical stimulation has been found to be distinctively different from that of electrical stimulation, the capability of NIS to trigger action potentials in neurons in various conditions needs to be verified in order to determine the range of applications for this new technique. AcknowledgmentsThis work was supported by grants from the National Research Foundation (NRF) funded by Ministry of Education, Science & Technology (2011-0016796 and 2010-0026438), a grant from the Korean Health Technology R&D Project funded by Ministry of Health & Welfare (HI09C-1188-030013), and a grant from the Institute of Medical System Engineering (iMSE) in the GIST, Korea. ReferencesA. ArvanitakiN. Chalazonitis, Excitatory and Inhibitory Processes Initiated by Light and Infra-Red Radiations in Single Identifiable Nerve Cells (Giant Ganglion Cells of Aplysia, Pergamon Press, Oxford, UK
(1961). Google Scholar
J. Wellset al.,
“Biophysical mechanisms of transient optical stimulation of peripheral nerve,”
Biophys. J., 93
(7), 2567
–2580
(2007). http://dx.doi.org/10.1529/biophysj.107.104786 BIOJAU 0006-3495 Google Scholar
M. G. Shapiroet al.,
“Infrared light excites cells by changing their electrical capacitance,”
Nat. Commun., 3 736
(2012). http://dx.doi.org/10.1038/ncomms1742 NCAOBW 2041-1723 Google Scholar
J. Wellset al.,
“Optical stimulation of neural tissue in vivo,”
Opt. Lett., 30
(5), 504
–506
(2005). http://dx.doi.org/10.1364/OL.30.000504 OPLEDP 0146-9592 Google Scholar
A. D. Izzoet al.,
“Laser stimulation of the auditory nerve,”
Lasers Surg. Med., 38
(8), 745
–753
(2006). http://dx.doi.org/10.1002/(ISSN)1096-9101 LSMEDI 0196-8092 Google Scholar
I. U. Teudtet al.,
“Optical stimulation of the facial nerve: a new monitoring technique?,”
Laryngoscope, 117
(9), 1641
–1647
(2007). http://dx.doi.org/10.1097/MLG.0b013e318074ec00 LARYA8 0023-852X Google Scholar
S. M. Rajguruet al.,
“Infrared photostimulation of the crista ampullaris,”
J. Physiol., 589
(6), 1283
–1294
(2011). http://dx.doi.org/10.1113/tjp.2011.589.issue-6 JPHYA7 0022-3751 Google Scholar
J. M. Cayceet al.,
“Infrared neural stimulation of thalamocortical brain slices,”
IEEE J. Sel. Top. Quantum Electron., 16
(3), 565
–572
(2010). http://dx.doi.org/10.1109/JSTQE.2009.2032424 IJSQEN 1077-260X Google Scholar
H.-J. Fenget al.,
“Alteration of GABAergic neurotransmission by pulsed infrared laser stimulation,”
J. Neurosci. Methods, 192
(1), 110
–114
(2010). http://dx.doi.org/10.1016/j.jneumeth.2010.07.014 JNMEDT 0165-0270 Google Scholar
J. M. Cayceet al.,
“Pulsed infrared light alters neural activity in rat somatosensory cortex in vivo,”
Neuroimage, 57
(1), 155
–166
(2011). http://dx.doi.org/10.1016/j.neuroimage.2011.03.084 NEIMEF 1053-8119 Google Scholar
S. Tozburunet al.,
“Continuous-wave infrared optical nerve stimulation for potential diagnostic applications,”
J. Biomed. Opt., 15
(5), 055012
(2010). http://dx.doi.org/10.1117/1.3500656 JBOPFO 1083-3668 Google Scholar
J. L. Viteket al.,
“Acute stimulation in the external segment of the globus pallidus improves parkinsonian motor signs,”
Mov. Disord., 19
(8), 907
–915
(2004). http://dx.doi.org/10.1002/mds.v19:8 MOVDEA 0885-3185 Google Scholar
T. Hashimotoet al.,
“Stimulation of the subthalamic nucleus changes the firing pattern of pallidal neurons,”
J. Neurosci., 23
(5), 1916
–1923
(2003). JNRSDS 0270-6474 Google Scholar
M. Filaliet al.,
“Stimulation-induced inhibition of neuronal firing in human subthalamic nucleus,”
Exp. Brain Res., 156
(3), 274
–281
(2004). http://dx.doi.org/10.1007/s00221-003-1784-y EXBRAP 0014-4819 Google Scholar
K. C. McGillet al.,
“On the nature and elimination of stimulus artifact in nerve signals evoked and recorded using surface electrodes,”
IEEE Biomed. Eng., 29
(2), 129
–137
(1982). http://dx.doi.org/10.1109/TBME.1982.325019 IEBEAX 0018-9294 Google Scholar
C. A. Milleret al.,
“An improved method of reducing stimulus artifact in the electrically evoked whole-nerve potential,”
Ear Hear., 21
(4), 280
–290
(2000). http://dx.doi.org/10.1097/00003446-200008000-00003 EAHEDS 0196-0202 Google Scholar
J. Wellset al.,
“Application of infrared light for in vivo neural stimulation,”
J. Biomed. Opt., 10
(6), 064003
(2005). http://dx.doi.org/10.1117/1.2121772 JBOPFO 1083-3668 Google Scholar
R. Weissleder,
“A clearer vision for in vivo imaging,”
Nat. Biotechnol., 19
(4), 316
–317
(2001). http://dx.doi.org/10.1038/86684 NABIF9 1087-0156 Google Scholar
G. PaxinosC. Watson, The Rat Brain in Stereotaxic Coordinates: Hard Cover Edition, Academic Press, San Diego, California
(2006). Google Scholar
A. N. Yaroslavskyet al.,
“Optical properties of selected native and coagulated human brain tissues in vitro in the visible and near infrared spectral range,”
Phys. Med. Biol., 47
(12), 2059
–2073
(2002). http://dx.doi.org/10.1088/0031-9155/47/12/305 PHMBA7 0031-9155 Google Scholar
G. M. HaleM. R. Querry,
“Optical constants of water in the 200-nm to 200-μm wavelength region,”
Appl. Opt., 12
(3), 555
–563
(1973). http://dx.doi.org/10.1364/AO.12.000555 APOPAI 0003-6935 Google Scholar
J.-L. Boulnois,
“Photophysical processes in recent medical laser developments: a review,”
Lasers Med. Sci., 1
(1), 47
–66
(1986). http://dx.doi.org/10.1007/BF02030737 LMSCEZ 1435-604X Google Scholar
M. Lidierth,
“sigTOOL: a MATLAB-based environment for sharing laboratory-developed software to analyze biological signals,”
J. Neurosci. Methods, 178
(1), 188
–196
(2009). http://dx.doi.org/10.1016/j.jneumeth.2008.11.004 JNMEDT 0165-0270 Google Scholar
R. Q. QuirogaZ. NadasdyY. Ben-Shaul,
“Unsupervised spike detection and sorting with wavelets and superparamagnetic clustering,”
Neural Comput., 16
(8), 1661
–1687
(2004). http://dx.doi.org/10.1162/089976604774201631 NEUCEB 0899-7667 Google Scholar
M. BlattS. WisemanE. Domany,
“Superparamagnetic clustering of data,”
Phys. Rev. Lett., 76
(18), 3251
–3254
(1996). http://dx.doi.org/10.1103/PhysRevLett.76.3251 PRLTAO 0031-9007 Google Scholar
A. RobertsM. Tunstall,
“Mutual re-excitation with post-inhibitory rebound: a simulation study on the mechanisms for locomotor rhythm generation in the spinal cord of xenopus embryos,”
Eur. J. Neurosci., 2
(1), 11
–23
(1990). http://dx.doi.org/10.1111/ejn.1990.2.issue-1 EJONEI 0953-816X Google Scholar
F. GrenierI. TimofeevM. Steriade,
“Leading role of thalamic over cortical neurons during postinhibitory rebound excitation,”
Proc. Natl. Am. Sci. U. S. A., 95
(23), 13929
–13934
(1998). http://dx.doi.org/10.1073/pnas.95.23.13929 PNASA6 0027-8424 Google Scholar
S. Lianget al.,
“Temperature-dependent activation of neurons by continuous near-infrared laser,”
Cell Biochem. Biophys., 53
(1), 33
–42
(2009). http://dx.doi.org/10.1007/s12013-008-9035-2 CBBIFV 1085-9195 Google Scholar
J. Wellset al.,
“Pulsed laser versus electrical energy for peripheral nerve stimulation,”
J. Neurosci. Methods, 163
(2), 326
–337
(2007). http://dx.doi.org/10.1016/j.jneumeth.2007.03.016 JNMEDT 0165-0270 Google Scholar
N. M. Jindraet al.,
“Epidermal laser stimulation of action potentials in the frog sciatic nerve,”
J. Biomed. Opt., 15
(1), 015002
(2010). http://dx.doi.org/10.1117/1.3292014 JBOPFO 1083-3668 Google Scholar
R. G. McCaugheyC. ChlebickiB. J. F. Wong,
“Novel wavelengths for laser nerve stimulation,”
Lasers Surg. Med., 42
(1), 69
–75
(2010). http://dx.doi.org/10.1002/lsm.v42:1 LSMEDI 0196-8092 Google Scholar
I. N. Christieet al.,
“fMRI response to blue light delivery in the naïve brain: implications for combined optogenetic fMRI studies,”
Neuroimage, 66
(C), 634
–641
(2013). http://dx.doi.org/10.1016/j.neuroimage.2012.10.074 NEIMEF 1053-8119 Google Scholar
A. ParentL.-N. Hazrati,
“Functional anatomy of the basal ganglia. II. The place of subthalamic nucleus and external pallidium in basal ganglia circuitry,”
Brain Res. Rev., 20
(1), 128
–154
(1995). http://dx.doi.org/10.1016/0165-0173(94)00008-D BRERD2 0165-0173 Google Scholar
S. T. KitaiH. Kita,
“Anatomy and physiology of the subthalamic nucleus: a driving force of the basal ganglia,”
The Basal Ganglia II. Structure and Function: Current Concepts, 357
–373 Plenum Press, New York
(1987). Google Scholar
A. C. Thompsonet al.,
“Modeling of the temporal effects of heating during infrared neural stimulation,”
J. Biomed. Opt., 18
(3), 035004
(2013). http://dx.doi.org/10.1117/1.JBO.18.3.035004 JBOPFO 1083-3668 Google Scholar
|