
|
|
1.IntroductionIn comparison with conventional two-dimensional (monolayer) cell cultures, three-dimensional (3-D) cultures, e.g., multicellular tumor spheroids, maintain many morphological and biochemical properties of the cells as well as their microenvironment and reflect the in vivo situation rather well.1,2 Three-dimensional cell cultures, however, require microscopic methods with high axial resolution, e.g., confocal laser scanning microscopy3,4 or structured illumination microscopy.5,6 Here, individual planes of a sample can be measured selectively upon illumination of the whole specimen. This, however, often requires high light doses and risks to damage living specimens when several planes are measured successively.7 Phototoxicity and cell damage can be avoided efficiently by light sheet–based fluorescence microscopy or single-plane illumination microscopy (SPIM), where planes under investigation are illuminated selectively in a direction perpendicular to the observation path.8,9 Although only two commercial light sheet microscopes have been reported so far (Lightsheet Z.1, Carl Zeiss AG, Jena, Germany; Ultramicroscope, LaVision GmbH, Bielefeld, Germany), several laboratory apparatus have meanwhile been established (see, e.g., Refs. 1011.12. to 13). In the present paper, a modified SPIM system is described, where fluorescence excitation occurs alternatively by two laser wavelengths (391 and 470 nm) to excite the oxidized and the reduced form of a redox sensitive green fluorescent protein (roGFP2) in a genetically encoded sensor system (Grx1-roGFP2) specific for the glutathione redox potential .14,15 Both forms are excited repeatedly in nanosecond intervals, and ratio images of fluorescence intensity are calculated immediately afterward. While this sensor system is finally dedicated to measure oxygen radicals in experimental tumor therapy, preliminary experiments about the influence of an oxidizing agent (hydrogen peroxide) applied via a microfluidic system (see Ref. 13) as well as about changes of the redox state upon the induction of apoptosis are reported here. Samples are excited by two series of high-repetition laser pulses with a nanosecond time shift between each other. An additional time shift of the fluorescence signal excited at 470 nm as compared with that excited at 391 nm by an image transmitting fiber bundle permits detection of both images simultaneously and calculation of the fluorescence ratio as a function of the redox state. 2.Materials and MethodsU251MG glioblastoma cells were permanently transfected with the glutathione-sensitive green fluorescent redox sensor Grx1-roGFP2, as described elsewhere.16 The sensor was expressed either within the cytoplasm (U251MG-L106-Grx1-roGFP2 alias U251MG-L106-RS) or within the mitochondria (U251MG-L106-Mito-Grx1-roGFP2 alias U251MG-L106-MRS) of the cells. Cell spheroids were grown for 5 to 7 days up to a diameter of after seeding 400 cells per well in agarose gel–coated 96-well plates in Dulbecco's Modified Eagle's Medium (DMEM) culture medium supplemented with 10% fetal calf serum (FCS) and hygromycin B at 5% and 37°C. For light sheet–based fluorescence microscopy, cell spheroids were located in rectangular glass capillaries of 600 μm inner diameter using a pipette. For application of a microfluidic system,13 capillaries were coated with FCS to permit adhesion of the cell spheroids within 3 h. Capillaries were adapted and fixed to the flow system by appropriate tubes (Tygon R3607, IDEX Health & Science GmbH, Wertheim, Germany). Oxidation was induced by 50 μM hydrogen peroxide () dissolved in Earle’s balanced salt solution (EBSS) and pumped through the microcapillary. For induction of apoptosis, cell spheroids were incubated within the microtiter plates with staurosporine (12 μM; 5 h) dissolved in culture medium prior to transfer to the microcapillary. Additional experiments using a spheroid-forming assay showed that concentrations up to 100 μM did not affect spheroid formation, while staurosporine concentrations applied in an early growth state would prevent formation of spheroids. Therefore, cytotoxicity can probably be excluded in the first case, but may play a major role in the second case. For light sheet–based fluorescence microscopy of individual cell layers of thickness, two laser diodes (LDH 400 and LDH 470 with driver PDL 800-B, PicoQuant, Berlin, Germany) were adapted to an existing SPIM module coupled to an inverse fluorescence microscope (Axiovert 200, Carl Zeiss Jena, Germany), as reported previously.13 Chromatic aberration between these laser diodes was corrected by an additional telescope system placed in front of one of the laser diodes to obtain two identical light sheets. In agreement with the literature,15 excitation wavelengths of 391 and 470 nm were used to excite the oxidized and the reduced form of roGFP2 variants, respectively. Fluorescence of roGFP2 variants was recorded at using a long-pass filter. Irradiance was at 391 nm and at 470 nm, i.e., altogether corresponding to a light exposure of during an illumination time of 1 s. While the impact of the apoptosis-inducing agent staurosporine was examined for individual spheroids upon single light exposure, redox changes upon addition of were studied continuously at time intervals of 5 s, resulting in a total light dose of after 200 s (40 exposures) and after a maximum observation time of 300 s (60 exposures). The experimental setup for nanosecond ratio imaging is depicted in Fig. 1. Both laser diodes emit pulses of duration at a repetition rate of 40 MHz corresponding to a time interval of 25 ns between individual pulses. Laser pulses emitted at 391 nm are shifted in time by 12.5 ns in comparison with laser pulses emitted at 470 nm. Fluorescence is commonly detected with a objective lens and split into two parts by a modified dual view device (Dual-View, Optical Insights, Tucson, Arizona). This telecentric system was originally designed for measuring two images simultaneously (without further magnification) in different spectral ranges or for different polarizations on two sections of a camera sensor. In the present modification, spectral ranges and polarizations are identical, but while one of the images directly hits section 2of an image intensifying camera operated again at 40 MHz with a time gate of 1 ns (PicoStar HR with , LaVision GmbH, Göttingen, Germany), the other one is delayed by 12.5 ns using an image-transmitting rectangular fiber bundle (2.30 m length; quality area with individual fibers; Schott North America Inc., Southbridge, Massachusetts) and hits section 1 of the camera. Since the camera permits image detection only after time intervals of 25 ns (i.e., at 12.5, 37.5, 62.5 ns, etc.), fluorescence images excited at 391 nm are always recorded on section 2, while fluorescence images excited at 470 nm are recorded on section 1 of the camera. Images are integrated over a measuring time of 1 s, and a ratio image is calculated by pixel per pixel division immediately afterward. 3.ResultsGeneration of a ratio image upon excitation of Grx1-roGFP2 with two wavelengths (391 and 470 nm) is shown in the upper part of Fig. 2 with the ratio being depicted in a color code. In the lower part of Fig. 2, this ratio is depicted after application of 50 μM in a flow of EBSS at times of 10, 30, or 90 s. The figure shows an increasing ratio of oxidized versus reduced Grx1-roGFP2. Increase occurs only in a period of 0 to 90 s after application (prior to saturation) and is by a factor 2 to 3 more pronounced in the peripheral than in the central parts of the spheroid (for details, see Fig. 3). Assuming a light dose of to be nonphototoxic for GFP mutants,7 this implies that at least up to 200 s light-induced cell damage can probably be excluded.7 Fig. 2Calculation of the ratio image of Grx1-roGFP2 after excitation at 391 and 470 nm (upper part); ratio image of a single plane (10 μm thickness) of a U251MG-L106-RS multicellular spheroid at a distance of 60 μm from its edge after application of 50 μM for various times by microfluidics (lower part). 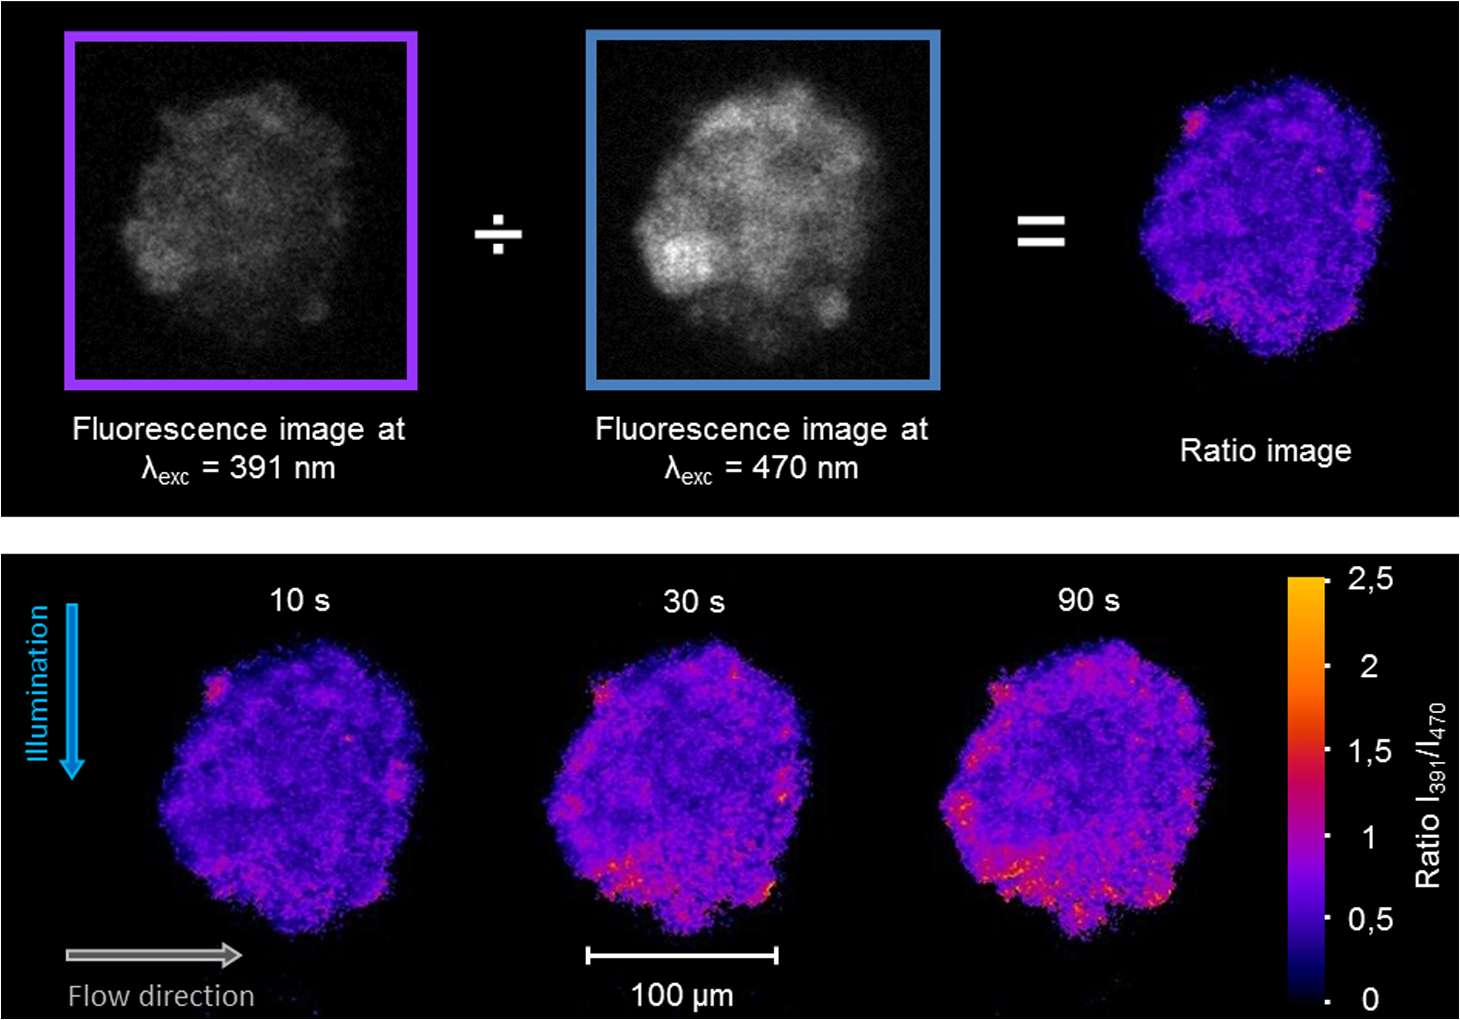 Fig. 3Mean ratio values () of the fluorescence intensities excited at 391 and 470 nm within a 10-μm layer of a spheroid of U251MG-L106-RS cells in dependence of the time after application of (50 μM in Earle’s balanced salt solution). The blue curve is calculated from the full area of the spheroid layer. The red and the green curves are calculated from the inner and the outer areas of the layer, respectively. Selection of these areas is depicted in the inlay of the figure.  In Fig. 4, the ratio of oxidized versus reduced Grx1-roGFP2 is depicted for U251MG-L106-RS and U251MG-L106-MRS glioblastoma cells before and after treatment with the apoptosis-inducing agent staurosporine applied for 5 h at a concentration of 12 μM. While the starting value of this ratio is higher for U251MG-L106-RS (expressing the Grx1-roGFP2 redox sensor in the cytoplasm) than for U251MG-L106-MRS (expressing the sensor in the mitochondria), this ratio increases by a factor around 1.5 for both cell lines after stimulation. As depicted in Fig. 5, the ratio is slightly higher in the central than in the peripheral parts of the spheroid, indicating more pronounced glutathione oxidation in the central part. The changes of upon treatment with staurosporine resemble those which were previously observed in single cells subsequent to Tumor Necrosis Factor Related Apoptosis Inducing Ligand (TRAIL)-mediated induction of apoptosis.14 Fig. 4intensity ratio measured in 10-μm layers of U251MG-L106-RS and U251MG-L106-MRS spheroids prior (control) and after incubation with staurosporine (12 μM, 5 h). Medians and median absolute deviations are calculated from individual layers of three to five spheroids each at a distance of 60 μm from their edge.  Fig. 5Ratio images of single planes (10-μm thickness) of U251MG multicellular spheroids at a distance of 60 μm from its edge prior (left) and after (right) staurosporine-mediated induction of apoptosis. The Grx1-roGFP2 redox sensor was expressed either in the cytoplasm (upper images) or in the mitochondria (lower images). 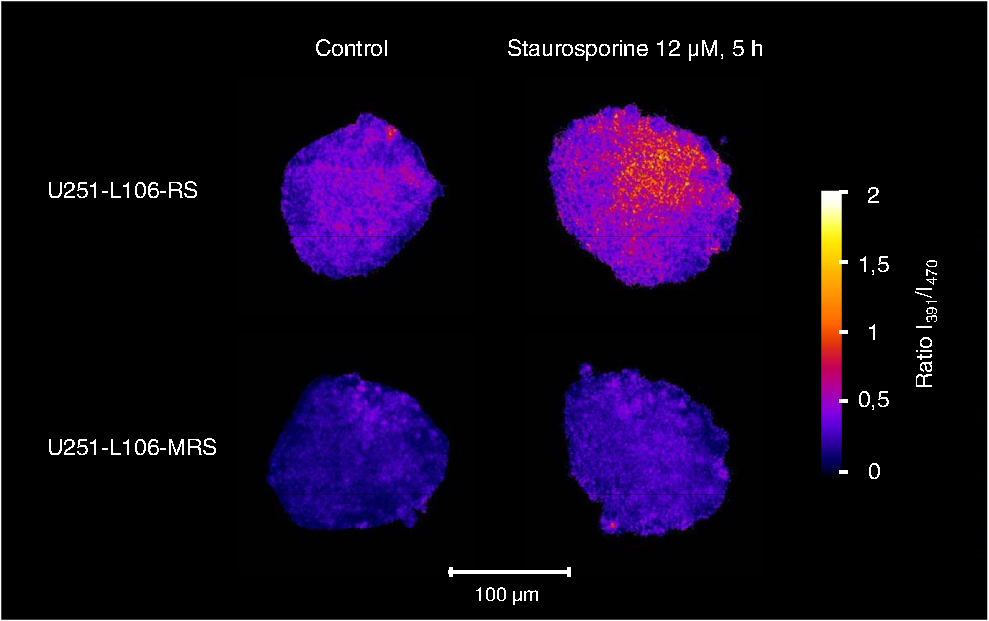 4.DiscussionThe present paper describes a method of real-time ratio imaging of genetically encoded fluorophores whose emission properties are identical, but whose absorption spectra change upon variation of the redox state. In contrast to ratio imaging systems used, e.g., for measurement of calcium ions,17,18 no tuning elements, e.g., rapidly rotating filter wheels, are needed, which makes the whole setup very stable. Only half of the laser pulse energy can be used for time-gated fluorescence experiments, and only part of the fluorescence signal can be recorded after each laser pulse within the limited time gate of the camera system ( if a time gate of 1 ns and a fluorescence lifetime of for Grx1-roGFP2 are considered). However, efficiency in fluorescence detection will be increased when novel camera systems with prolonged gating times are available. When assuming a fluorescence lifetime of (similar to other GFP variants), of fluorescence intensity is maintained after 12.5 ns, i.e., when the next laser pulse excites the sample. This implies that intensity values used for ratio imaging and measured in a time-gated mode may include errors within this order of magnitude. All images have to be adapted to the square diameter of the fiber bundle, independent of whether they pass through this bundle or hit the camera directly. This implies that the active detection area of each section of the image-intensifying camera consists of only , thus limiting the resolution of images (see Figs. 2 and 5) and possibly creating interference problems, if individual fibers are imaged on of the camera. In present experiments, where images of are recorded, resolution of per pixel is lower than the optical resolution (with and ), but may be improved when using objective lenses of higher magnification. Interference problems including light diffraction by individual fibers of the bundle seem to play only a minor role since the quality of images hitting the camera directly and those passing through the fiber is approximately the same. Transmission of the fiber bundle of has been taken into account by adjusting the excitation power for fluorescence light passing through this fiber bundle about three times higher than the excitation power for fluorescence light hitting the camera directly. Ratio imaging has been adapted to light sheet–based fluorescence microscopy, which is a preferential 3-D method for long-term observation at a minimum light dose applied to living cells. Wavelength-dependent light scattering, which might create some shadows and, therefore, artifacts, in ratio imaging was not considered, so far, and obviously did not play a major role in the present images. Those artifacts, however, might be more pronounced in larger spheroids and could in principle be reduced or avoided by improved conditions of illumination, e.g., by variation of the illumination angle in a wobbling mode19 or by use of a self-reconstructing Bessel beam instead of a Gaussian laser beam.11 A further method for reduction of artifacts due to light scattering could be light sheet microscopy with laser scanning excitation and confocal slit detection, as previously described in the literature.20,21 In addition, the method of ratio imaging can be easily modified for other wide-field techniques, e.g., structured illumination microscopy.5,6 When using those techniques, nonphototoxic light doses may be similar to light sheet–based microscopy, if only one cell layer is examined. For measurements of several cell layers, however, the light doses sum up, since in contrast to light sheet microscopy, the whole sample is illuminated upon measurement of each layer, thus reducing the possible number of exposures. Coupling to a microfluidic system is advantageous for observation of rapid redox changes and for minimizing the quantity of agents (e.g., antioxidizing or pharmaceutical agents) used for cancer treatment. Due to an increasing importance of time-gated detection as well as the availability of high-quality image transmitting fiber bundles, nanosecond ratio imaging may be used for further applications in the future, such as calcium imaging. In addition, fluorescence lifetime imaging or Förster resonance energy transfer spectroscopy22–24 can be applied online with only minor modifications of the technical setup, thus offering further perspective in 3-D cell biology and cancer research. AcknowledgmentsThis project was funded by the Land Baden-Württemberg as well as by the European Union, Europäischer Fonds für die Regionale Entwicklung. The authors thank Meike Schlumberger for her experiments on spheroid formation upon incubation with or staurosporine as well as Claudia Hintze for technical assistance. ReferencesA. Abbott,
“Cell culture: biology’s new dimension,”
Nature, 424
(6951), 870
–872
(2003). http://dx.doi.org/10.1038/424870a NATUAS 0028-0836 Google Scholar
L. A. Kunz-Schughartet al.,
“The use of 3-D cultures for high throughput screening: the multi-cellular spheroid model,”
J. Biomol. Screen., 9
(9), 273
–285
(2004). http://dx.doi.org/10.1177/1087057104265040 JBISF3 1087-0571 Google Scholar
J. Pawley, Handbook of Biological Confocal Microscopy, Plenum Press, New York
(1990). Google Scholar
R. H. Webb,
“Confocal optical microscopy,”
Rep. Prog. Phys., 59 427
–471
(1996). http://dx.doi.org/10.1088/0034-4885/59/3/003 RPPHAG 0034-4885 Google Scholar
M. A. NeilR. JuskaitisT. Wilson,
“Method of obtaining optical sectioning by using structured light in a conventional microscope,”
Opt. Lett., 22
(24), 1905
–1907
(1997). http://dx.doi.org/10.1364/OL.22.001905 OPLEDP 0146-9592 Google Scholar
M. G. L. Gustafssonet al.,
“Three-dimensional resolution doubling in wide-field fluorescence microscopy by structured illumination,”
Biophys. J., 94
(12), 4957
–4970
(2008). http://dx.doi.org/10.1529/biophysj.107.120345 BIOJAU 0006-3495 Google Scholar
H. Schneckenburgeret al.,
“Light exposure and cell viability in fluorescence microscopy,”
J. Microsc., 245
(3), 311
–318
(2012). http://dx.doi.org/10.1111/jmi.2012.245.issue-3 JMICAR 0022-2720 Google Scholar
J. HuiskenD. Y. R. Stainier,
“Selective plane illumination microscopy techniques in development biology,”
Development, 136
(12), 1963
–1975
(2009). http://dx.doi.org/10.1242/dev.022426 DEVPED 0950-1991 Google Scholar
P. A. Santi,
“Light sheet fluorescence microscopy: a review,”
J. Histochem. Cytochem., 59
(2), 129
–138
(2011). http://dx.doi.org/10.1369/0022155410394857 JHCYAS 0022-1554 Google Scholar
J. Huiskenet al.,
“Optical sectioning deep inside live embryos by SPIM,”
Science, 305
(5686), 1007
–1009
(2004). http://dx.doi.org/10.1126/science.1100035 SCIEAS 0036-8075 Google Scholar
F. O. FahrbachA. Rohrbach,
“A line-scanned light-sheet microscope with phase shaped self-reconstructing beams,”
Opt. Express, 18
(23), 24229
–24244
(2010). http://dx.doi.org/10.1364/OE.18.024229 OPEXFF 1094-4087 Google Scholar
J. G. Ritteret al.,
“Light sheet microscopy for single molecule tracking in living tissue,”
PLoS One, 5
(7), e11639
(2010). http://dx.doi.org/10.1371/journal.pone.0011639 1932-6203 Google Scholar
T. Brunset al.,
“Preparation strategy and illumination of 3D cell cultures in light-sheet based fluorescence microscopy,”
J. Biomed. Opt., 17
(10), 101518
(2012). http://dx.doi.org/10.1117/1.JBO.17.10.101518 JBOPFO 1083-3668 Google Scholar
M. Gutscheret al.,
“Real-time imaging of the intracellular glutathione redox potential,”
Nat. Methods, 5
(6), 553
–559
(2008). http://dx.doi.org/10.1038/nmeth.1212 1548-7091 Google Scholar
C. T. Dooleyet al.,
“Imaging dynamic redox changes in mammalian cells with green fluorescent protein indicators,”
J. Biol. Chem., 279
(21), 22284
–22293
(2004). http://dx.doi.org/10.1074/jbc.M312847200 JBCHA3 0021-9258 Google Scholar
R. Wittiget al.,
“Biosensor-expressing spheroid cultures for imaging of drug-induced effects in three dimensions,”
J. Biomol. Screen., 18
(6), 736
–743
(2013). http://dx.doi.org/10.1177/1087057113480525 JBISF3 1087-0571 Google Scholar
N. O’ConnorR. B. Silver,
“Ratio imaging: practical considerations for measuring intracellular Ca2+ and pH in living cells,”
Methods Cell Biol., 81 415
–433
(2007). http://dx.doi.org/10.1016/S0091-679X(06)81019-8 MCBLAG 0091-679X Google Scholar
T. FukanoS. ShimozonoA. Miyawaki,
“Development of microscopic systems for high-speed dual-excitation ratiometric Ca2+ imaging,”
Brain Cell. Biol., 36
(1–4), 43
–52
(2008). http://dx.doi.org/10.1007/s11068-008-9033-8 BCBRCH 1559-7105 Google Scholar
L. Silvestriet al.,
“Confocal light sheet microscopy: micron-scale neuroanatomy of the entire mouse brain,”
Opt. Express, 20
(18), 20582
–20598
(2012). http://dx.doi.org/10.1364/OE.20.020582 OPEXFF 1094-4087 Google Scholar
E. BaumgartU. Kubitscheck,
“Scanned light sheet microscopy with confocal slit detection,”
Opt. Express, 20
(19), 21805
–21814
(2012). http://dx.doi.org/10.1364/OE.20.021805 OPEXFF 1094-4087 Google Scholar
H. C. Ishikawa-AnkerholdR. AnkerholdG. P. Drummen,
“Advanced fluorescence microscopy techniques—FRAP, FLIP, FLAP, FRET and FLIM,”
Molecules, 17
(4), 4047
–4132
(2012). http://dx.doi.org/10.3390/molecules17044047 MOLEFW 1420-3049 Google Scholar
J. Siegelet al.,
“Studying biological tissue with fluorescence lifetime imaging: microscopy, endoscopy and complex decay profiles,”
Appl. Opt., 42
(16), 2995
–3004
(2003). http://dx.doi.org/10.1364/AO.42.002995 APOPAI 0003-6935 Google Scholar
H. Schneckenburgeret al.,
“Laser-assisted fluorescence microscopy for measuring cell membrane dynamics,”
Photochem. Photobiol. Sci., 3
(8), 817
–822
(2004). http://dx.doi.org/10.1039/b317047k PPSHCB 1474-905X Google Scholar
|


