|
|
1.IntroductionDiffuse optical tomography (DOT) in the near-infrared (NIR) spectrum provides a unique approach for functional diagnostic imaging. This imaging technique can detect endogenous absorbers and also determine the hemoglobin concentration and oxygen saturation.1–9 To overcome the intensive light scattering inside the biological tissue which results in poor localization and low quantification of the lesion, DOT is usually guided by other imaging modalities, such as ultrasound,10 magnetic resonance imaging,11 and x-ray.12 Our laboratory developed an ultrasound-guided diffuse optical imaging system and showed promising results on early cancer diagnosis and neoadjuvant chemotherapy monitoring.10,13,14 However, due to the different contrast mechanisms, some lesions may not be detectable by a nonoptical modality but yet may have a high optical contrast.15,16 For example, mammography alone had the sensitivity and specificity of 78% and 99%; correspondingly, ultrasound alone has the sensitivity and specificity of 75% and 93%.15 As a result, an imaging modality that relies on an optical contrast to provide the guidance is desirable for DOT. Photoacoustic tomography (PAT) is an emerging technique which can provide optical energy absorption distribution inside the medium at ultrasound resolution.17–22 PAT utilizes a short-pulsed laser beam to penetrate into tissue diffusively. Upon the absorption of the light by the target, photoacoustic waves are generated and used to reconstruct the image at ultrasound resolution. Several groups have investigated quantitative PAT with the help of diffuse optical imaging.23–26 Conversely, PAT can serve as an excellent complementary modality for improving the quantification accuracy of DOT by providing high-resolution optical contrast imaging.27–30 Jiang’s group recently reported a dual-modality imaging system for image-guided surgery that integrates DOT and photoacoustic imaging (PAI) through a miniaturized hand-held probe based on the microelectromechanical systems (MEMS) scanning mirror.27 Our group recently reported a system29 which combined DOT and PAT where the DOT can provide three-dimensional (3-D) absorption coefficient distribution and the PAT can provide two-dimensional (2-D) distribution of the absorbed optical density at the cross section where the ultrasound transducer was located. The DOT image reconstructions without any a priori information only have an average accuracy of about 26% of the true values. Using the location information provided by the PAT image, the absorption coefficient quantification accuracies can reach 71% of the true values on average for both high and low contrast targets. In addition to the endogenous absorbers, different exogenous contrast agents have been developed to enhance the contrast of malignant tumors versus normal tissues.31–33 Indocyanine green (ICG) is the only Food and Drug Administration (FDA) approved absorption and fluorescent contrast agent in the NIR range and has been widely adopted as a contrast agent in diffuse and fluorescence optical tomography.33–39 In this study, we explore the feasibility of using a combined 3-D DOT and 2-D PAT system to detect the enhancement of ICG in the phantom and small animal experiments. This method can potentially improve the accuracy of detecting small breast lesions or any lesions which are sensitive to background tissue optical property changes, such as the lesions located on the chest wall. 2.Method2.1.Experiment System2.1.1.PAI systemThe details of the combined system have been described in Ref. 29. The experimental configuration is shown in Fig. 1(a). Briefly, a Ti:Sapphire (Symphotics TII, LS-2134, Camarillo, California) laser optically pumped by a Q-switched Nd:YAG laser (Symphotics-TII, LS-2122) delivered 20 ns pulses at 15 Hz. The laser output was coupled into two 1000-μm core step-index fibers (Thorlabs, BFL48-1000, Newton, New Jersey) using a convex lens and circular beam splitter arrangement as shown in this figure. The convex lens, which has 99% transmittance at 750-nm wavelength, has a focal length of 20 cm and focuses the light into the pair of fibers which are placed at its focal point. The beam splitter was used to split the incoming beam into two beams, and it was measured to have about 50/50 transmitting and reflecting split ratio used for the experiment. The overall coupling efficiency of the setup (including the losses in the lens and beam splitter) was about 85% and the total output energy was about . The two output ends of the fibers were attached to the probe shown in Fig. 1(b) and used for PAI. During the course of the experiments, two array-based ultrasound transducers centered at 1.3 MHz (Vermon, France) and 6 MHz (W.L. Gore & Associates Inc., Newark, Delaware) having 120% and 80% fractional bandwidths, respectively, were used depending on the target size and depth. The PAT data were collected by a home-made system,40,41 which is capable of performing real-time PAT and ultrasound data collection and display. The system consists of eight 16-channel customized modules combined to form a 128-channel system. Each module is controlled by a separate field programmable gate array (FPGA) processor and has all the necessary analog and digital circuitry for ultrasound transmission and reception. The FPGA controls the ultrasound pulse-echo (PE) transmission and detection, the photoacoustic data acquisition process, the parallel processing and storage of the beam, and the real-time switching between the two modalities. The beamformed data storage of each module is made available for a digital signal processor to access using an external memory interface (EMIF). The image reconstruction is done using the delay-and-sum beamforming algorithm. Ultrafast reconfiguration of the FPGA allows it to quickly switch between the two imaging modes, perform transmission control, laser synchronization, internal memory structuring, beamforming, and adjusting the EMIF size and structure. The result is a seamless co-registered PAI that is interlaced with ultrasound PE imaging. This capability is especially valuable in the animal experiments where the ultrasound images assure the lesion location within the PAT images. 2.1.2.Frequency-domain DOT system and dual-mesh reconstruction algorithmThe DOT system used for the experiment was a frequency-domain imager consisting of four laser diodes emitting at 740-, 780-, 808-, and 830-nm wavelengths.42 The outputs of these laser diodes were coupled into nine fibers via a and a optical switches. The nine source fibers were then deployed around the PAT/DOT probe. The geometry of the probe is shown in Fig. 1(b) with the ultrasound transducer located at the center. On the receiving side, 10 3-mm diameter fiber bundles were used to couple the reflected light from the medium to 10 photomultiplier tubes (PMTs). Light from the source fibers was delivered to the medium sequentially, but the received light was detected in parallel by the PMT detectors. Semi-infinite partial reflection boundary condition with an effective refraction coefficient of 0.6 was used for the DOT image reconstruction. To overcome the strong light scattering which can cause poor localization and low quantification of the lesion in the directly reconstructed DOT images, the dual-zone mesh algorithm developed earlier by our group was used for reconstructing the target optical properties.43 Briefly, the entire imaging volume was segmented into a target region and a background region; this segmentation was based on the target absorption map provided by the high-resolution PAT. The center region of the target was read from the reconstructed photoacoustic image in the lateral () dimension, and depth (), as well as a region twice the size of the target diameter. Because the photoacoustic images provided only 2-D information, the target center in the dimension was assumed to be on the same ultrasound transducer plane at . The center locations in the and -directions measured by the PAT were slightly perturbed in the DOT reconstruction in order to obtain an improved convergence as measured by the object function. Because of the intense light scattering, the target size seen by the DOT was much larger than its actual size. A target region with twice the target size was necessary for avoiding the boundary distortion in the reconstructed DOT images. The dual-zone mesh scheme significantly reduces the total number of voxels with unknown optical properties and dramatically improves the convergence of inverse mapping of target optical properties. 2.2.Contrast AgentICG is the only FDA approved contrast agent in the NIR range. It has been widely used in medical practice to determine cardiac output, hepatic function, and liver blood flow, and for ophthalmic angiography.39 It has a peak spectral absorption at about 800 nm,44–46 so it is also adopted as a contrast agent in diffuse and fluorescence optical tomography in the NIR range.33–38 An ICG derivative, the bis-carboxylic acid ICG derivative, was used in this study; this derivative will be referred to simply as “ICG” in the rest of this paper. The details of the chemical structure and synthesizing procedures can be found in Ref. 47. This ICG at 1 μM has an absorption peak at 755 nm and a fluorescent emission peak at 778 nm. It also has a quantum yield of 0.066, which is 5.5 times higher than that of commercially available ICG purchased from Sigma–Aldrich, St. Louis, Missouri.48 In the phantom experiment, the ICG was diluted to different concentrations from 100 to 10 μM. To make ICG phantoms for both PAT and DOT imaging, about 0.15 mL of the diluted ICG was poured into a transparent plastic bubble with dimensions of . 2.3.Animal Tumor ModelIn vivo tumor imaging experiments were performed using a murine tumor model (4T1 Luc mouse mammary carcinoma cells grown in BALB/c mice). The animal protocol was approved by the Institutional Animal Care and Use Committee of University of Connecticut. 4T1 Luc cells were cultured at 37°C with 5% in RPMI 1640 medium (Gibco, USA), supplemented with 10% fetal bovine serum, penicillin/streptomycin, 2 mM l-glutamine, and 1 mM pyruvate. The 4T1 Luc cells were passaged three times at 70 to 80% confluence in a T75 flask (BD Biosciences, Bedford, MA, USA) prior to injection. About were injected into the lower right mammary fat-pad of 7-week old BALB/c female mice. The in vivo experiments were performed when the tumor sizes reached approximately 6 to 8 mm in diameter, 2 to 3 weeks postinnoculation. All the experiments were performed under anesthesia by the inhalation of 1.5% isoflurane. 3.Results and Discussion3.1.Phantom ExperimentTo obtain the range of detectable ICG concentration with our system, the phantoms with diluted ICG at different concentrations of 100, 50, 20, and 10 μM were used. The phantoms were immersed in 0.6% intralipid solution49 with the calibrated optical properties of and . The center depth of the phantom from the surface of the combined probe varied from 1.5 to 2.5 cm. Figure 2 shows the PAT and DOT images when the ICG phantoms were located at 2.0-cm depths. The figures in the left column are the reconstructed PAT images and those on the right column are the reconstructed DOT images at 780 nm. In each PAT image, the horizontal axis corresponds to the -axis in Fig. 1(b) and the vertical axis indicates the depth, while the phantom is inside the white circle. Figure 2(a1) shows clear top and bottom boundaries of phantom which indicates a strong photoacoustic signal. As the concentration decreases, the photoacoustic signals are weaker and the image intensities are decreasing as well. In each DOT image, each slice is the spatial images of . The depth of each slice is marked in this figure. Clearly with the depth information provided in the PAT images, it is seen that the reconstructed absorption coefficients from the DOT images decreases as the ICG concentration changes. The reconstructed absorption coefficient maximum values from DOT at different depths are listed in Table 1. Fig. 2PAT and DOT images of the phantom experiments. Left column is PAT image and right column is DOT image. (a), (b), (c), and (d) indicate different concentrations of ICG from 100, 50, 20, and 10 μM, respectively. 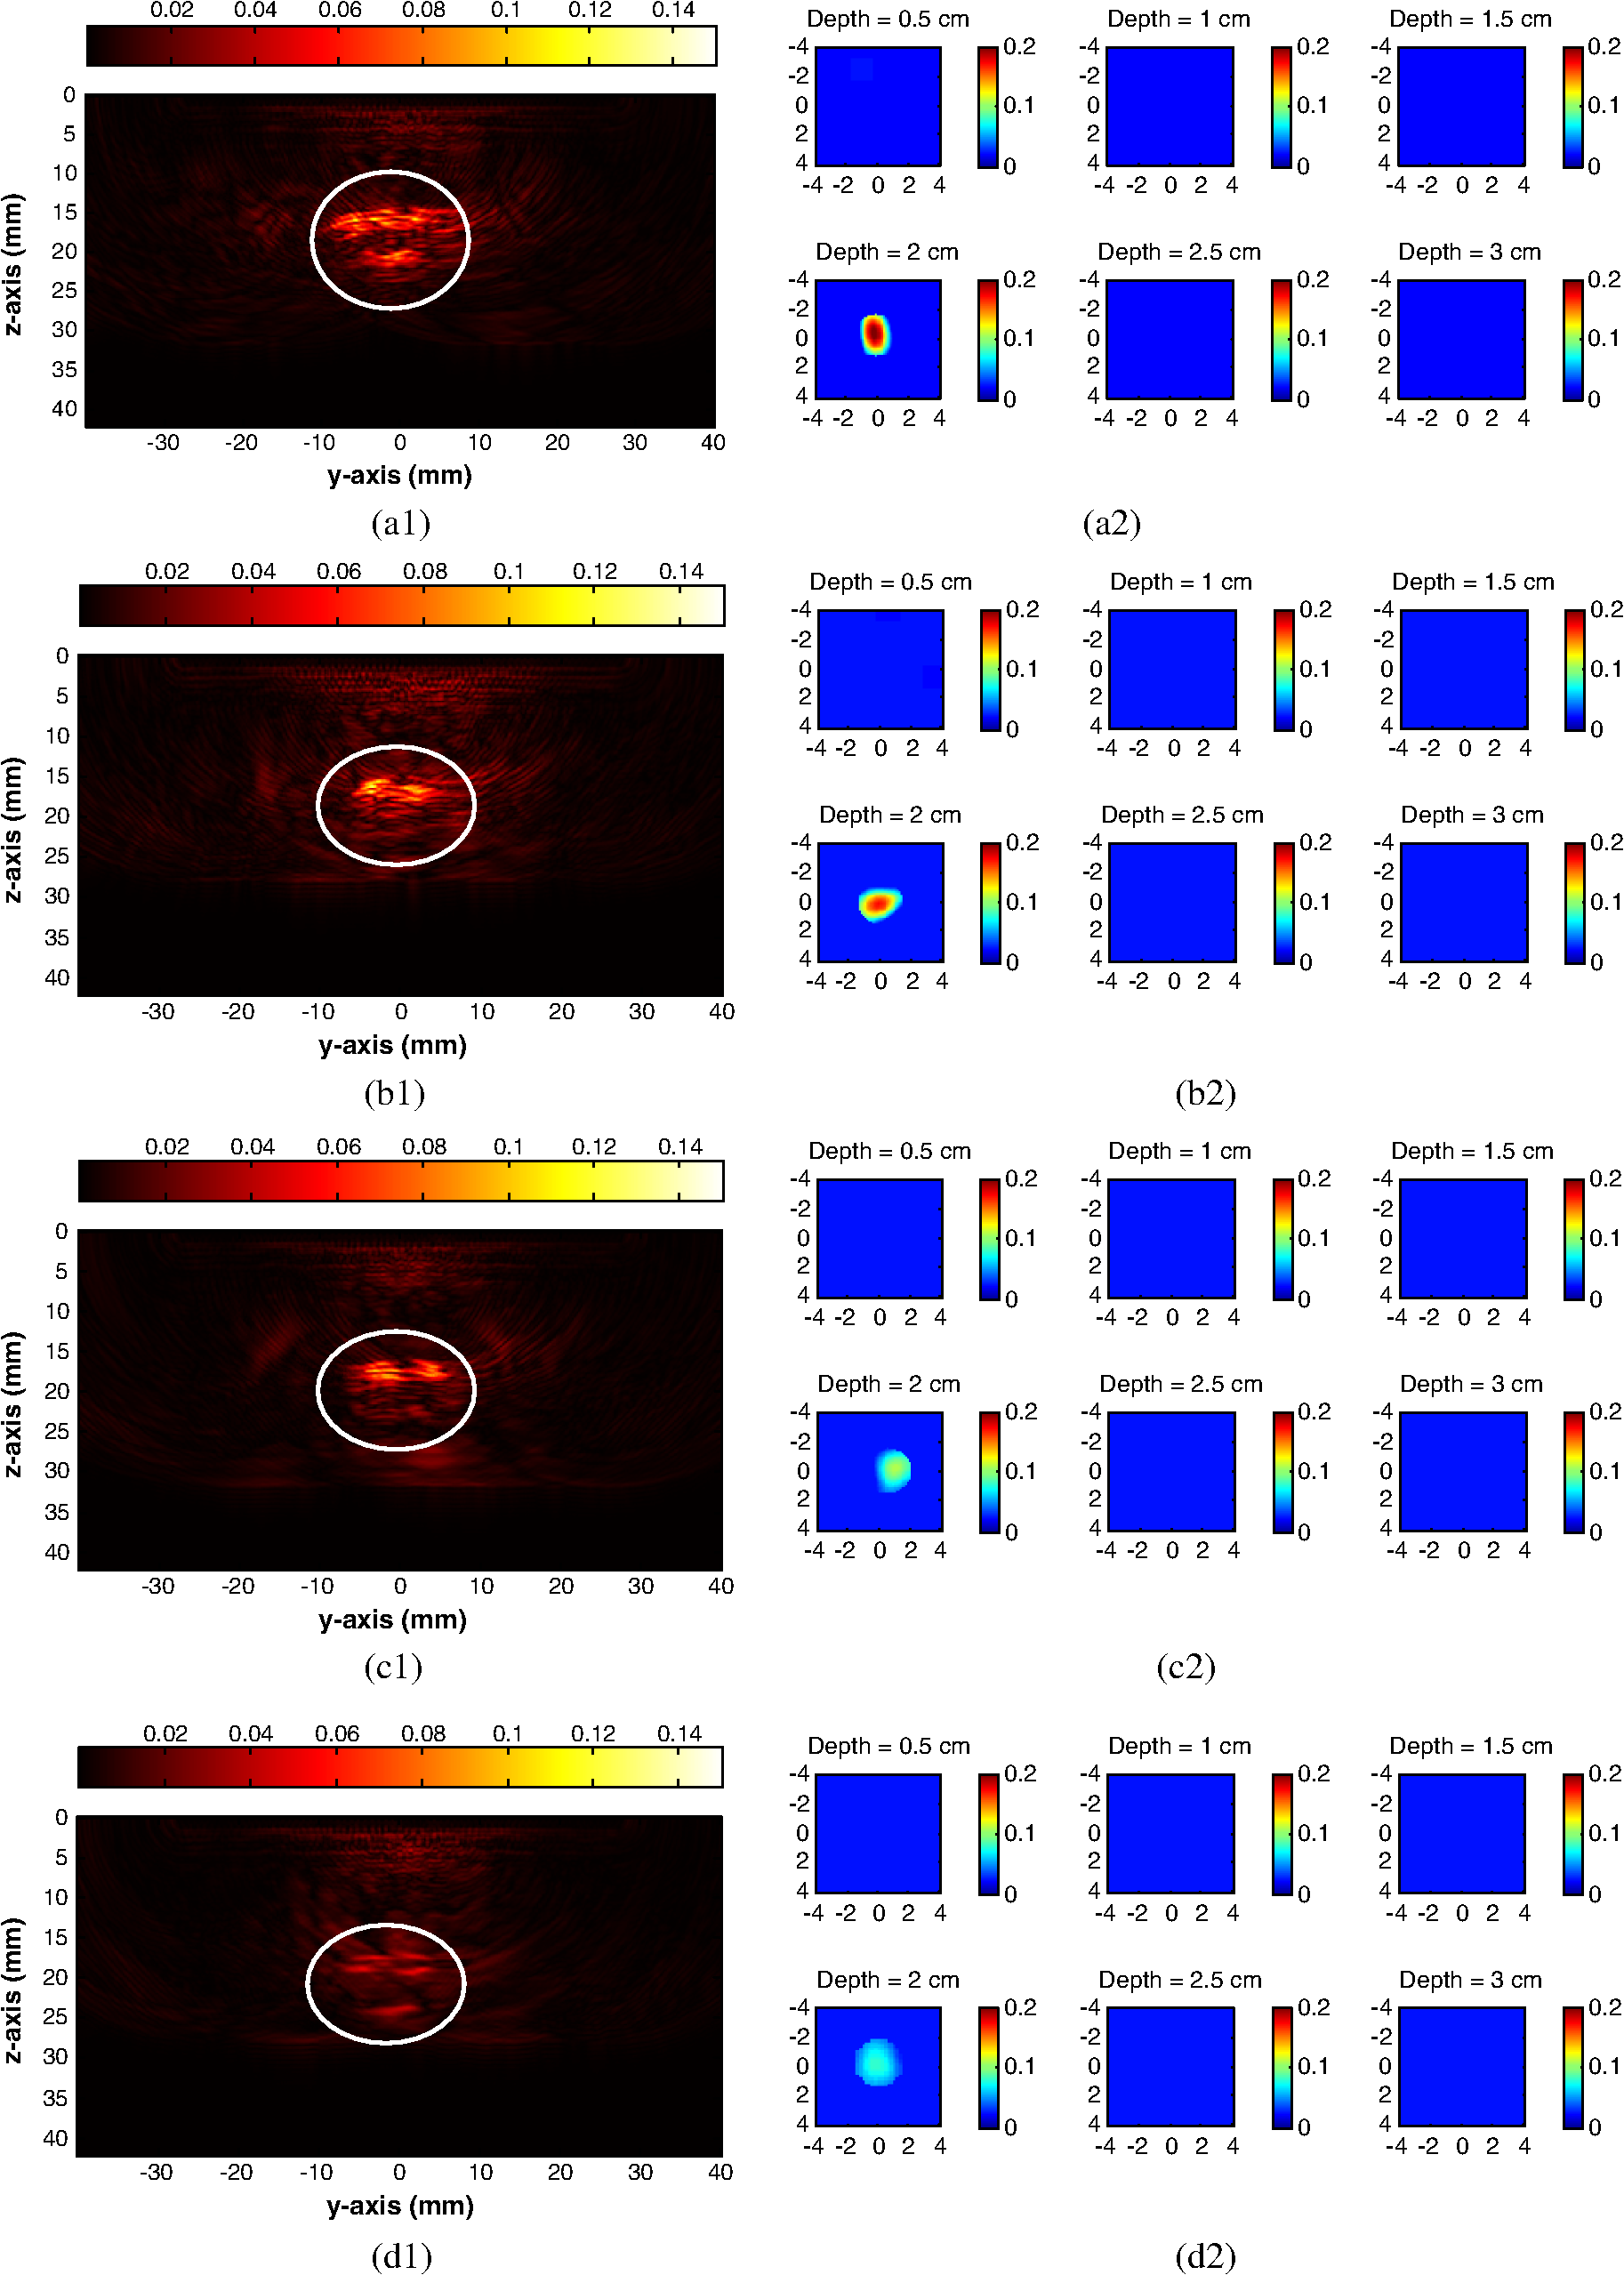 Table 1DOT reconstructed maximum values of ICG phantom at different concentrations.
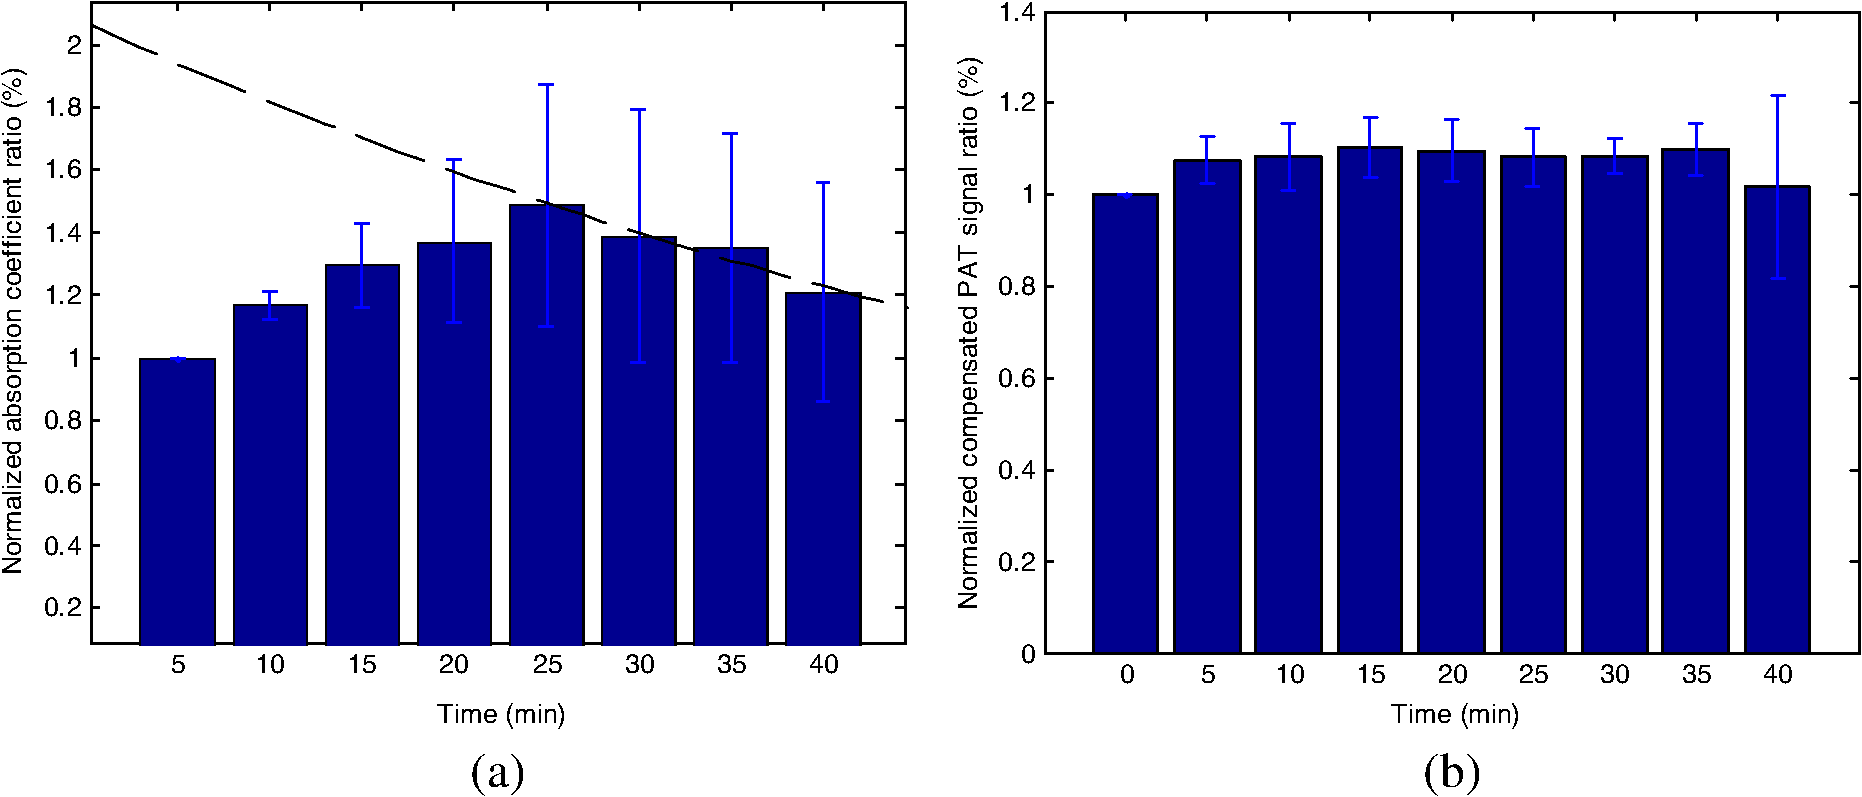
3.2.Animal ExperimentsWe used the murine tumor model to monitor the ICG uptake and washout time using the combined system. During the experiments, the mouse was placed on a plastic platform with the area at the junction of mouse’s leg and torso facing the imaging probe, as shown in Fig. 3(a). The mouse was anesthetized under isoflurane anesthesia using a nose cone during the experiment and the body of the mouse was merged in the 0.6% intralipid which was heated and stirred to keep at body temperature evenly throughout the experiments. The experimental timeline is described in Fig. 3(b). At the beginning of the experiment ( time point), PAT and ultrasound images were collected in order to re-position the tumor at the center of the imaging probe. The DOT data at this location were collected as the reference for the image reconstruction later. Then at time zero, the mouse was injected intravenously through retro-orbital injections with a dose of 100 μl of 100 μM ICG. The PAT and DOT data were continuously collected every 5 min after the injection for 40 min. Because the condition of the mice under long periods of anesthesia is very unpredictable, 40 min was used as the time limit allowed for mouse under anesthesia in the animal experiments. Fig. 3(a) In vivo experiment setup and (b) in vivo experimental time line. Collecting PAT/DOT reference data at point, ICG injection at zero point, then collecting PAT/DOT data every 5 min.  Figure 4 shows the experimental results of the DOT images in the time sequence (not shown all the images, only the initial point, the peak point, and the end point). Figures 4(a)–4(c) are the reconstructed DOT image at 5, 25, and 40 min after the injection. Each image is in the and spatial dimensions at the corresponding target depth, and the color bar represents the reconstructed absorption coefficient. The maximum values at each time point are 0.0295, 0.0347, 0.0440, 0.0517, 0.0602, 0.0585, 0.0560, and from 5 to 40 min. Clearly, the ICG concentration at the tumor area reached a peak at 25 min, then gradually washed out as shown in Fig. 4(d). The maximum value at 25 min increased about 100% compared to the initial point. Fig. 4DOT image of tumor site at different times. (a) 5 min after injection; (b) 25 min after injection; (c) 40 min after injection and (d) maximum absorption coefficient change over time. 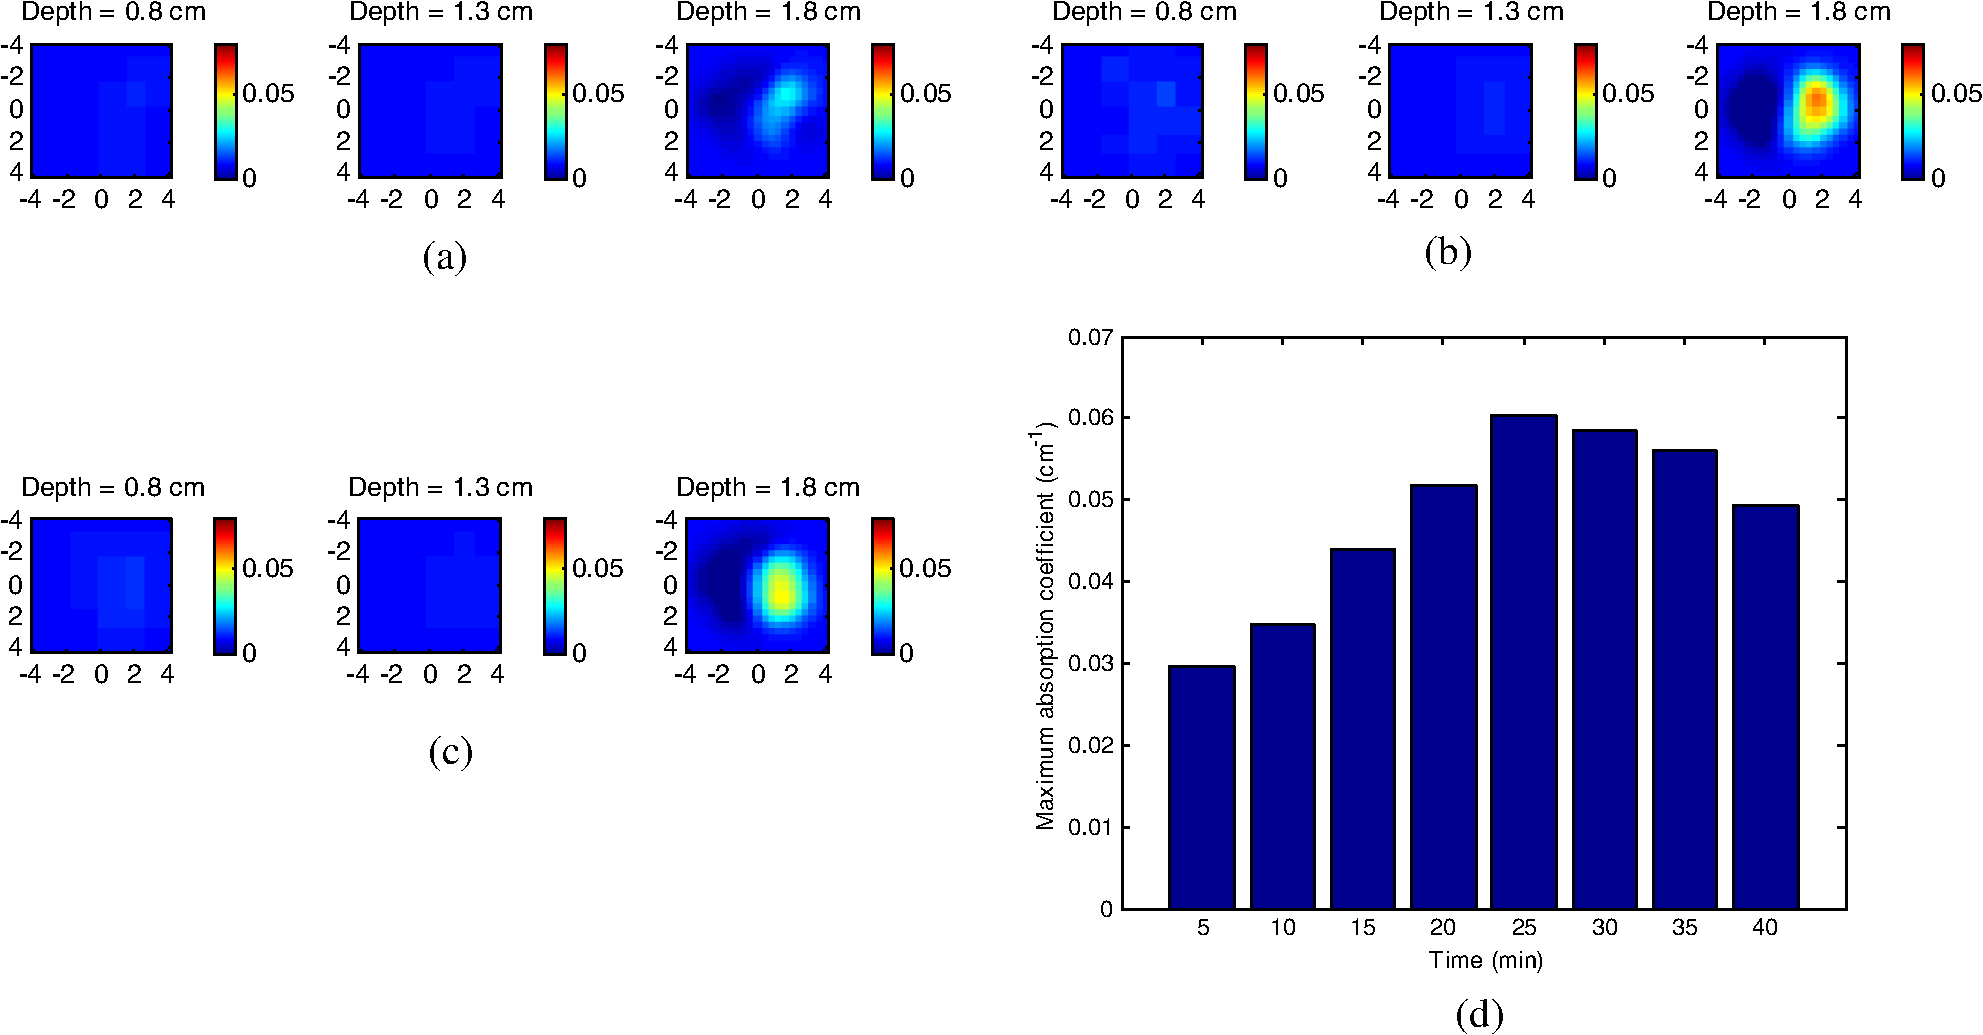 Figure 5 shows the co-registered PAT and ultrasound images at the corresponding time points. The ultrasound images are plotted on a gray scale and photoacoustic images on a color scale. In each image, the horizontal axis corresponds to the -axis in Fig. 1(b) and the vertical axis indicates the depth. As shown in the images, the ultrasound images can provide structural information to the photoacoustic images at the tumor site. Because the photoacoustic signal is directly related to the laser pulse energy, 1% of laser beam of the output laser energy was split using a beam splitter and coupled into a photodiode (PDA10A, ThorLabs, Newton, NJ, USA). The temporal profile of the laser pulse was measured and recorded by a DAQ board (CS22G8, DynamicSignals, Lockport, IL, USA) at 1-GHz sampling rate. As a result, each PAT data and the corresponding photodiode output of the laser pulses were synchronously acquired, and the photoacoustic signal change caused by the laser energy drift can be accurately monitored. The PAT signal of each frame was divided by the average laser pulse peak to compute a compensated PAT signal. Depending on the tumor structure and size information in PE image, a circular window was chosen to closely define the tumor area for computing a PAT summation signal (compensated PAT summation). The compensated PAT summation at the tumor area during the experiment is plotted in Fig. 5(d). It has a small increase after the injection, but there is no significant decrease after that. Fig. 5(a) PAT image of tumor site 5 min after ICG injection. (b) PAT image of tumor site 25 min after ICG injection. (c) PAT image of tumor site 40 min after ICG injection. (d) Compensated total PAT signal at the tumor area changes over time.  Figure 6 shows the statistics of a group of four mice. The DOT ratio change is defined as the ratio between the maximum absorption coefficients at each time point to the initial point. Figure 6(a) shows the DOT ratio change during the experiment with the average ratio change about 45% increase at peak point (25 min). The exponential fitting of the washout period of ICG is also plotted with a half-life about 53 min. Similarly, the PAT ratio change is defined as the ratio between the compensated PAT summation signals at the tumor area at each time point to the compensated PAT summation at the initial point. Figure 6(b) is the ratio change of the PAT signal during the experiment at the tumor area. There is a small increase (about 10%) after the injection, but no significant decrease during the experiments. 4.DiscussionIn our experiments, we used the mice model to determine the uptake and washout of ICG which leaks into the tumor extravascular spaces and accumulates in the tumor bed. However, ICG quickly accumulates at the bladder through the circulation system at the same time. Because of the small body size of the mouse, usually 10 cm in length and 4 cm in width, the ICG accumulation at the bladder can cause artifacts in the DOT imaging. In the earlier mouse experiments, we observed that the two high contrast regions appeared in the reconstructed images: one was the bladder and another was the tumor area. At the beginning, these two areas were separated. As time passed, these two high contrast areas combined into one because the ICG concentration at the bladder increased. To remove the artifact from the bladder, a shielding layer made with a dark plastic material was used to cover the bladder area to prevent it from absorbing light. The phantom experiments were performed to test the effectiveness of the shielding layer. Two ICG phantoms with a separation of 2 cm were placed in the scattered medium. When there was no shielding layer, the DOT image acquired showed two targets with the maximum absorption coefficients of 0.073 and , separately. When the shielding layer was applied and only let light to illuminate the center target, the reconstructed image only showed the center target with the maximum absorption coefficient of . We believe the shielding layer was sufficient in blocking the side target. This was proved in the mice experiments later, where only the tumors were shown in the reconstructed DOT images. However, if the signal from the side target such as bladder in the mice experiment was too strong, there might still have been some detectable signals from the bladder even with the shielding layer in place. These detectable signals might cause a little shifting of the target location and a higher reconstructed value. We suspect this is the reason for the longer half-life for ICG (53 min) in this experiment compared to other experiments, where the half-time of ICG is approximately 30 min.48 However, the errors and artifacts caused by the bladder are only related to the current animal model. If we move to a patient study in a clinical setting, the bladder issue would not be a problem and more accurate results are expected. In our experiments, we noticed that the DOT and PAT images perform differently when tracing the ICG uptake and washout process, even though both imaging modalities are using optical contrast. DOT can observe about 40% increment during ICG uptake; PAT signals only showed about 10% to 15% change, on the other hand. There are two possible reasons for this difference. Although both DOT and PAT use optical contrast, their mechanisms are still different. In PAT, the local pressure change () which is the source of the photoacoustic wave is directly related to the local optical absorption (), the percentage of energy converting into heat (), and the Grueneisen parameter of the material (), as shown in the formula, .50 The Grueneisen parameter is about 0.2 at room temperature for water or water-based tissue. As a result, PAT can be less sensitive to very weak signals. Another reason is related to the light illumination currently used in the experiments. Since the DOT uses diffused light, it probes a larger area and provides more average tumor optical properties, while the PAT has very limited light illumination comprising only two fibers close to the transducer. Additionally, the 2-D ultrasound transducer has limited view in the tissue as well. As a result, PAT and DOT show different characteristics of tumor. This is consistent with our observations in ovarian cancer experiments.51,52 How to quantitatively combine DOT and PAT information is under further investigation. In this experimental design, the PAT is mainly used to provide the location guidance for DOT. The current system still needs to be improved to perform clinical experiments. Although the body of the animal was merged in the intralipid solution in the current setup, the energy density on the tissue surface was about which is below the required American National Standards Institute (ANSI) safety standard (). However, the probe will directly come into contact with the breast surface and coupling gel in the clinical experiment. The energy density on the surface may exceed the ANSI safety standard. We are looking for more efficient methods to deliver the light to the tissue. One possible way is to use a new fiber assembly which can split light energy from 1 940-μm core input fiber to 19 200-μm core output fibers by applying a proprietary power splitting technology. These will decrease the energy output of the source fibers by a factor of 10. We envision that the operator can hold the combined probe to scan through the breast area in the future clinical trial, same as ultrasound scan operation. 5.ConclusionIn conclusion, we have demonstrated that our PAT-guided DOT system can be used to quantify the absorption coefficient of a lesion with the contrast agent, ICG. The animal experiments also demonstrated that the combined system can monitor the ICG concentration change in the lesion area. We anticipate that this combined system using true optical contrast can improve the diagnosis of breast lesions in the near future. AcknowledgmentsThe authors thank the National Institute of Health (R01EB002136) and ARMY Medical Research and Materiel Command Postdoctal Fellowship award (W81XWH-09-1-0511) for funding this work. The authors also thank Professor Michael B. Smith at the Chemistry Department of the University of Connecticut for providing the ICG derivative to this study. ReferencesB. Tromberget al.,
“Non-invasive in vivo characterization of breast tumors using photon migration spectroscopy,”
Neoplasia, 2
(1:2), 26
–40
(2000). http://dx.doi.org/10.1038/sj.neo.7900082 1522-8002 Google Scholar
D. Leffet al.,
“Diffuse optical imaging of the healthy and diseased breast: a systematic review,”
Breast Cancer Res Treat., 108
(1), 9
–22
(2008). http://dx.doi.org/10.1007/s10549-007-9582-z BCTRD6 0167-6806 Google Scholar
B. Chanceet al.,
“Breast cancer detection based on incremental biochemical and physiological properties of breast cancers: a six-year, two-site study,”
Acad. Radiol., 12
(8), 925
–933
(2005). http://dx.doi.org/10.1016/j.acra.2005.04.016 1076-6332 Google Scholar
S. Poplacket al.,
“Electromagnetic breast imaging: results of a pilot study in women with abnormal mammograms,”
Radiology, 243
(2), 350
–359
(2007). http://dx.doi.org/10.1148/radiol.2432060286 RADLAX 0033-8419 Google Scholar
L. Spinelliet al.,
“Characterization of female breast lesions from multi-wavelength time-resolved optical mammography,”
Phys. Med. Biol., 50
(11), 2489
–2502
(2005). http://dx.doi.org/10.1088/0031-9155/50/11/004 PHMBA7 0031-9155 Google Scholar
R. Choeet al.,
“Diffuse optical tomography of breast cancer during neoadjuvant chemotherapy: a case study with comparison to MRI,”
Med. Phys., 32
(4), 1128
–1139
(2005). http://dx.doi.org/10.1118/1.1869612 MPHYA6 0094-2405 Google Scholar
Q. Zhuet al.,
“The potential role of optical tomography with ultrasound localization in assisting ultrasound diagnosis of early-stage invasive breast cancers,”
Radiology, 256
(2), 367
–378
(2010). http://dx.doi.org/10.1148/radiol.10091237 RADLAX 0033-8419 Google Scholar
X. Guet al.,
“Differentiation of cysts from solid tumors in the breast with diffuse optical tomography,”
Acad. Radiol., 11
(1), 53
–60
(2004). http://dx.doi.org/10.1016/S1076-6332(03)00562-2 1076-6332 Google Scholar
A. Cerussiet al.,
“Predicting response to breast cancer neoadjuvant chemotherapy using diffuse optical spectroscopy,”
Proc. Natl. Acad. Sci. U. S. A., 104
(10), 4014
–4019
(2007). http://dx.doi.org/10.1073/pnas.0611058104 PIPSBD 0370-0046 Google Scholar
Q. ZhuN. ChenS. Kurtzman,
“Imaging tumor angiogenesis using combined near infrared diffusive light and ultrasound,”
Opt. Lett., 28
(5), 337
–339
(2003). http://dx.doi.org/10.1364/OL.28.000337 OPLEDP 0146-9592 Google Scholar
B. Brooksbyet al.,
“Imaging breast adipose and fibroglandular tissue molecular signatures by using hybrid MRI-guided near-infrared spectral tomography,”
Proc. Natl. Acad. Sci. U. S. A., 103
(23), 8828
–8833
(2006). http://dx.doi.org/10.1073/pnas.0509636103 PIPSBD 0370-0046 Google Scholar
Q. Fanget al.,
“Combined optical and X-ray tomosynthesis breast imaging,”
Radiology, 258
(1), 89
–97
(2011). http://dx.doi.org/10.1148/radiol.10082176 RADLAX 0033-8419 Google Scholar
Q. Zhuet al.,
“Early-stage invasive breast cancers: potential role of optical tomography with US localization in assisting diagnosis,”
Radiology, 256
(2), 367
–378
(2010). http://dx.doi.org/10.1148/radiol.10091237 RADLAX 0033-8419 Google Scholar
Q. Zhuet al.,
“Breast cancer: assessing response to neoadjuvant chemotherapy by using US-guided near-infrared tomography,”
Radiology, 266
(2), 433
–442
(2013). http://dx.doi.org/10.1148/radiol.12112415 RADLAX 0033-8419 Google Scholar
W. Berget al.,
“Detection of breast cancer with addition of annual screening ultrasound or a single screening MRI to mammography in women with elevated breast cancer risk,”
J. Am. Med. Assoc., 307
(13), 1394
–1404
(2012). http://dx.doi.org/10.1001/jama.2012.388 1067-5027 Google Scholar
T. KolbJ. LichyJ. H. Newhouse,
“Comparison of the performance of screening mammography, physical examination, and breast US and evaluation of factors that influence them: an analysis of 27,825 patient evaluations,”
Radiology, 225
(1), 165
–175
(2002). http://dx.doi.org/10.1148/radiol.2251011667 RADLAX 0033-8419 Google Scholar
L. V. Wang,
“Prospects of photoacoustic tomography,”
Med. Phys., 35
(12), 5758
–5767
(2008). http://dx.doi.org/10.1118/1.3013698 MPHYA6 0094-2405 Google Scholar
G. Kuet al.,
“Thermoacoustic and photoacoustic tomography of thick biological tissues toward breast imaging,”
Technol. Cancer Res. Treat., 4
(5), 559
–565
(2005). TCRTBS 1533-0346 Google Scholar
D. RazanskyC. VinegoniV. Ntziachristos,
“Imaging of mesoscopic targets using selective-plane photoacoustic tomography,”
Phys. Med. Biol., 54
(9), 2769
–2777
(2009). http://dx.doi.org/10.1088/0031-9155/54/9/012 PHMBA7 0031-9155 Google Scholar
K. H. Songet al.,
“Noninvasive photoacoustic identification of sentinel lymph nodes containing methylene blue in vivo in a rat model,”
J. Biomed. Opt., 13
(5), 054033
(2008). http://dx.doi.org/10.1117/1.2976427 JBOPFO 1083-3668 Google Scholar
S. Ermilovet al.,
“Laser optoacoustic imaging system for detection of breast cancer,”
J. Biomed. Opt., 14
(2), 024007
(2009). http://dx.doi.org/10.1117/1.3086616 JBOPFO 1083-3668 Google Scholar
H. Brechtet al.,
“Whole-body three-dimensional optoacoustic tomography system for small animals,”
J. Biomed. Opt., 14
(6), 064007
(2009). http://dx.doi.org/10.1117/1.3259361 JBOPFO 1083-3668 Google Scholar
L. Yinet al.,
“Tomographic imaging of absolute optical absorption coefficient in turbid media using combined photoacoustic and diffusing light measurements,”
Opt. Lett., 32
(17), 2556
–2558
(2007). http://dx.doi.org/10.1364/OL.32.002556 OPLEDP 0146-9592 Google Scholar
C. Xuet al.,
“Investigation of a diffuse optical measurements-assisted quantitative photoacoustic tomographic method in reflection geometry,”
J. Biomed. Opt., 17
(6), 061213
(2012). http://dx.doi.org/10.1117/1.JBO.17.6.061213 JBOPFO 1083-3668 Google Scholar
A. Baueret al.,
“Quantitative photoacoustic imaging: correcting for heterogeneous light fluence distributions using diffuse optical tomography,”
J. Biomed. Opt., 16
(9), 096061
(2011). http://dx.doi.org/10.1117/1.3626212 JBOPFO 1083-3668 Google Scholar
R. Zemp,
“Quantitative photoacoustic tomography with multiple optical sources,”
Appl. Opt., 49
(18), 3566
–3572
(2010). http://dx.doi.org/10.1364/AO.49.003566 APOPAI 0003-6935 Google Scholar
H. Yanget al.,
“Handheld miniature probe integrating diffuse optical tomography with photoacoustic imaging through a MEMS scanning mirror,”
Biomed. Opt. Express, 4
(3), 427
–432
(2013). http://dx.doi.org/10.1364/BOE.4.000427 BOEICL 2156-7085 Google Scholar
X. Liet al.,
“Integrated diffuse optical tomography and photoacoustic tomography: phantom validations,”
Biomed. Opt. Express, 2
(8), 2348
–2353
(2011). http://dx.doi.org/10.1364/BOE.2.002348 BOEICL 2156-7085 Google Scholar
P. D. Kumavoret al.,
“Target detection and quantification using a hybrid hand-held diffusive optical tomography and photoacoustic tomography system,”
J. Biomed. Opt., 16
(4), 046010
(2011). http://dx.doi.org/10.1117/1.3563534 JBOPFO 1083-3668 Google Scholar
J. Gamelinet al.,
“Photoacoustic guidance of diffusive optical tomography with a hybrid reflection geometry probe,”
Proc. SPIE, 7177 717707
(2009). http://dx.doi.org/10.1117/12.813547 PSISDG 0277-786X Google Scholar
D. J. HawryszE. M. Sevick-Muraca,
“Developments toward diagnostic breast cancer imaging using near-infrared optical measurements and fluorescent contrast agents,”
Neoplasia, 2
(5), 388
–417
(2000). http://dx.doi.org/10.1038/sj.neo.7900118 1522-8002 Google Scholar
A. HellebustR. Richards-Kortum,
“Advances in molecular imaging: Targeted optical contrast agents for cancer diagnostics,”
Nanomedicine, 7
(3), 429
–445
(2012). http://dx.doi.org/10.2217/nnm.12.12 1743-5889 Google Scholar
A. Poellinger,
“Near-infrared imaging of breast cancer using optical contrast agents,”
J. Biophoton., 5
(11–12), 815
–826
(2012). http://dx.doi.org/10.1002/jbio.201200123 Google Scholar
V. Ntziachristoset al.,
“Concurrent MRI and diffuse optical tomography of breast after indocyanine green enhancement,”
Proc. Natl. Acad. Sci. U. S. A., 97
(6), 2767
–2772
(2000). http://dx.doi.org/10.1073/pnas.040570597 PNASA6 0027-8424 Google Scholar
B. Alacamet al.,
“Pharmacokinetic-rate images of indocyanine green for breast tumors using near-infrared optical methods,”
Phys. Med. Biol., 53
(4), 837
–859
(2008). http://dx.doi.org/10.1088/0031-9155/53/4/002 PHMBA7 0031-9155 Google Scholar
A. Corluet al.,
“Three-dimensional in vivo fluorescence diffuse optical tomography of breast cancer in humans,”
Opt. Express, 15
(11), 6696
–6716
(2007). http://dx.doi.org/10.1364/OE.15.006696 OPEXFF 1094-4087 Google Scholar
X. Inteset al.,
“In vivo continuous-wave optical breast imaging enhanced with Indocyanine Green,”
Med. Phys., 30
(6), 1039
–1047
(2003). http://dx.doi.org/10.1118/1.1573791 MPHYA6 0094-2405 Google Scholar
D. GrosenickH. WabnitzB. Ebert,
“Review: recent advances in contrast-enhanced near infrared diffuse optical imaging of diseases using indocyanine green,”
J. Near Infrared Spectrosc., 20
(1), 203
–221
(2012). http://dx.doi.org/10.1255/jnirs.964 JNISEI 0967-0335 Google Scholar
T. Alanderet al.,
“A review of indocyanine green fluorescent imaging in surgery,”
Int. J. Biomed. Imaging, 2012
(1), 940585
(2012). http://dx.doi.org/10.1155/2012/940585 IJBIBD 1687-4188 Google Scholar
U. Alqasemiet al.,
“FPGA-based reconfigurable processor for ultrafast interlaced ultrasound and photoacoustic imaging,”
IEEE Trans. Ultrason. Ferroelectr. Freq. Control, 59
(7), 1344
–1353
(2012). http://dx.doi.org/10.1109/TUFFC.2012.2335 ITUCER 0885-3010 Google Scholar
U. Alqasemiet al.,
“Real-time interlaced ultrasound and photoacoustic system for in vivo ovarian cancer imaging,”
Proc. SPIE, 8581 85814S
(2013). http://dx.doi.org/10.1117/12.2008273 PSISDG 0277-786X Google Scholar
Q. Zhuet al.,
“Optimal probing of optical contrast of breast lesions of different size located at different depths by US localization,”
Technol. Cancer Res. Treat., 5
(4), 365
–380
(2006). TCRTBS 1533-0346 Google Scholar
Q. ZhuN. ChenS. Kurtzman,
“Imaging tumor angiogenesis using combined near infrared diffusive light and ultrasound,”
Opt. Lett., 28
(5), 337
–339
(2003). http://dx.doi.org/10.1364/OL.28.000337 OPLEDP 0146-9592 Google Scholar
S. Prahl,
“Optical absorption of indocyanine green (ICG),”
http://omlc.ogi.edu/spectra/icg/ Google Scholar
M. Landsmanet al.,
“Light-absorbing properties, stability, and spectral stabilization of indocyanine green,”
J. Appl. Physiol., 40
(4), 575
–583
(1976). JAPYAA 0021-8987 Google Scholar
B. YuanN. ChenQ. Zhu,
“Emission and absorption properties of indocyanine green in intralipid solution,”
J. Biomed. Opt., 9
(3), 497
–503
(2004). http://dx.doi.org/10.1117/1.1695411 JBOPFO 1083-3668 Google Scholar
C. Pavliket al.,
“Synthesis and fluorescent characteristics of imidazole-indocyanine green conjugates,”
Dyes Pigm., 89
(1), 9
–15
(2011). http://dx.doi.org/10.1016/j.dyepig.2010.08.008 DYPIDX 0143-7208 Google Scholar
Y. Xuet al.,
“Targeting tumor hypoxia with 2-nitroimidazole-ICG dye conjugates,”
J. Biomed. Opt., 18
(6), 066009
(2013). http://dx.doi.org/10.1117/1.JBO.18.6.066009 JBOPFO 1083-3668 Google Scholar
B. E. Harvey,
“NDA 18-449/S-039, INTRALIPID 20%—Accessdata FDA,”
(2007). http://www.accessdata.fda.gov/drugsatfda_docs/appletter/2007/018449s039,017643s072ltr.pdf Google Scholar
L. V. WangH. Wu, Biomedical Optics: Principles and Imaging, Wiley, Hoboken, NJ
(2007). Google Scholar
P. Kumavoret al.,
“Co-registered pulse-echo/photoacoustic transvaginal probe for real time imaging of ovarian tissue,”
J. Biophoton., 6
(6–7), 475
–484
(2013). http://dx.doi.org/10.1002/jbio.201200163 Google Scholar
B. TavakoliY. XuQ. Zhu,
“Ovarian tissue characterization using bulk optical properties,”
Proc. SPIE, 8578 85781F
(2013). http://dx.doi.org/10.1117/12.2008217 PSISDG 0277-786X Google Scholar
|