
|
|
1.IntroductionStandards committees are currently pursuing revisions of laser safety exposure limits to the eye. Some of these revisions are focused on the near-infrared region and are based primarily upon new data collected within the wavelength region of 1100 to 1400 nm.1 Near the wavelength of 1300 nm, these exposure limits are anticipated to be increased by the largest margin relative to the values established in the year 2000. This increased exposure limit has been justified through multiple theoretical and experimental studies, which have examined the trends of threshold for damage and the mechanisms involved. However, data collected to date have emphasized the response of the eye, with very little attention to the skin. Laser-damage thresholds of the skin are considered to be much greater than those of the eye in the retinal hazard region of 400 to 1400 nm. This may not be true in some regions of the spectrum where the absorption length within the eye is on the order of a centimeter, and the laser (while focused at the retina) has a transmittance to the retina resulting in an irradiance level (when considering the beam diameter at and energy transmitted to the retina) that can be similar to the levels at the cornea. This yields a spectral region of some of the highest measured thresholds for laser damage to tissues.2,3 As a skin exposure includes tissues with much larger scattering coefficients along with pigmentation absorption, it is hypothesized that the damage threshold may be lower within the skin than within the cornea and retina at a wavelength near 1319 nm, a commonly used Nd:YAG emission line. This study will help address this hypothesis and ensure that the use of new systems have appropriately validated exposure limits, based upon experimentally observed damage and theoretically predicted mechanisms. In previous skin studies,4–7 the results of experiments and tests on Yucatan miniature pigs were presented for a 2000-nm thulium fiber laser for various exposure durations and incident beam diameters. Some damage threshold studies have been completed at 1315 nm for pulses in the microsecond regime, as reported by Cain et al.8 A preliminary skin damage threshold study at 1214 and 1319 nm has also been documented.9–11 The Yucatan miniature pig has been established as a model for human skin damage studies due to the morphological and physiological similarities to human skin.12 This study at 1319 nm, as compared to 2000 nm, allows for conditions where damage can be produced at a more optically penetrating wavelength, but again with relatively large beam diameters and exposure durations up to 10 s. The use of large laser-beam diameters results in a measured threshold under conditions near the theoretical one-dimensional limit of heat transfer in the skin, where radial heat losses from the center of the beam-tissue interface are negligible with respect to losses due to axial heat transfer. Thresholds obtained under these conditions should therefore approach the lowest possible radiant exposure () requirement for thermal damage. An accurate prediction of the distribution of laser energy within the skin relies on an accurate characterization of the absorption and scattering properties of the tissue or its constituents. Several recent studies13,14 have measured optical properties of the skin and subcutaneous tissues in the near-infrared with sufficient rigor to use in simulation of light transport and predict subsequent damage. Thermally induced damage to laser-irradiated skin depends on the time-temperature response of tissues. This begins with the local absorption of the laser energy, which heats the tissue. The tissue may be affected by this heating through denaturation of cellular proteins, leading to a subsequent apoptosis or overt necrosis. At higher temperatures, thermal coagulation, collagen hyalinization, and changes in optical properties, such as increased scattering or birefringence, may be observed.15–17 Several authors have contributed to numerical simulations of optical-thermal response of tissues and models of the damage process. These are largely built on the original works of Mainster18 and Takata,19,20 with many authors contributing through the addition of increased fidelity.21–24 Models that represent the skin as a two- or three-layer construct, with a Beer’s law absorption term for the laser energy deposition, have been shown to accurately predict the optical-thermal response of the tissue.5,19,25 Thermal diffusion solutions are most often computed through finite element or finite difference methods. Increased accuracy has been demonstrated when temperature-dependent surface cooling associated with the evaporation of water is included.26 In the comprehensive analysis of Chen et al.,6 thermal damage was shown to most accurately mimic histology for an Arrhenius model when based upon the parameters presented by Gaylor.27 Chen et al. reported that the extent of damage reached a depth of 200 to 300 microns at the observed minimal visible lesion threshold. When the criterion of damage at this depth is applied to modeling, the predicted damage thresholds accurately follow the minimally visible lesion endpoint thresholds. The study of thermal injury under an expanded range of exposure parameters allows for the formulation of broadly applicable trends from which exposure limits can be defined. In addition, the regions in which experiments diverge from theory may establish transition regions for mechanisms of damage. From this supposition, one can derive corresponding trends in empirical descriptions for exposure limits for the skin as well as the eye, provided similar data are available from ex vivo studies, for example, damage to the retina.28 2.Methods2.1.ExperimentThe animal use protocols for this research were approved by the Institutional Animal Care and Use Committee at Brooks City-Base, Texas. Animals involved in this study were procured, maintained, and used in accordance with the United States Department of Agriculture Animal Welfare Act and Animal Welfare Regulations, and the National Research Council Guide for the Care and Use of Laboratory Animals. A total of 12 flanks from eight female Yucatan miniature pigs (30 to 50 kg) were exposed and examined. Animals were prepared and monitored for this study as previously reported.7 Animals were returned to the general pool for protocol sharing at the completion of participation in the study. The laser used for this study was a Lee Laser Model 8250 M, configured with resonator optics selected to optimize output from the 1319 nm, Nd:YAG laser line. Total unpolarized laser power output from the resonator was with an value of . The laser beam was introduced into a polarizing cube, producing a linearly polarized output beam, which could then be attenuated with a wave-plate polarization analyzer to control total power to target. Beam-shaping telescopes (BST) were used to propagate the laser output with the desired magnification at the target plane. Figure 1 is a depiction of the beam delivery and imaging diagnostic system. The laser is injected into the system through the first BST. The power control scheme, including details of the shutter used prior to this injection point, is reported elsewhere.11 Fig. 1Experimental setup. M, mirror; BS, beam splitter; BST, beam shaping telescope; IR, infrared camera; VC, video camera; A, aperture; PM10, reference arm detector. 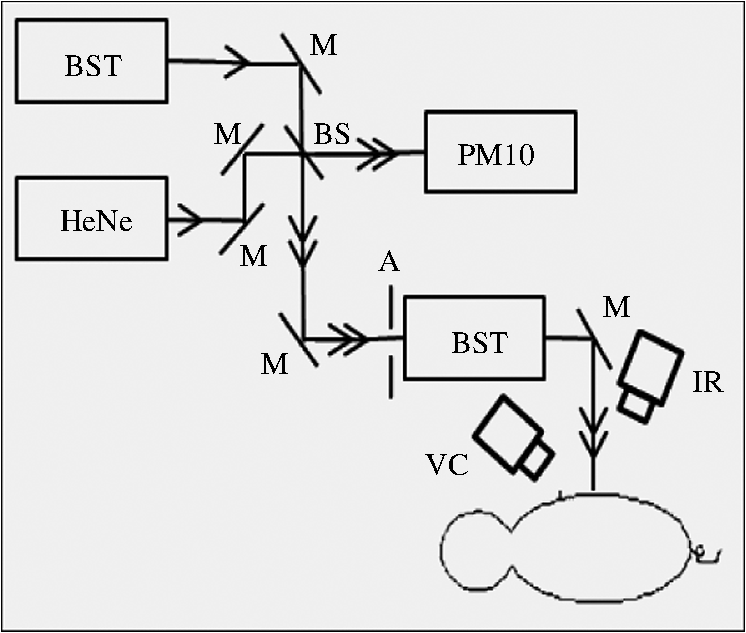 The size of the beam at the target plane was characterized to have a Gaussian irradiance distribution. A detailed analysis of the beam profile for this study has been presented previously.11 The laser was characterized with an Electrophysics MicronViewer 7290 A, IR Camera (Electrophysics, Fairfield, NJ), and Pyrocam beam analysis software (Spiricon, Logan, UT) beam profiler. The beam diameters () were measured to be and on average by repeated measure at the target plane prior to exposure. For each laser exposure, reference energy from a sample of the beam was recorded with a PM10 power detector (Coherent Inc., Santa Clara, CA). Measurements acquired with the PM10 in the reference beam were characterized against measurements obtained with a PM150 detector (Coherent Inc.) placed near the target plane before testing, at the scheduled midway time point during testing, and after each sequence of exposures to assure the integrity of the high-energy beam train. This technique also confirmed the accurate quantification of energy delivered to the target. A coaligned HeNe laser beam was used to facilitate targeting of the high-power beam. A color video camera model DXC-107A (Sony, San Diego, CA) was utilized for target position verification. It was mounted with an SC400 thermal camera (FLIR Systems, Boston, MA) and used to monitor the thermal profile on the skin’s surface at the exposure site as previously described.7 The thermal camera was synchronized with the control electronics for the laser to trigger data collection beginning at prior to laser exposure of the skin. The camera was programmed to collect data for a period of time between 6 and 30 s beyond the completion of each laser exposure to capture the trajectory of thermal decay of the laser-heated tissue. Fine adjustments in IR camera focus were made prior to each laser exposure using an National Television Standards Committee display of the thermal image of emissivity contrast sources originating from inhomogeneities in skin structures such as wrinkles or hair follicles. Anesthetized pigs were placed in a customized pig sling (BH Inc., Wheatland, WY), which was mounted on rails and motorized for rapid and repeatable horizontal position adjustment of the test subjects. A hand crank on the sling was used to adjust the vertical position of the subject prior to each laser exposure. In this manner, each area of the grid that had been drawn on the flank of the pig was sequentially addressed with a laser exposure according to a predetermined randomized selection of energy levels distributed over a range encompassing the anticipated threshold level. Energy for each laser exposure and any remarkable observations were recorded immediately following each exposure. The Probit procedure29 was used to estimate the dose for creating a minimal visual lesion (MVL) for each laser configuration used in the skin studies (i.e., ). Each exposure site was assessed as positive or negative for damage by three experienced observers, with at least two of three in agreement to confirm a positive reading. Observers were instructed that a lesion was constituted as any change in the appearance of the surface of the skin to include any erythema, no matter how slight, blistering, or change in pigmentation as viewed by the eye. A minimum of three animals were used for each laser configuration investigated. In addition, 95% confidence intervals were calculated from the data. An adequate number of data points were collected to ensure that the magnitude of upper and lower fiducial limits at the level varied no more than 50%. Furthermore, a Probit-curve slope greater than two, with aggregated 24-h observation data, was set as a minimal experimental ending point for the study of a specific exposure condition. Here, the slope reported represents the first derivative (probability per dose) of the dose-response curve at the point generated from the Probit analysis method. 2.2.ModelsA numerical model was developed to simulate laser energy deposition, heat transfer, and a prediction of the tissue damage threshold. The details of this model have been previously reported.30 To simulate the experimental data presented here, the model is essentially a two-dimensional (cylindrical coordinate), finite difference solution to the Pennes Bio-Heat equation, given by Eq. (1). In Eq. (1), is the local temperature rise at coordinates , is the thermal conductivity, is the local tissue volumetric density, is the specific heat, is the power density loss or gain due to blood flow, and is the time. The source term, , is configured as a Gaussian lateral distribution and assumes an energy deposition rate proportional to the local irradiance, as shown in Eq. (2). Here, is the local linear absorption coefficient in the tissue, is the wavelength, and is the irradiance in the tissue. A Monte Carlo model was used to determine the source term.30,31 The model includes representations of surface boundary conditions mimicking the loss of energy to the surrounding environment.26 The resultant time dependence of temperature is evaluated with an Arrhenius damage model.23 A damage threshold was determined by searching for a laser power that produced a prescribed value damage integral at 250 μm depth in the tissue structure, corresponding to prior assessments of histology for visually observed damage endpoints.6 The Arrhenius damage integral is given by Eq. (3), in which is the universal gas constant, is the normalization rate constant (molecular collision frequency factor), and is the activation energy. The value is computed at each coordinate in the model based upon the temperature history for that coordinate. A value of is assumed to represent the threshold for damage. Physical constants and other values for Eqs. (1) through (3) are provided in Table 1. Table 1The physical constants for the mathematical model.
The tissue geometry was represented within the model as a three-layer structure consisting of epidermis, dermis, and fat tissue, each having homogeneous properties. Thermal conductivity for the fat layer was obtained from recent measurements reported by El-Brawnany et al.34 Thermal and optical properties of the skin layers were obtained from various sources as reported in Table 1. The model was run for laser exposure times between 250 ms and 10 s for beam diameters of 0.61 and 0.97 cm. Simulation time included the cool-down phase after the pulse, sufficient to reach less than of the peak temperature achieved (one decay time constant). The damage was determined to occur when one voxel located 200 μm behind the surface was within 2% of the damage integral being 1. The smallest voxel was th of the beam diameter. 3.ResultsLesions in this study were typically seen as a persistent, symmetrical erythema at the exposure site. Lesions resulting from exposures at or near the generally appeared as a small pink spot in diameter at the 24-h observational endpoint, regardless of exposure duration or laser-beam diameter. Damage threshold data for the 1- and 24-h observational time points are reported in Tables 2 and 3, respectively. Beam diameters reported are at amplitude within the Gaussian distribution. The irradiance and radiant exposures were calculated by the peak values within the beams and not the average values. Peak irradiance values are most convenient to compare directly with exposure limits. In some cases, the number of exposures at 24 h is less than the number of exposures at 1 h due to the fact that some 1-h exposure sites were taken for histopathology. Results from the histopathology are reserved for a future publication. Table 2Probit data results from observations for lesions 1 h after exposure.
Table 3Probit data results from observations for lesions 24 h after exposure.
The ANSI Z.136.1-2007 Standard for the Safe Use of Lasers recommends that for a skin exposure, the limiting aperture should be referenced to a standard 0.35 cm.37 Thus, to compare the experimentally determined ’s from Table 3, to the maximum permissible exposure (MPE), the irradiance values were scaled to an effective irradiance, , by where is the power in Watts (24-h data), is the measured laser beams diameter in cm, and is the limiting aperture of 0.35 cm. The contrast between for each tested beam diameter and the MPE are presented in Fig. 2(a), while the irradiance versus beam diameter are shown in Fig. 2(b). Excel (Microsoft Office 2007) was used to determine the equation to best fit the data for versus , using the for each beam diameter from Fig. 2(a), finding for the 0.61-cm data and for the 0.97-cm data.Fig. 2The 24-h ’s represented as the (a) effective irradiance versus time compared to the ANSI Z.136.1-2007 maximum permissible exposure for 1319-nm exposure to skin and (b) peak irradiance versus diameter.  Infrared camera data were processed by selecting a region of interest (ROI) (typically 20-pixel diameter, which correlated to a 0.26-cm diameter ROI) within the central area of exposure to examine the maximum temperature in the ROI at each time, , during the laser exposure (, 1, 2.5, or 10 s) and after the laser was turned off (, 1, 2.5, or 10 s). The initial temperature, , of the exposed skin surface was determined from IR camera data acquired before the laser turned on (). Exposures that yielded a positive lesion read at 24 h and were closest to the 24-h were selected for time-temperature history (Fig. 3). Fig. 3Time-temperature response from selected 1319-nm laser radiation exposures nearest to the 24-h for each tested beam diameter at the (a) 250-ms, (b) 1-s, (c) 2.5-s, and (d) 10-s exposure durations. 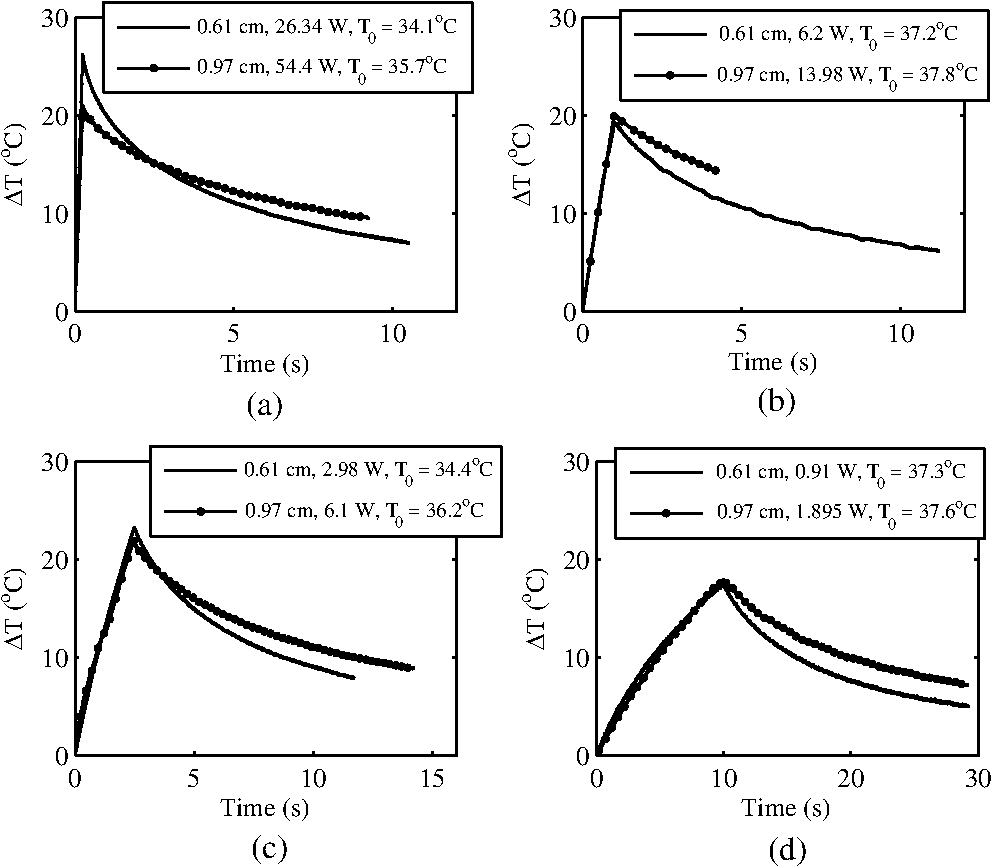 IR camera data were processed to determine the peak temperature at the end of the laser exposure to give the linear relationships for the peak temperature rise, , as a function of power, , in Fig. 4. IR camera data that were saturated were excluded from presentation in Fig. 4. Fig. 4The peak temperature rise from numerous exposure powers for the (a) 0.61 cm and (b) 0.97 cm beam diameters at all tested exposure durations. Solid lines represent the linear fits to data.  Linear fits to the data in Fig. 4 were made using a forced zero intercept. The slopes for these fits (Table 4) were used to calculate the associated with the 1- and 24-h ’s. The mathematical model was run to compute the temperature rise at the end of a 1-W exposure to compare against the experimentally fitted slopes. The model was run for all possible combinations of the percentage of optical property coefficient errors (Table 1) to give the percentage of uncertainty associated with the modeled slope values reported in Table 4. Table 4The linear slopes from the fitted data in Fig. 4 and calculated ΔT at 1-h and 24-h ED50’s. The experimental slope and R2 values are from the linear fits to thermal camera data.
Modeling results assumed a 36°C surface temperature and used constants reported in Table 1 for comparing to the experimentally determined ’s at 0.25, 1, 2.5, and 10 s in addition to a 30-s exposure duration. Results for the 0.61- and 0.97-cm beam diameters at all exposure durations were converted to using Eq. (4) and are shown in Figs. 5 and 6, respectively. Error bars associated with the model were determined by running the model at the maxima and minima of the optical coefficients ( and ) in Table 1. The initial surface temperature, , of all subjects’ skin ranged from to 39°C (average was 36.6°C and standard deviation 2.0°C). The ambient temperature, , during all experiments ranged from to 28°C (average was 25.8°C and standard deviation 2.2°C). A case of contrasting initial conditions that was selected from the 0.61-cm, 1-s data series is presented in Fig. 7, with corresponding details on initial temperatures, , from the skin’s surface (acquired from the IR camera data prior to exposure), ambient temperature, , and core temperature, , from rectal thermometer reported in Table 5. Fig. 7Time-temperature for contrasting initial conditions between subjects A (sample numbers 1 to 3), B (sample numbers 1 and 2), and C (sample numbers 1 and 2) for a 1-s exposure using the 0.61-cm beam diameter. 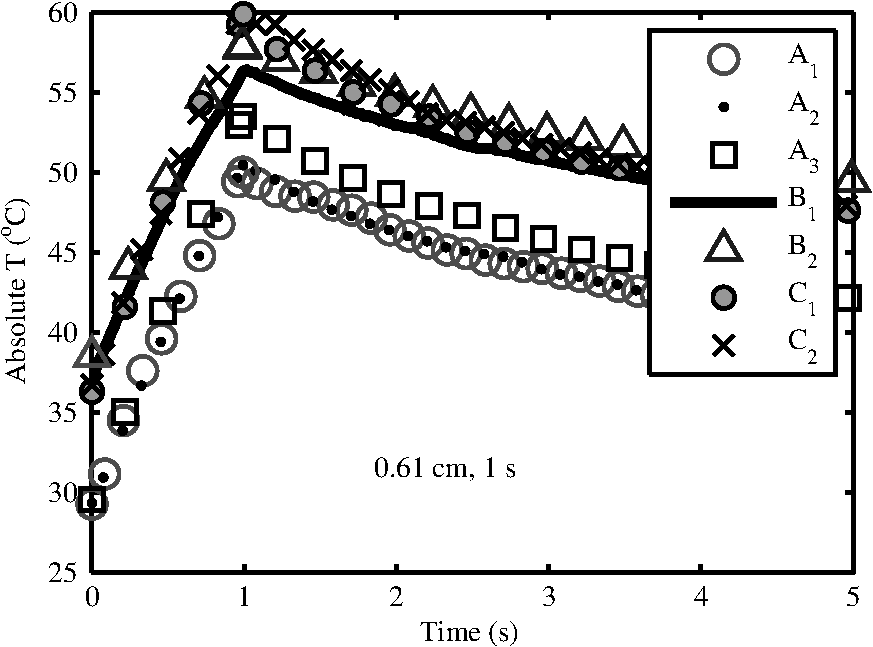 Table 5Detailed conditions for the time-temperature data presented in Fig. 7.
Subject A had the lowest initial temperature observed during any procedure in this study. The initial surface temperature of the skin is influenced by anesthesia, the subject’s natural thermoregulation, and ambient conditions, all of which contribute to the large variance in . 4.DiscussionThe difference in the 1- and 24-h ’s appears, for the most part, unremarkable and has overlapping confidence intervals (Tables 2 and 3). The 0.97-cm, 1, 2.5, and 10-s exposures had a 24-h between 7 and 12% higher than the 1-h without overlapping confidence intervals. These exposures also had the largest number of lesions migrating from a positive to negative read from the 1- and 24-h data, respectively. Future histological analysis may help to explain these differences. The primary goal of this study was to assess the 1319-nm laser radiation damage threshold to skin and compare data to the MPE outlined in ANSI Z136.1-2007. To do this, the 24-h ’s irradiance values (Table 3) were scaled to an effective irradiance, , using Eq. (4). The ratio of to MPE ranges from 5.0, for the 10-s exposures, to 9.3, for the 0.25-s exposures as shown in Fig. 2(a). Fitting the data in Fig. 2(a) to a power curve revealed that the relationship between the and exposure time followed a trend of approximately for both beam diameters, which is slightly steeper than the general relationship suggested in the ANSI standard of . The fits to the experimental data in Fig. 2(a) estimate 30-s threshold peak irradiances of 2.2 and ( would be 1.7 and ) for the 0.61- and 0.97-cm beams, respectively. The fit to the experimental trend from the damage thresholds suggest that the MPE would be exceeded for exposures lasting more than . Figure 2(b) shows that the 0.97-cm beam diameter had , , and threshold irradiance values relative to the 0.61-cm beam for the 0.25, 1, 2.5, and 10-s exposures, respectively. This reduction is due to the extended time required for cooling the center of the exposed tissue with the larger beam [see Fig. 3(d), for example]. This extended cooling time for equivalent surface temperatures, even with large beam diameters (about the 0.35-cm limiting aperture assumed in the safety standards), is a result of the relatively deep penetration of the 1319-nm wavelength (as compared to a much less penetrating wavelength like 2000 nm, for example). Deep light penetration results in the generation of heat throughout the layers of tissue just behind the skin surface, effectively limiting conductive heat loss near the surface to radial conduction (perpendicular to the beam). The relative trend of decreased irradiance requirements for longer exposure durations (12 versus 18%) with the larger diameter beam suggests that no significant protection is afforded by increased blood flow for laser exposures up to 10 s in duration. Computational model results help to understand the implications of experimental data for large beam diameters and long exposures. Welch and van Gemert17 have advised that the rate coefficients from Diller35,36 be used as opposed to Henriques;38 thus the model was run for both rate coefficients. The values from Henriques were found to give slightly closer damage estimates to the experiment for the smaller, 0.61 cm, diameter beam, but values from Diller gave better damage estimates for the larger, 0.97 cm, diameter beam. All modeling results reported in this study for contrasting to experimental data or MPE used rate coefficients from Diller. The model shows good agreement with the experimentally determined ’s for both the 0.61- and 0.97-cm beam diameters as shown in Figs. 5 and 6, respectively. Experimental and modeling data demonstrate that the damage threshold is more dependent on beam diameter at longer exposure durations than at short durations. The model predicts that the larger beam diameter would have a , , , and threshold irradiance values relative to the smaller beam for the 0.25-, 1-, 2.5-, and 10-s exposures, respectively. The model suggests that larger-diameter beams have lower irradiance threshold requirements even at very long exposure durations compared to a smaller beam. While it is unlikely that an accidental exposure to a laser would last , it is possible a therapeutic or diagnostic use of lasers in the 1319-nm wavelength region could exist for very long exposures. Therefore, longer duration exposures were explored with the computational model. The model predicts the threshold peak irradiances for a 30-s exposure to be 2.6 and ( would be 2.2 and ) for the smaller and larger beams, respectively, very close to the values found from fits to experimental data. Likewise, the model was used to estimate how large a beam would be needed to be in order to achieve a temperature rise that would be essentially independent of beam diameter, (i.e., where begins to approach a steady state, data not shown). Accordingly, two cases were examined for a series of 1319-nm beam diameters, one for a 30-s exposure with a fixed peak irradiance and the second for a 10-s exposure with a fixed peak irradiance. It was found that begins to stabilize (loosely taken as being stable when the value was ) when the beam diameter exceeds and 1.6 cm ( diameters) for the 30- and 10-s cases, respectively. As indicated in Table 1, constant blood flow was assumed in the dermis and fat layers for all calculations. Variations of this parameter were not explored. Xu et al.39 have reported a model that investigated the impact of blood flow in the dermis on damage to skin for a 15-s thermal insult. These results indicated that variations in blood flow only had a large impact on the thermal relaxation time (not the rate of heating) for the surface of the skin and only at perfusion rates that were substantially higher than those assumed in the model for this study. The relaxation times reported for “no perfusion” conditions modeled by Xu et al. most closely matched the long relaxation times measured with the IR camera in this study (as evident in Fig. 3). Long relaxation times were observed for all exposure conditions, suggesting that blood perfusion is not a significant sync of heat over the parameter space tested. Analysis of thermal camera data revealed a linear relationship between the input power and peak temperature increase on the skin’s surface (Fig. 4 and Table 4). These data provide experimental evidence to compare to mathematical modeling without having to run the damage integral. The model underestimates the temperature rise on the skin’s surface for all the 0.61-cm beam diameter data, though the experimental data fall within the uncertainty in the model. However, the model overestimates the temperature rise, , on the skin’s surface for all the 0.97-cm beam diameter data , while underestimating for the 10-s case. Only one experimental slope, 0.97 cm, 2.5 s, fell outside the range of uncertainty surrounding the modeled slope. This experimental slope also had the lowest value of all analyzed IR camera data. Experimental errors in the slope stem from calibration, dynamic range, and placements of the exposure area at the focus of the IR camera. Uncertainties regarding the mathematical model are largely associated with the absorption coefficients ( in epidermis, dermis, and fat tissue), scattering coefficients ( in epidermis, dermis, and fat), along with the assumed anisotropy factor, . The value of in several other23,40 laser-tissue exposures to skin has been assumed to be , but this study used the value from Salomatina et al.14 to be consistent with their reported and values. Analysis of the time-temperature history for selected exposures nearest the 24-h from IR camera data indicates that a peak temperature (maximum temperature at the end of laser exposure) for the 0.61- and 0.97-cm diameters at 0.25-, 1-, 2.5-, and 10-s exposure durations were 60.2 to 56.6°C, 56.4 to 57.8°C, 57.6 to 58.2°C, and 54.7 to 55.5°C, respectively (Fig. 3). All data shown in Fig. 3 were positive for a lesion at 1 h except for the 0.97-cm, 0.25-s exposure. All were positive for a lesion at 24 h postexposure. Analysis of the IR camera data for the peak for a wide range of exposure powers (Fig. 4) determined the experimental linear relationship between and power at each exposure duration (slopes reported in Table 4). These slopes were then used to calculate the peak associated with the 24-h threshold power (Table 3), which ranged from 18.2°C (for 10 s, 0.97 cm) to 25.1°C (for 0.25 s, 0.61 cm). If the average of 36.6°C from all subjects is assumed, then this gives an absolute temperature range of 54.8 to 61.7°C for the damage thresholds for the 10- and 0.25-s exposures, respectively. Recent work by Jean et al.41 reported a model for laser damage in skin, which was made to follow a trend in damaging temperatures from 10-, 1-, and 0.1-s laser exposures to have absolute threshold temperatures of , 58, and 62°C, respectively, a very similar trend with respect to in this study’s experimental data. The experimental uncertainty and variations in the thermal data and the relatively small spread between for the 0.25- to 10-s exposures indicate that a general average peak temperature is a reasonable estimate for over this range of exposures. The average and standard deviation for was estimated to be from all subjects; associated with threshold damage was calculated for each exposure condition using data in Table 4, resulting in an average change of temperature and standard deviation of . Combining the average starting temperature with the average increase associated with threshold levels of damage () gives a general average and standard deviation of encompassing all exposures conditions in this study. This temperature is associated with the MVL, lesions in this study that were noted to be a symmetrical pink erythema, in diameter at 24 h postexposure, regardless of exposure duration or laser-beam diameter. This suggests that the MVL was typically observed for exposures having a of . This critical temperature for damage is further evident by examination of an experimental condition where the initial temperature on the surface of the skin was significantly lower than the other subjects (Fig. 7). Subject A (Fig. 7 and Table 5) was used for the 0.61-cm, 1-s exposures on an occasion where the ambient temperature, , was sufficiently cooler than all other cases throughout the duration of the study. Logistical problems prevented stable regulation of , owing to the hotter and highly variable ambient conditions. The initial temperature, , of the skin’s surface is influenced by not only , but also anesthesia, and the subject’s ability for thermoregulation. This unplanned variability in may lend experimental in vivo evidence toward the requirement to achieve an absolute temperature, and not just a , to reach damage. This observation is consistent with the findings by Denton et al.42 in cultured retinal pigment epithelial cells. Denton et al. reported that a marginal temperature for cell death of was required over a range of laser exposure durations from 0.1 to 1 s. This is not to suggest that the in vivo temperature threshold should be 53°C, but rather that threshold damage can be experimentally linked to a peak temperature. A threshold temperature for damage in vivo may be tissue, cell-type, or even lipoprotein specific with some cell types being more robust than others based upon multiple factors such as preconditioning, immunological preference, and anatomical location. The experimentally determined 24-h for the 0.61-cm, 1-s exposure condition was 6.22 W (95% confidence intervals of 6.00 and 6.45 W) and had a damage threshold of 19.2°C (Table 4). The highest power resulting in no lesion was observed in subject A (Fig. 7 and Table 5), which was 6.54 W, sufficiently above the 95% confidence interval of 6.45 W. With a of 29.3°C, the for this 6.54-W exposure was 24.2°C, suggesting that this exposure is sufficiently above the average damage threshold of 19.2°C (Table 4) to achieve damage, yet no lesion was observed at 1or 24 h by any of the three observers. Probit analysis of subject A’s lesion data from the 0.61-cm, 1-s exposures suggested an individual damage threshold of 7.13 W (Table 5), the highest individual threshold of the three tested subjects using this diameter and exposure setting. It should be noted that subject A was used for other experimental conditions including beam diameter, exposure settings of 0.61 cm, 10 s, and 0.97 cm, 1 s, which had ’s of 34.3 and 35.8°C, respectively, but resulted in individual ’s very near the other subject data tested at those configurations. Thus, the authors believe the very low on that particular cooler, ambient condition protected the skin from laser exposures, requiring higher powers relative to other tested subjects, to achieve damage. Future modeling efforts should examine variations in blood flow in addition to optical coefficients , , and to examine how these values shape the trend in damage thresholds for larger beam diameters and longer exposures at this wavelength. Infrared camera analysis allows for determination of the experimental thermal slope (), which can be used to aid in understanding the rates of thermal response from various exposure durations and beam diameters. This analysis affords the unique ability to decouple the computational model from the damage model. Thermographic analyses of data in this study provide evidence for the importance of the experimental initial condition in achieving a damage end point. Cooling the skin’s surface is a long known practice in laser applications for skin treatment when deeper layers in the skin are the targeted damage area, such as in the treatment of port wine stains.43 Here, evidence has been presented that the MVL damage threshold is influenced by the initial and ambient conditions. It is recommended that skin damage threshold studies, where thermal damage is expected to dominate, practice due diligence by monitoring and reporting the initial temperature of the skin’s surface in addition to the ambient conditions. AcknowledgmentsThe authors would like to thank the staff of the Air Force Research Laboratory Veterinary Sciences Branch (711 HPW/RHDV) for their expert animal care and handling service. Research performed by TASC, Inc. was conducted under USAF Contract Numbers F41624-02-D-7003 and FA8650-08-D-6930. Opinions expressed here are those of the authors and do not constitute those of the United States Air Force or Department of Defense. ReferencesJ. A. ZuclichD. J. LundB. E. Stuck,
“Wavelength dependence of ocular damage thresholds in the near-IR to far-IR transition region: proposed revisions to MPES,”
Health Phys., 92
(1), 15
–23
(2007). http://dx.doi.org/10.1097/01.HP.0000232188.69779.69 HLTPAO 0017-9078 Google Scholar
B. A. Rockwellet al.,
“Limiting mechanism for NIR laser retinal damage,”
Proc. SPIE, 7175 71750J
(2009). http://dx.doi.org/10.1117/12.807710 PSISDG 0277-786X Google Scholar
R. L. Vinceletteet al.,
“Trends in retinal damage thresholds from 100-millisecond near-infrared laser radiation exposures: a study at 1,110, 1,130, 1,150, and 1,319 nm,”
Lasers Surg. Med., 41
(5), 382
–390
(2009). http://dx.doi.org/10.1002/(ISSN)1096-9101 LSMEDI 0196-8092 Google Scholar
B. Chenet al.,
“Porcine skin ED50 damage thresholds for 2,000 nm laser irradiation,”
Lasers Surg. Med., 37
(5), 373
–381
(2005). http://dx.doi.org/10.1002/(ISSN)1096-9101 LSMEDI 0196-8092 Google Scholar
B. Chenet al.,
“Modeling thermal damage in skin from 2000-nm laser irradiation,”
J. Biomed. Opt., 11
(6), 064028
(2006). http://dx.doi.org/10.1117/1.2402114 JBOPFO 1083-3668 Google Scholar
B. Chenet al.,
“Histological and modeling study of skin thermal injury to 2.0 microm laser irradiation,”
Lasers Surg. Med., 40
(5), 358
–370
(2008). http://dx.doi.org/10.1002/(ISSN)1096-9101 LSMEDI 0196-8092 Google Scholar
J. W. Oliveret al.,
“Infrared skin damage thresholds from 1940-nm continuous-wave laser exposures,”
J. Biomed. Opt., 15
(6), 065008
(2010). http://dx.doi.org/10.1117/1.3523622 JBOPFO 1083-3668 Google Scholar
C. P. Cainet al.,
“Porcine skin visible lesion thresholds for near-infrared lasers including modeling at two pulse durations and spot sizes,”
J. Biomed. Opt., 11
(4), 041109
(2006). http://dx.doi.org/10.1117/1.2338815 JBOPFO 1083-3668 Google Scholar
B. Chen,
“Experimental and modeling study of thermal response of skin and cornea to infrared wavelengths laser irradiation,”
University of Texas,
(2007). Google Scholar
B. Chenet al.,
“Porcine skin ED50 damage thresholds for 1214 nm laser irradiation,”
Proc. SPIE, 6854 685406
(2008). http://dx.doi.org/10.1117/12.761380 PSISDG 0277-786X Google Scholar
J. W. Oliveret al.,
“Skin damage thresholds with continuous-wave laser exposures at the infrared wavelength of 1319 nm,”
Proc. SPIE, 7897 789711
(2011). http://dx.doi.org/10.1117/12.876342 PSISDG 0277-786X Google Scholar
T. A. Egglestonet al.,
“Comparison of two porcine (Sus scrofa domestica) skin models for in vivo near-infrared laser exposure,”
Comp. Med., 50
(4), 391
–397
(2000). Google Scholar
Y. Duet al.,
“Experimental study of optical properties of porcine skin dermis from 900 to 1500 nm,”
Proc. SPIE, 3917 184
–192
(2000). http://dx.doi.org/10.1117/12.382731 PSISDG 0277-786X Google Scholar
E. Salomatinaet al.,
“Optical properties of normal and cancerous human skin in the visible and near-infrared spectral range,”
J. Biomed. Opt., 11
(6), 064026
(2006). http://dx.doi.org/10.1117/1.2398928 JBOPFO 1083-3668 Google Scholar
M. H. Niemz, Laser Tissue Interactions, Fundamentals and Applications, Springer, New York
(2004). Google Scholar
J. M. Handley,
“Adverse events associated with nonablative cutaneous visible and infrared laser treatment,”
J. Am. Acad. Dermatol., 55
(3), 482
–489
(2006). http://dx.doi.org/10.1016/j.jaad.2006.03.029 JAADDB 0190-9622 Google Scholar
A. J. WelchM. J. C. van Gemert, Optical-Thermal Response of Laser-Irradiated Tissue, 2nd ed.Springer, New York
(2011). Google Scholar
M. A. Mainsteret al.,
“Transient thermal behavior in biological systems,”
Bull. Math. Biophys., 32
(3), 303
–314
(1970). http://dx.doi.org/10.1007/BF02476870 BMBIAO 0007-4985 Google Scholar
A. N. TakataL. ZaneveldW. Richter,
“Laser-induced thermal damage of skin,”
(1977). Google Scholar
A. N. Takata,
“Thermal model of laser-induced skin damage: computer operator’s manual,”
(1977). Google Scholar
R. BirngruberV. P. GabelF. Hillenkamp,
“Experimental studies of laser thermal retinal injury,”
Health Phys., 44
(5), 519
–531
(1983). http://dx.doi.org/10.1097/00004032-198305000-00006 HLTPAO 0017-9078 Google Scholar
R. A. Londonet al.,
“Laser-tissue interaction modeling with the LATIS computer program,”
103
–109
(1996). Google Scholar
A. J. WelchM. J. C. van Gemert, Optical-Thermal Response of Laser-Irradiated Tissue, Plenum Press, New York
(1995). Google Scholar
K. R. Diller,
“Modeling of bioheat transfer processes,”
Advances in Heat Transfer, 157
–347 Academic Press, Boston
(1992). Google Scholar
D. J. Maitlandet al.,
“Dynamic simulations of tissue welding,”
Proc. SPIE, 2671 234
–242
(1996). http://dx.doi.org/10.1117/12.240014 Google Scholar
J. H. Torreset al.,
“Experimental evaluation of mathematical models for predicting the thermal response of tissue to laser irradiation,”
Appl. Opt., 32
(4), 597
–606
(1993). http://dx.doi.org/10.1364/AO.32.000597 APOPAI 0003-6935 Google Scholar
D. C. Gaylor,
“Physical mechanisms of cellular injury in electrical trauma,”
Massachusetts Institute of Technology, Cambridge, MA
(1989). Google Scholar
M. L. Dentonet al.,
“Determination of threshold average temperature for cell death in an in vitro retinal model using thermography,”
Proc. SPIE, 7175 71750G
(2009). http://dx.doi.org/10.1117/12.807861 PSISDG 0277-786X Google Scholar
D. J. Finney, Probit Analysis, 3rd ed.Cambridge University Press, Cambridge, UK
(1971). Google Scholar
L. J. Irvinet al.,
“BTEC thermal model,”
Brooks City-Base, Texas
(2008). Google Scholar
L. WangS. L. JacquesL. Zheng,
“Monte Carlo modeling of photon transport in multi-layered tissues,”
Comput. Methods Programs Biomed., 47
(2), 131
–146
(1995). http://dx.doi.org/10.1016/0169-2607(95)01640-F CMPBEK 0169-2607 Google Scholar
D. A. TorviJ. D. Dale,
“A finite element model of skin subjected to flash fire,”
J. Biomech. Eng., 116
(3), 250
–255
(1994). http://dx.doi.org/10.1115/1.2895727 JBENDY 0148-0731 Google Scholar
F. C. HenriquesA. R. Mortiz,
“Studies of thermal injury. I. The conduction of heat to and through skin and the temperatures attained therein. A theoretical and an experimental investigation,”
Am. J. Pathol., 23
(4), 530
–549
(1947). AJPAA4 0002-9440 Google Scholar
M. A. El-Brawnanyet al.,
“Measurement of thermal and ultrasonic properties of some biological tissues,”
J. Med. Eng. Technol., 33
(3), 249
–256
(2009). http://dx.doi.org/10.1080/03091900802451265 JMTEDN 0309-1902 Google Scholar
K. R. DillerG. A. Klutke,
“Accuracy analysis of the Henriques model for predicting burn injury,”
Advances in Bioheat and Mass Transfer, 117
–123 American Society of Mechanical Engineers, New York
(1993). Google Scholar
K. R. DillerJ. ValvanoJ. A. Pearce,
“Bioheat transfer,”
CRC Handbook of Thermal Engineering, 4-114
–114-215 CRC Press, Boca Raton, FL
(1999). Google Scholar
ANSI Z136.1 American National Standard for Safe Use of Lasers, Laser Institute of America, Orlando, Florida
(2007). Google Scholar
F. C. Henriques,
“Studies of thermal injury; the predictability and the significance of thermally induced rate processes leading to irreversible epidermal injury,”
Arch. Pathol., 43
(5), 489
–502
(1947). Google Scholar
F. XuT. J. LuK. A. Seffen,
“Biothermomechanics of skin tissues,”
J. Mech. Phys. Solids, 56
(5), 1852
–1884
(2008). http://dx.doi.org/10.1016/j.jmps.2007.11.011 JMPSA8 0022-5096 Google Scholar
C. P. Cainet al.,
“Porcine skin thermal response to near-IR lasers using a fast infrared camera,”
Proc. SPIE, 5319 313
–324
(2004). http://dx.doi.org/10.1117/12.529356 Google Scholar
M. JeanK. SchulmeisterB. E. Stuck,
“Computer modeling of laser induced injury of the skin,”
in Int. Laser Safety Conf.,
366
–370
(2013). Google Scholar
M. L. Dentonet al.,
“Spatially correlated microthermography maps threshold temperature in laser-induced damage,”
J. Biomed. Opt., 16
(3), 036003
(2011). http://dx.doi.org/10.1117/1.3548881 JBOPFO 1083-3668 Google Scholar
T. J. Pfeferet al.,
“Bioheat transfer analysis of cryogen spray cooling during laser treatment of port wine stains,”
Lasers Surg. Med., 26
(2), 145
–157
(2000). http://dx.doi.org/10.1002/(ISSN)1096-9101 LSMEDI 0196-8092 Google Scholar
|
||||||||||||||||||||||||||||||||||||||||||||||||||||||||||||||||||||||||||||||||||||||||||||||||||||||||||||||||||||||||||||||||||||||||||||||||||||||||||||||||||||||||||||||||||||||||||||||||||||||||||||||||||||||||||||||||||||||||||||||||||||||||||||||||||||||||||||||||||||||||||||||||||||||||||


