
|
|
1.IntroductionBreast cysts are among the most common benign lesions in the breast.1 These fluid-filled sacs usually develop in the ducts and acini because of an imbalance between secretion and drainage of the ducts.1,2 Several hypotheses regarding this imbalance exist, and most of them consider either obstruction of the draining ducts and thereby retention of secretory material or an increase in ductular-alveolar secretion.2 Cysts are usually easily recognized using conventional breast imaging techniques. In x-ray mammography, a cyst is visualized as a circumscribed noncalcified circular density.3 Under ultrasound investigation, anechogeneity, smooth borders, and posterior echo enhancement are characteristic features for a cyst.1,4 The conventional clinical modalities are well capable of recognizing breast cysts, and there is no necessity for research into new methods for cyst imaging and diagnosis. On the contrary, breast carcinoma is often ambiguously visualized using conventional imaging techniques due to their lack of sensitivity and specificity for the disease, especially in patients with dense breast tissue.5 One of the new techniques currently under investigation for its potential in addressing some of these limitations is photoacoustic imaging (PAI), also called optoacoustic imaging.6–9 PAI combines the high contrast possible in optical imaging with the high resolution associated with ultrasound detection.10–14 Upon illumination of the tissue with short pulses of laser light, the light is absorbed by the chromophores in the tissue. In case of malignancy, hemoglobin in the tumor vasculature is believed to be the predominant absorber.15 The absorption of the light energy leads to the formation of a pressure wave by thermoelastic expansion. The pressure wave propagates through the tissue and can be detected with ultrasound detectors with the appropriate center frequency and bandwidth.16–19 From the detected signals, the location of light absorption can be retrieved with ultrasound resolution, overcoming the limitation of purely optical techniques where optical scattering causes a poor resolution deeper than several millimeters.20 This technique has several advantages for breast imaging besides the high contrast and good imaging resolution: it is noninvasive and does not require the use of ionizing radiation or contrast agents. Previously, we showed that photoacoustic mammography, as applied in the Twente photoacoustic mammoscope (PAM), is able to visualize breast malignancies as high-contrast regions in the reconstructed photoacoustic volume.7,21 However, we believe that a technique that aims at visualizing malignancies in the breast should also be able to visualize benign lesions, such as fibroadenomas and cysts, and to clearly differentiate them from malignancies. In the previous study,7 we also reported the imaging on two breasts with cysts. We were not able to recognize the cysts as the confined high-intensity areas observed for malignancies, and we attributed this to the low absorption of the water-rich cysts compared to the hemoglobin-rich malignancies. In retrospect, it is not unlikely that instrumental issues also contributed to the photoacoustic absence of cysts. Since cysts are easy to compress and move, the possibility cannot be excluded that they shifted out of the scan area of the detector during positioning. In fact, due to the nature of cysts, they can be expected to be visible using photoacoustics at certain wavelengths, but to be different in appearance from the inhomogeneously absorbing and scattering malignancies. A limited number of publications of optical imaging of breast cysts in the far-red wavelength regions22–26 shows a lower or higher homogeneous absorption, and scattering lower than that of the surrounding tissue. This is confirmed by the fact that the color of the cyst fluid can vary widely per subject. Colorless to brownish fluids are reported as well as transparent to slightly turbid fluid.2 The color of the fluid is thought not to have any diagnostic importance. Moreover, data about the origin and function of the mammary chromophores in the cyst fluid, which might include breakdown products of hemoglobin, cholesterol epoxides, and lipofuscin complexes, are lacking.2 Recently, we upgraded PAM to enable faster scanning in a larger field of view. With this system, the shifting of the cysts upon compression should be less of a problem, although the position estimation of a single cyst within the region of interest and the comparison with its position in the cranio-caudal x-ray image will still be more difficult than for malignancies, especially since there are often multiple cysts in the breast. Because of this reason, we started the investigation regarding the appearance of breast cysts in PAM by using simulations: Monte Carlo simulations and k-wave simulations were performed to couple the light–tissue interactions to the acoustic propagation. Subsequently, phantom measurements were performed to verify the results from simulations and to translate the situation to the PAM setup. Finally, patient measurements were performed in a small patient population using the upgraded version of PAM. All results were combined to investigate if cysts can be differentiated from malignancies in a PAI volume using our current image configuration, since for optimal breast cancer detection, the ability to exclude benign breast lesions is of importance. 2.Materials and Methods2.1.Twente Photoacoustic MammoscopeThe Twente PAM (Fig. 1) is built into a hospital bed on which the patient lies in prone position with her breast pendant through an aperture in the bed. Under the bed, the breast is slightly compressed between a glass plate for laser light illumination at the cranial side and the ultrasound detector array at the caudal side. The breast is illuminated with 1064 nm pulsed light (10 ns, 10 Hz) from a Q-switched Nd:YAG laser (Continuum Surelite, California). For patient and phantom measurements, an elliptical-shaped beam with a surface of and a maximum energy of 350 mJ is used (). Photoacoustic signals are detected with a 1 MHz (130% bandwidth) two-dimensional ultrasound detector array (Lunar Corporation, Wisconsin27,28) consisting of 590 polyvinylidene fluoride (PVDF) elements of with an interelement distance of 1.175 mm and directivity of 20 deg. The array covers an area of of the breast. Details of the PAM detector are described elsewhere.28 Fig. 1The Twente photoacoustic mammoscope. (a) Aperture to insert breast. (b) Ultrasound detector matrix. (c) Glass window. (d) Scanning system compartment. (e) Q-switched Nd-YAG laser operated at 1064 nm with 10-ns pulses. (f) Laser safety curtain that is drawn around the instrument during the measurements. (g) Interface electronics between detector and computer. (h) Linear stage carrying detector matrix driven by hand wheel to apply mild compression to the breast. (i) Laser remote control unit. (j) Laser power supply. Image adapted from Ref. 21 with permission.  The photoacoustic signals are read into the PC using two eight channel digitizers (National Instruments, Texas, NI PXI 5105, , 12-bit). A Labview program (National Instruments) controls the scan stage movements and the element selection. The signal processing and image reconstruction were performed off-line using MATLAB (R2011b, the Mathworks Company, Massachusetts). The raw signals were filtered with a band-pass Butterworth filter (cut-off frequencies 0.2 and 1.7 MHz) to remove the low-frequency trend and high-frequency noise. The prominent breast surface signals were removed prior to reconstruction to expand the dynamic range for signals of interest from deeper inside. A modified acoustic backprojection algorithm27,29 was used to reconstruct the images, assuming homogenous speed of sound (SOS) values of for the breast and for the 18.6 mm protective layer of the detector. After reconstruction, the separate sagittal slices were Hilbert transformed to demodulate the signals and obtain an envelope detection. All voxel intensity values were scaled to the maximum intensity value within the total volume, giving a range of intensity values between 0 and 255. 2.2.Simulations2.2.1.Monte CarloMonte Carlo simulations were performed using Montcarl 20.12 (MedPhys Software and Services, Almelo, the Netherlands30). A simplified model was used to mimic a breast with a cyst [see Fig. 2(a)]. A layer of 70 mm (the size of a relatively large breast under minimal compression in PAM) having a refractive index () of 1.42,31 an absorption coefficient () of ,32 and a reduced scattering coefficient () of was used in the model. The was chosen low compared to values from the literature32,33 so that a lower number of photon injections was required to get a statistically sufficient number of photons at and beyond the depth of the cyst. The cyst was modeled as a sphere with a 5-mm radius at a starting depth of 13 mm below the breast tissue. For each sphere, and , mimicking an aqueous medium without scattering, since the of cysts is reported and expected to be well below that of breast tissue.24 Absorption values are reported to range from below to above the absorption of the breast tissue;23,26 therefore, with values of [0.0015; 0.015; 0.030; 0.045; 0.060; 0.090] , the of the cyst was varied step-wise from below to above the of the medium. All optical properties used for the simulations and experiments (see further Sec. 2) are summarized in Table 1. To model the scattering, the Henyey-Greenstein phase function was used. Optical properties are further referred to as and for the cyst mimicking structures and and for those mimicking the breast. Fig. 2(a) Simplified breast-cyst model used in the Monte Carlo simulations. (b) A comparable physical phantom model used for the photoacoustic measurements (Sec. 2.3). 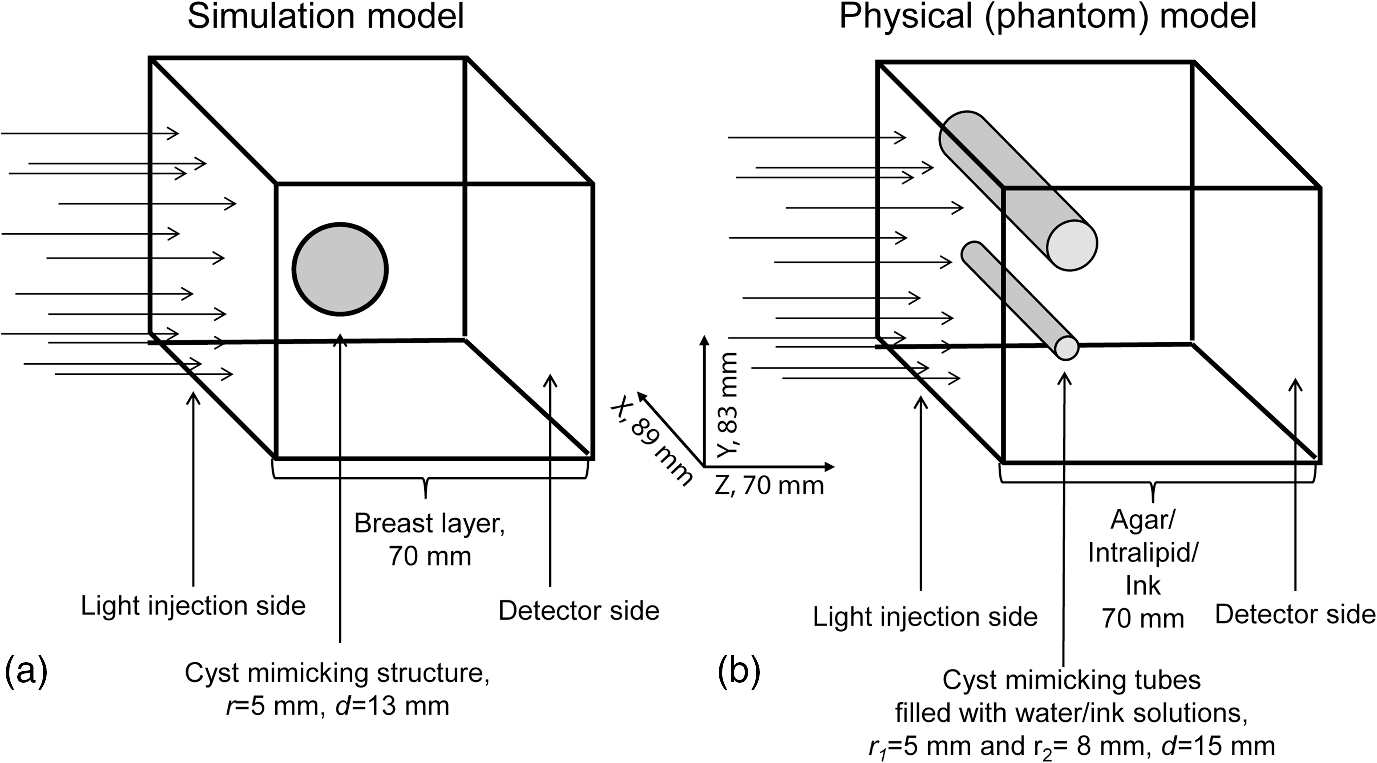 Table 1Optical properties as used in simulations and experiments compared to the literature values.
The medium was illuminated using an elliptical Gaussian beam with dimensions (FWHM) of 80 and 60 mm, approaching the dimensions of the beam used in the clinical measurements. For each photon absorbed within the area of the detector ( and ), the , , and coordinates of the voxel where absorption took place were stored. Each simulation was ended when photons were absorbed. The spatial distribution of absorbed photons was stored in a matrix (voxel size ), further referred to as the absorbed energy per voxel matrix (AE). An extra set of simulations was performed, where the cyst was modeled as a cylinder with radius of 5 mm in -direction and infinite length in the -direction. These simulations were required to understand any differences between the appearance of cylinders and spheres, since fluid-filled cylinders were used to mimic cysts in experiments due to ease of preparation and use. 2.2.2.K-waveThe acoustic propagation following the initial pressure distribution associated with AE was simulated using the k-wave toolbox (version B0.5)38 in MATLAB®. Initial pressure distributionIn PAI, the initial pressure distribution follows with the initial pressure distribution (Pa), the (dimensionless) Grüneisen coefficient, and the local absorbed energy density (), obtained from the Monte Carlo simulations as matrix AE and described by where is the optical fluence () and is the optical absorption coefficient (). is given as where is the isobaric volume expansion coefficient in , is the speed of sound in the medium (), and is the specific heat in . was chosen to be 0.8 for the solid tissue,39 and 0.2 for the cyst fluid, mimicking a water-like medium at body temperature.40Acoustic mediumThe acoustic medium through which the pressure wave propagates is assumed to have a constant speed of sound of and an acoustic attenuation (AA) of for breast tissue and for cyst fluid.41 The properties of the acoustic medium are listed in Table 2. All acoustic properties were chosen for glandular breast tissue since most cysts arise in glandular tissue. Table 2Acoustic properties of the medium modeled in k-wave. Signal detectionSignals are detected by elements mimicking the detector in PAM as described in Sec. 2.1. In the k-wave code, the elements are specified to have a center frequency of 1 MHz and a bandwidth of 130%. Signals were processed and reconstructed as described in Sec. 2.1; however, in this case, signals were filtered with a high-pass Butterworth filter only (cut-off frequency 0.3 MHz) to remove the low-frequency trend in the signal. 2.3.Phantom Measurements2.3.1.Phantom preparationThe cysts were modeled as two fluid-filled cylindrical cavities in a 3% agar (Sigma Aldrich, Missouri) phantom [Fig. 2(b)] with and as in Table 1. The cavities have radii of 5 and 8 mm, respectively, and are located at a starting depth of 15 mm. An aqueous solution of Agar 3% by weight concentration was prepared. Black ink (Ecoline Black, Royal Talens, Apeldoorn, the Netherlands) and Intralipid 20% (Fresenius Kabi, Homburg, Germany) were added to the cooled-down solution to adjust the absorption and scattering, respectively. In order to be able to measure a larger range of , with the lowest available being that of water (), was chosen relatively high compared to the literature values (Table 1). For the same value as in the simulations was used (), slightly lower than the value characteristic for the breast (0.6 to , Table 1). The obtained anisotropy value was less realistic () compared to breast tissue. 2.3.2.Phantom measurementsMeasurements were performed using the Twente PAM as described in Sec. 2.1. Upon fixation of the phantom in the imager, the cylindrical cavities were filled with water and water-ink solutions. In the first measurement, water was used with a of , which is below . In the second measurement with black ink, a of was used, far above . Signals were averaged 150 times and reconstruction was applied as described in Sec. 2.1. 2.4.Patient MeasurementsThe measurement protocol and informed consent procedure were approved by the institutional review board [Medical Ethics Committee (METC), Medisch Spectrum Twente (MST), Enschede]. The study is registered in the Netherlands trial register as TC 2945. In the period from April to December 2012, patients at the center of breast care of the MST with one or more nonsuspicious breast cysts were included in the study. Details of the measurement and imaging protocol are described in Ref. 7. Photoacoustic image reconstruction was applied as described in Sec. 2.1. In addition, cyst fluid was obtained, with permission, from patients whose nonsuspicious cysts were aspirated because of physical or mental discomfort. Each fluid batch was visually inspected for color and turbidity. 3.Results3.1.Simulations3.1.1.Depth profile of absorbed energyFigure 3 shows the depth profiles of AE from the Monte Carlo simulations for three situations: Fig. 3(a) for (); Fig. 3(b) for ; and Fig. 3(c) for (). Gray dashed lines represent the AE profiles, while the bold lines show AE multiplied with the local Grüneisen coefficient ( for the breast and for the cyst). The latter correction with would better resemble the shape of the initial pressure distribution profile. Fig. 3Absorbed energy density and pressure versus depth. (a) . (b) . (c) . The gray dashed lines indicate the absorbed energy per voxel (a.u.) over depth (mm), while the bold lines also take the variation in local Grüneisen coefficient () into account.  As expected, there is an initial exponential decay of the absorbed energy over depth. The decay rate is approximately equal to the calculated (fit , calculation ). Until the depth of the cyst (13 mm), the profile is the same for all three situations, except for statistical variations caused by the limited number of photons. In the case where [Fig. 3(a)], there is a sudden drop in the absorbed energy at the starting point of the cyst (). At the end of the cyst (), there is an increase in the absorbed energy, after which the absorbed energy starts to decay exponentially again. There is hardly any difference between the profiles with and without correction for . If [Fig. 3(b)], the starting point and ending point of the cyst are hardly visible when only the absorbed energy is taken into account, but can still be seen as a sudden drop and increase, respectively, when is considered as well. For the case where [Fig. 3(c)], the situation is reversed. Here, at , an increase in the absorbed energy can be seen, while there is a slight drop in the absorbed energy at the end of the cyst. After multiplication with , a drop in the pressure distribution can be seen at 13 mm, while the back of the cyst becomes invisible. 3.1.2.Results following reconstruction of k-wave signalsFigure 4 shows the reconstructed images from the simulated photoacoustic measurements for the situation [Figs. 4(a), 4(b), and 4(c)], [Figs. 4(d), 4(e), and 4(f)], or [Figs. 4(g), 4(h), and 4(i)], following k-wave simulations including variations in , SOS, and AA. For all situations, the upper panel [(a), (d), (g)] shows a portion of the three-dimensional (3-D) volume, the middle panel [(b), (e), (h)] shows a slice in the sagittal direction (indicated by the black dashed area in the 3-D volume), and the lower panel [(c), (f), (i)] shows a profile through the center of the sphere (indicated by the white dashed line in the slices). For the latter situation, both a raw signal as well as the Hilbert demodulated signal are shown. The gray dashed lines indicate the profile in case only AE is taken into account, i.e., in case the variations in , SOS, and AA are ignored. Fig. 4Three-dimensional (3-D) volumes [(a), (d), (g)], transversal slices [(b), (e), (h)], and profiles [(c, f, i)] through reconstructed image volumes of k-wave simulated photoacoustic signals. The profiles (bold black) are compared to the profiles through the volume without corrections for variations in and acoustic properties (gray dashed). (a) to (c) . (d) to (f) . (g) to (i) .  It can be seen that in the first two situations ( and ), two regions with high intensity are visible [Figs. 4(a) to 4(c) and Figs. 4(d) to 4(f)]. Since the locations of these regions match the starting and ending depth of the cyst, we attribute these regions as representing the front (illumination side) and back (detection side) of the cyst. When , the front and back of the cyst are only clearly visible if the local variations in and acoustic properties are taken into account, as seen in Fig. 4(f) (black lines). Thus, the absorbed energy alone is not enough to clearly visualize the cyst as could also be expected from Fig. 3(b). When [Figs. 4(g) to 4(i)], only one high-intensity area can be observed, which originates from the front of the cyst. The back of the cyst becomes invisible after corrections for variations in and acoustic properties. Based on the absorbed energy profile alone [Fig. 3(c), dashed line], one would expect the back to be visible as well, as long as enough photons are able to reach the back of the cyst. It can be observed from the profiles (without corrections for , SOS, and AA) that the photoacoustic signal changes in shape for different transitions. The signal from the front of the cyst is reversed for the high-absorbing cyst [Fig. 4(i)] as compared to the low-absorbing cyst [Fig. 4(c)]. Moreover, the shape of the front and back signals differ for all three situations. However, these differences become less pronounced when , SOS, and AA are taken into account. 3.1.3.Spheres versus cylindersWe also simulated photoacoustic volumes using cylinders and spheres for the cysts. While the expected differences in the shapes of the signal coming from the sphere and the cylinder are observed, these differences are minor in the demodulated signals. This justifies the use of the easy to prepare and use liquid-filled cylinders to simulate cysts in phantom experiments as a substitute for spheres. 3.2.Phantom MeasurementsFigure 5 shows slices and profiles through the reconstructed photoacoustic volumes from the phantom measurements for both the low [water, , Figs. 5(b) and 5(c)] and high [ink, , Figs. 5(d) and 5(e)] absorbing inclusion. For the low absorbing inclusion, two signals are visible at depths that match the front and the back of the inclusion as was the case for the simulations. These two signals clearly differ in shape as can also be seen, although less pronounced, in the simulations where variations in and acoustic properties were not taken into account [Figs. 4(c), 4(f), and 4(i), dashed lines]. For the high absorbing inclusion, only the front of the cyst is visible. The shape of the photoacoustic signal from the front of the tube is reversed for the high absorbing fluid [Fig. 5(e)] compared to the low absorbing fluid [Fig. 5(c)]. Fig. 5Results from the photoacoustic reconstruction of the phantom measurements. (a) Orientation of the shown signal and slices with respect to the phantom model. Slices [left, (b) and (d)] and profiles [right, (c) and (e)] through the structure of interest in the photoacoustic volume are visualized. (b) and (c) The top panel shows the results for the water measurement (). (d) and (e) The lower panel shows the results for the ink measurements (). The black dashed lines indicate the position of the profiles. 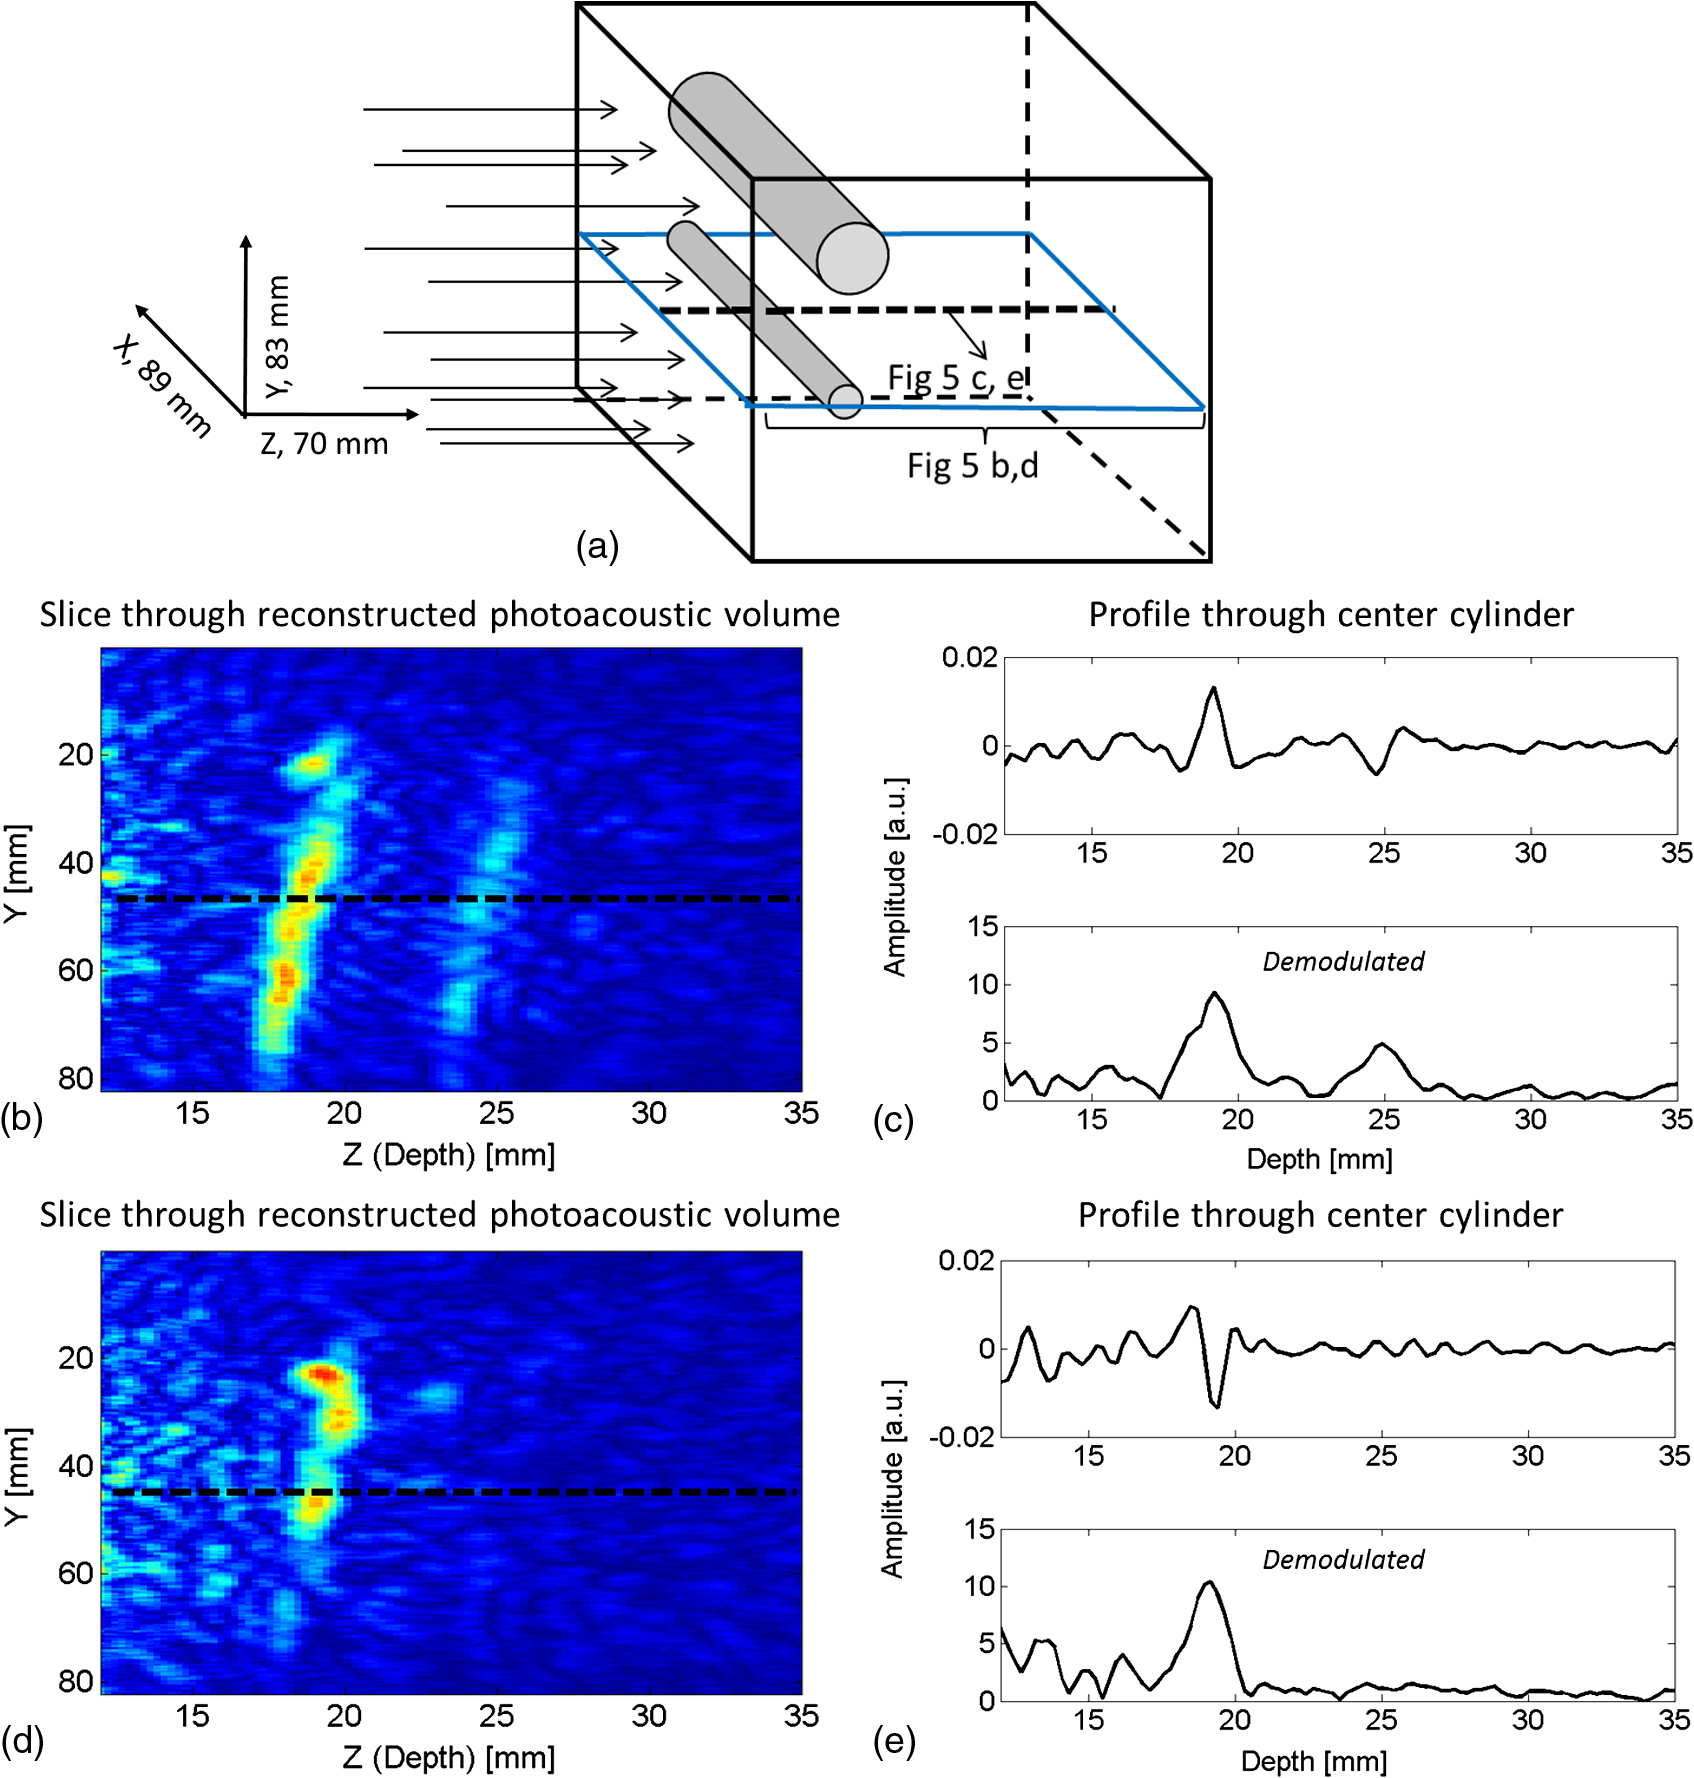 3.3.PatientsFour cases of breasts with fluid-filled cysts were imaged using PAM. In patients, and are not known. Therefore, the specific shape of the signals cannot be predicted. Moreover, the cysts are embedded in an optically and acoustically inhomogeneous medium, confounding the differentiation of signals from cysts from signals from other absorbing structures in the breast. In three of the four cases, the cysts were observed as one or more high-intensity areas at the expected location in the PAI volume. Here, we chose to present a case that is largely representative of the other cases, but with a slightly more atypical photoacoustic presentation. This 49-year-old patient discovered a palpable mass in her right breast. Upon clinical investigation, a smooth and mobile mass could be palpated at 9 to 10 o’clock in the right breast. X-ray mammography [Fig. 6(a)] showed a sharply delineated, circular mass in the lateral upper quadrant of the right breast. The lesion was assigned as being probably benign, BI-RADS 3. Ultrasound investigation [Fig. 6(b)] showed clear signs of a benign cyst at the indicated area. A 22-mm (transversal direction) hypoechoic area, with posterior enhancement and acoustic shadow caused by the refraction of the ultrasound at the edges of the cyst, was observed below the skin surface. The 15-mm-thick (axial direction) cyst was surrounded partly by fatty (upper side) and partly by glandular (lower side) tissue. The ultrasound image was judged to be most probably benign (BI-RADS 2). Fig. 6Imaging results from a 49-year-old patient with a palpable lesion in her right breast. (a) X-ray mammography shows a sharply delineated, circular mass in the lateral upper quadrant of the right breast, which is judged as being probably benign. (b) Ultrasonography reveals the presence of a benign cyst because of a circumscribed hypoechoic lesion with posterior enhancement and acoustic refraction at the edges of the lesion. (c) to (e) Photoacoustic imaging shows enhancement of the front and the back of the cyst, with comparable characteristics as for the phantom and patient measurements. (c) 3-D subvolume of the cyst; the black dotted square indicates the orientation of the sagittal slice of (d) and (e) profile through the center of the cyst, as indicated by the white dotted line in (d).  Photoacoustic mammography shows two high-intensity areas, lying almost on top of each other as is shown in Figs. 6(c) and 6(d). The depth at which the lesion can be seen matches the expected cyst depth. The (demodulated and modulated) profiles through the lesion [Fig. 6(e)] show comparable characteristics as the profiles from the simulations and phantom measurements: two photoacoustic signals are visible at depths matching the front and the back of the cysts, and these two signals are reversed in sign and different in shape. The difference with simulations and phantom results, and with other cases, is that the signal from the back of the cyst appears stronger than the leading signal. Comparable profiles could be seen in at least part of the cyst representing regions in two other patients. In one out of the four patients, large and multiple benign cysts were present in the breast, which could not be visualized using PAM. Five batches of cyst fluid were obtained from patients whose nonsuspicious cysts were aspirated. Upon visual inspection, both the color as well as the scattering was highly varying between the batches of cyst fluid from the different patients, as can be seen in Fig. 7. Differentiation of absorption and scattering was not possible since the non-negligible scattering made the interpretation of transmission spectra difficult. 4.DiscussionIn the search for improved imaging modalities for detection and diagnosis of breast cancer, the ability to differentiate between benign cysts and malignant lesions is of great importance. Photoacoustic imaging is a relatively new imaging modality that has potential for visualizing breast malignancies, but little is known about the photoacoustic appearance of breast cysts. In this study, we investigated the visibility of benign breast cysts in forward mode photoacoustic mammography using 1064 nm light, as currently applied in clinical studies.7 The results from (Monte Carlo and k-wave) simulations and phantom measurements were used to interpret and understand the results from patient measurements. In this section, the results and their implications for PAM and photoacoustic mammography in general are discussed. 4.1.Visibility of Cysts Using PAM4.1.1.Simulations and phantom measurementsThe results from the simulations and phantom measurements showed that cysts can indeed be visible using PAM as either one or two high-contrast areas in the reconstructed photoacoustic volumes (Fig. 4). Based on the depths at which the high-intensity areas were observed, we attributed them to representing either the front (illumination side) or the front and the backside (detection side) of the cyst. From the absorbed energy profiles (Fig. 3), we could see that these are also the locations where there is a sudden change (either a drop or an increase) in the absorbed energy. Therefore, the front and back representations of the cysts are believed to be a true representation of the initial pressure distribution and not an artifact of limited detection bandwidth. This is further supported by an extra set of k-wave simulations in which we modeled an ideal ultrasound detector, i.e., a detector for which we do not specify a center frequency and bandwidth. With the exception of signal shape variations, the simulations also show the front and back of the cyst as seen in Fig. 8. Fig. 8Photoacoustic profile through reconstructed photoacoustic volume after k-wave simulations for (a) the photoacoustic mammoscope detector having 1 MHz center frequency and 130% bandwidth and (b) an ideal transducer, which is equally sensitive for all frequencies. The same band-pass filtering is applied for both situations. Although there are some shape and amplitude differences between (a) and (b), it becomes clear that also in the ideal case a front and back enhancement can be seen. 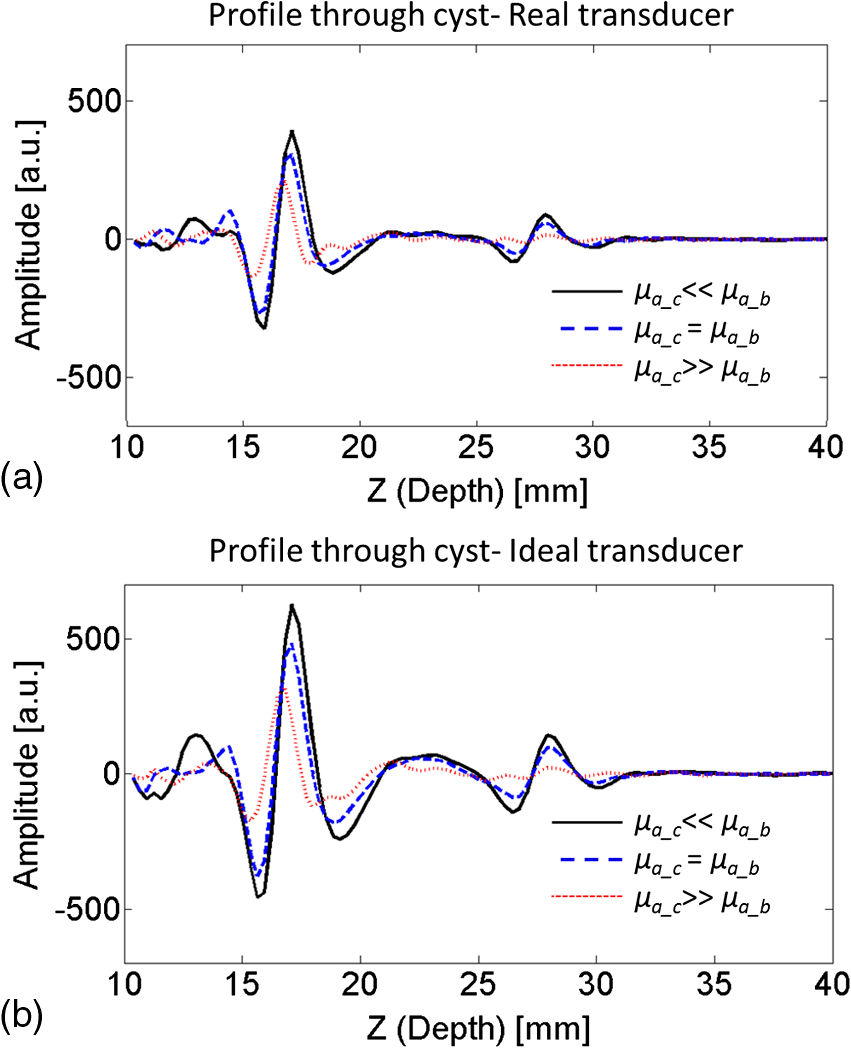 In the absorbed energy profiles (Fig. 3), it can further be seen that the variation in Grüneisen coefficient () between cysts and solid breast tissue plays an important role in the visibility of especially the backside of the cyst. This variation causes a gradient in the initial pressure distribution upon pulsed laser illumination and thereby an observable photoacoustic signal, which makes even a cyst with equal absorption as its background visible in PAM [Figs. 4(d) to 4(f)]. Moreover, for highly absorbing cysts, the front side is less pronounced because of the decrease in when going from the relatively solid breast tissue to the fluid-filled sac. In this case, the backside is hardly visible, even if enough photons are able to reach the backside of the cyst [Fig. 3(c)]. In such a situation, it would be difficult to differentiate the cyst from a malignancy, using the current forward mode imaging configuration. Including variations in and acoustic properties in the simulations also makes the shape difference between signals from low and high absorbing cyst mimicking structures, as well as from the front and the back of the cyst, less pronounced. However, these shape differences are present in the results from phantom measurements. This might indicate that the of Agar is closer to water than is the of biological tissue as used in the simulations, lowering its influence on the final results. Moreover, the absorption contrast used in the phantom measurements was much higher than that for the simulations, and this possibly overrules the effect of . 4.1.2.Clinical measurementsIn the clinical measurements, three out of the four benign cysts were observed with at least partly the same features obtained during the simulations and phantom measurements. These features include the visibility of one or two signals representing the front or the front-and backside of the cyst and the change in signal shape when comparing the signals from the front and the back of the cyst. However, we chose to present a case that is slightly atypical, while sharing the most important features with other cases (Fig. 6). The first unusual aspect is that the back signal of the cyst appears to have a higher amplitude than the front, which was not observed in phantom measurements and simulations. The explanation for this feature can be found in the ultrasound image (Fig. 6(b)), where the cyst is surrounded partly by the subcutaneous fat and partly by the glandular tissue. Fat has a lower than glandular tissue at 1064 nm,32 making the absorption contrast at the front of the cyst lower than that at the back of the cyst. The second aspect is the small distance between the front and the back signal of the cyst in the PA image. Based on the ultrasound image, this distance is expected to be at least 15 mm, while in the PA image, the distance is less than half of this. This phenomenon was observed for the other two photoacoustically visible cysts as well. This might be the consequence of the shifting and compression of the cyst in the PAM situation, which was not modeled in simulations and was not observed in the phantom measurements because of the stiffness of Agar. 4.2.Phantom and Simulation ModelsThe correspondence in shape and position of the photoacoustic signals following reconstruction of the measurements and simulations showed that our models, although simplified, were sufficient to investigate the in vivo situation. From reported optical imaging studies,22–26 it is known that cysts are usually homogeneously absorbing, with an absorption coefficient () varying from below to above the absorption coefficient of breast tissue () and a scattering coefficient () almost always below that of breast tissue (). Therefore, the optical properties of both the simulation and phantom models were chosen appropriately. However, aspiration of cyst fluid from human subjects revealed that cyst fluid can in fact be rather turbid (Fig. 7), which was not accounted for in the simulations. Extra simulations (not shown here), with ranging from below to equal to , reveal that the scattering coefficient in this range can slightly decrease the visibility of the back of the cyst, but that the influence is minor with respect to the influence of the absorption coefficient, which is believed to be much more varying between patients. In the simulations, cysts are modeled as spherical structures, while in phantom measurements, the easier-to-produce fluid-filled cylinders are used to model the cyst. An extra set of simulations showed that this simplification is justifiable since the difference between the sphere and cylinder signals does not change the conclusions. Last, the breast was modeled as a homogenous medium, with optical and acoustic values approaching those of glandular breast tissue. The fact that cysts most commonly arise by duct obstruction in the glandular tissue justifies this choice. A more complicated, multilayered model is not believed to improve the understandability and reliability of the results. 4.3.Implications for PAM and Photoacoustic Cyst Imaging in DiagnosisUsing the current forward-mode single-wavelength PAM, differentiation of cysts from one or two malignancies might be problematic in some cases. The appearance of a leading and second high-contrast area along the normal from illumination to detection is not necessarily an exclusive feature for a cyst, and a multifocal carcinoma could also present such an appearance. Further, in the case of highly absorbing cysts, the back of the cyst might be invisible, additionally confounding the differentiation of cysts from malignancies if the two-contrast area feature is assumed to be the signature appearance of cysts. With the forward-mode single-wavelength system, malignancies often appear as single high-contrast areas in the PAI volume. Measuring with multiple wavelengths will be of utmost importance to differentiate hemoglobin absorption associated with malignancies from the absorption by chromophores more characteristic for cyst fluid.2 For the optimal choice of wavelengths, the optical absorption spectra of a large set of aspirated cyst fluids should be measured. The reported results further recommend the use of a closed detection aperture with reconstructions from multiple projections as in a tomographic imaging geometry46,47 with a more homogenous fluence distribution. While the inhomogeneous absorbing malignancies will be most likely visible as heterogeneous masses with absorption throughout the entire lesion, we predict that cysts will be visible as structures with a thin shell because of the strong change in fluence at the edges of the cyst. Simulations using the computed tomography approach should throw more light on the implications of tomographic imaging for differentiating cysts from malignancies. Finally, a better differentiation between cysts and malignancies is expected by combining PAI with imaging of ultrasound properties of the medium, like acoustic attenuation imaging.47,48 5.ConclusionsCysts can be visible in forward-mode PAM as one or more pronounced, confined high-contrast areas representing the front (illumination side) or the front and the back (detection side) of the cyst. In the current forward-mode imaging configuration and with one wavelength, cysts may be mistaken for malignancies, which can also present as one or multiple confined contrast areas. Performing PAI with multiple projections in a computed tomographic geometry will most likely permit discrimination. However, quantitative multispectral PAI is expected to provide the most robust differentiation of cysts from malignancies. AcknowledgmentsThe financial support of the Agentschap NL Innovation-Oriented Research Programme Photonic Devices under the HYMPACT Project (IPD083374); MIRA Institute for Biomedical Technology and Technical Medicine; and the Vernieuwingsimpuls project (VICI grant 10831 of the Netherlands Technology Foundation STW) of W.S. are acknowledged. We thank the nurse practitioner, radiologists, and nurses from the Center for Breast Care of the Medisch Spectrum Twente for their help with patient inclusion and patient positioning. All patients are gratefully acknowledged for their cooperation to the study. ReferencesP. Rinaldiet al.,
“Cystic breast lesions: sonographic findings and clinical management,”
J. Ultrasound Med., 29
(11), 1617
–1626
(2010). JUMEDA 0278-4297 Google Scholar
F. MannelloG. A. M. TontiS. Papa,
“Human gross cyst breast disease and cystic fluid: bio-molecular, morphological, and clinical studies,”
Breast Cancer Res. Treat., 97
(2), 115
–129
(2006). http://dx.doi.org/10.1007/s10549-005-9110-y BCTRD6 0167-6806 Google Scholar
E. A. Sickles,
“Breast imaging: from 1965 to the present,”
Radiology, 215
(1), 1
–16
(2000). http://dx.doi.org/10.1148/radiology.215.1.r00ap151 RADLAX 0033-8419 Google Scholar
N. VelezD. E. EarnestE. D. Staren,
“Diagnostic and interventional ultrasound for breast disease,”
Am. J. Surg., 180
(4), 284
–287
(2000). http://dx.doi.org/10.1016/S0002-9610(00)00459-1 AJOOA7 0096-6347 Google Scholar
C. S. GiessE. P. FrostR. L. Birdwell,
“Difficulties and errors in diagnosis of breast neoplasms,”
Semin. Ultrasound CT MR, 33
(4), 288
–299
(2012). http://dx.doi.org/10.1053/j.sult.2012.01.007 SEULDO 0194-1720 Google Scholar
S. A. Ermilovet al.,
“Laser optoacoustic imaging system for detection of breast cancer,”
J. Biomed. Opt., 14
(2), 024007
(2009). http://dx.doi.org/10.1117/1.3086616 JBOPFO 1083-3668 Google Scholar
M. Heijblomet al.,
“Visualizing breast cancer using the Twente photoacoustic mammoscope: What do we learn from twelve new patient measurements?,”
Opt. Express, 20
(11), 11582
–11597
(2012). http://dx.doi.org/10.1364/OE.20.011582 OPEXFF 1094-4087 Google Scholar
T. Kitaiet al.,
“Photoacoustic mammography: initial clinical results,”
Breast Cancer,
(2012). http://dx.doi.org/10.1007/s12282-012-0363-0 BCATDJ 0161-0112 Google Scholar
A. A. KarabutovN. B. PodymovaV. S. Letokhov,
“Time-resolved laser optoacoustic tomography of inhomogeneous media,”
Appl. Phys. B, 63
(6), 545
–563
(1996). APBOEM 0946-2171 Google Scholar
P. Beard,
“Biomedical photoacoustic imaging,”
Interface focus, 1
(4), 602
–631
(2011). http://dx.doi.org/10.1098/rsfs.2011.0028 2042-8898 Google Scholar
C. LutzweilerD. Razansky,
“Optoacoustic imaging and tomography: reconstruction approaches and outstanding challenges in image performance and quantification,”
Sensors (Basel), 13
(6), 7345
–7384
(2013). http://dx.doi.org/10.3390/s130607345 SNSRES 0746-9462 Google Scholar
S. MallidiG. P. LukeS. Emelianov,
“Photoacoustic imaging in cancer detection, diagnosis, and treatment guidance,”
Trends Biotechnol., 29
(5), 213
–221
(2011). http://dx.doi.org/10.1016/j.tibtech.2011.01.006 TRBIDM 0167-7799 Google Scholar
V. NtziachristosD. Razansky,
“Molecular imaging by means of multispectral optoacoustic tomography (MSOT),”
Chem. Rev., 110
(5), 2783
–2794
(2010). http://dx.doi.org/10.1021/cr9002566 CHREAY 0009-2665 Google Scholar
L. V. WangS. Hu,
“Photoacoustic tomography: in vivo imaging from organelles to organs,”
Science, 335
(6075), 1458
–1462
(2012). http://dx.doi.org/10.1126/science.1216210 SCIEAS 0036-8075 Google Scholar
M. Heijblomet al.,
“Imaging tumor vascularization for detection and diagnosis of breast cancer,”
Technol. Cancer Res. Treat., 10
(6), 607
–623
(2011). TCRTBS 1533-0346 Google Scholar
V. G. AndreevA. A. KarabutovA. A. Oraevsky,
“Detection of ultrawide-band ultrasound pulses in optoacoustic tomography,”
IEEE Trans. Ultrason., Ferroelectr., Freq. Control, 50
(10), 1383
–1390
(2003). http://dx.doi.org/10.1109/TUFFC.2003.1244756 ITUCER 0885-3010 Google Scholar
A. RosenthalD. RazanskyV. Ntziachristos,
“Wideband optical sensing using pulse interferometry,”
Opt. Express, 20
(17), 19016
–19029
(2012). http://dx.doi.org/10.1364/OE.20.019016 OPEXFF 1094-4087 Google Scholar
W. F. Xiaet al.,
“An optimized ultrasound detector for photoacoustic breast tomography,”
Med. Phys., 40 032901
(2013). MPHYA6 0094-2405 Google Scholar
E. ZhangJ. LauferP. Beard,
“Backward-mode multiwavelength photoacoustic scanner using a planar Fabry-Perot polymer film ultrasound sensor for high-resolution three-dimensional imaging of biological tissues,”
Appl. Opt., 47
(4), 561
–577
(2008). http://dx.doi.org/10.1364/AO.47.000561 APOPAI 0003-6935 Google Scholar
V. Ntziachristos,
“Going deeper than microscopy: the optical imaging frontier in biology,”
Nat. Methods, 7
(8), 603
–614
(2010). http://dx.doi.org/10.1038/nmeth.1483 1548-7091 Google Scholar
S. Manoharet al.,
“Initial results of in vivo non-invasive cancer imaging in the human breast using near-infrared photoacoustics,”
Opt. Express, 15
(19), 12277
–12285
(2007). http://dx.doi.org/10.1364/OE.15.012277 OPEXFF 1094-4087 Google Scholar
Q. Fanget al.,
“Combined optical and X-ray tomosynthesis breast imaging,”
Radiology, 258
(1), 89
–97
(2011). http://dx.doi.org/10.1148/radiol.10082176 RADLAX 0033-8419 Google Scholar
X. Guet al.,
“Differentiation of cysts from solid tumors in the breast with diffuse optical tomography,”
Acad. Radiol., 11
(1), 53
–60
(2004). http://dx.doi.org/10.1016/S1076-6332(03)00562-2 1076-6332 Google Scholar
P. Taroniet al.,
“Time-resolved optical mammography between 637 and 985 nm: clinical study on the detection and identification of breast lesions,”
Phys. Med. Biol., 50
(11), 2469
–2488
(2005). http://dx.doi.org/10.1088/0031-9155/50/11/003 PHMBA7 0031-9155 Google Scholar
T. Yateset al.,
“Optical tomography of the breast using a multi-channel time-resolved imager,”
Phys. Med. Biol., 50
(11), 2503
–2517
(2005). http://dx.doi.org/10.1088/0031-9155/50/11/005 PHMBA7 0031-9155 Google Scholar
S. van de Venet al.,
“Diffuse optical tomography of the breast: initial validation in benign cysts,”
Mol. Imaging Biol., 11
(2), 64
–70
(2009). http://dx.doi.org/10.1007/s11307-008-0176-x 1536-1632 Google Scholar
S. Manoharet al.,
“The Twente photoacoustic mammoscope: system overview and performance,”
Phys. Med. Biol., 50
(11), 2543
–2557
(2005). http://dx.doi.org/10.1088/0031-9155/50/11/007 PHMBA7 0031-9155 Google Scholar
D. Piraset al.,
“Photoacoustic imaging of the breast using the Twente photoacoustic mammoscope: present status and future perspectives,”
IEEE J. Sel. Topics Quantum Electron., 16
(4), 730
–739
(2010). http://dx.doi.org/10.1109/JSTQE.2009.2034870 IJSQEN 1077-260X Google Scholar
C. G. A. HoelenF. F. M. De Mul,
“Image reconstruction for photoacoustic scanning of tissue structures,”
Appl. Opt., 39
(31), 5872
–5883
(2000). http://dx.doi.org/10.1364/AO.39.005872 APOPAI 0003-6935 Google Scholar
F. F. M. De Mul,
“Monte-Carlo simulation of light transport in turbid media,”
Handbook of Coherent Domain Optical Methods, Biomedical Diagnostics, Environment and Material Science, 465
–533 Kluwer PublishersDeventer, the Netherlands,2004). Google Scholar
H. Dehghaniet al.,
“Effects of refractive index on near-infrared tomography of the breast,”
Appl. Opt., 44
(10), 1870
–1878
(2005). http://dx.doi.org/10.1364/AO.44.001870 APOPAI 0003-6935 Google Scholar
P. Taroniet al.,
“Diffuse optical spectroscopy of breast tissue extended to 1100 nm,”
J. Biomed. Opt., 14
(5), 054030
(2009). http://dx.doi.org/10.1117/1.3251051 JBOPFO 1083-3668 Google Scholar
N. Shahet al.,
“Noninvasive functional optical spectroscopy of human breast tissue,”
Proc. Natl. Acad. Sci. U. S. A., 98
(8), 4420
–4425
(2001). http://dx.doi.org/10.1073/pnas.071511098 1091-6490 Google Scholar
B. R. PetersP. J. ReardonJ. V. Reardon,
“Compact optical interconnect module,”
Proc. SPIE, 3226 67
–74
(1997). http://dx.doi.org/10.1117/12.284569 PSISDG 0277-786X Google Scholar
Y. WangR. K. Wang,
“High-resolution computed tomography of refractive index distribution by transillumination low-coherence interferometry,”
Opt. Lett., 35
(1), 91
–93
(2010). http://dx.doi.org/10.1364/OL.35.000091 OPLEDP 0146-9592 Google Scholar
Q. Yeet al.,
“Measurement of the complex refractive index of tissue-mimicking phantoms and biotissue by extended differential total reflection method,”
J. Biomed. Opt., 16
(9), 097001
(2011). http://dx.doi.org/10.1117/1.3615657 JBOPFO 1083-3668 Google Scholar
D. D. RoystonR. S. PostonS. A. Prahl,
“Optical properties of scattering and absorbing materials used in the development of optical phantoms at 1064 nm,”
J. Biomed. Opt., 1
(1), 110
–116
(1996). http://dx.doi.org/10.1117/12.227698 JBOPFO 1083-3668 Google Scholar
B. E. TreebyB. T. Cox,
“k-Wave: MATLAB toolbox for the simulation and reconstruction of photoacoustic wave fields,”
J. Biomed. Opt., 15
(2), 021314
(2010). http://dx.doi.org/10.1117/1.3360308 JBOPFO 1083-3668 Google Scholar
B. T. CoxJ. G. LauferP. C. Beard,
“The challenges for quantitative photoacoustic imaging,”
Proc. SPIE, 7177 717713
(2009). http://dx.doi.org/10.1117/12.806788 PSISDG 0277-786X Google Scholar
I. V. LarinaK. V. LarinR. O. Esenaliev,
“Real-time optoacoustic monitoring of temperature in tissues,”
J. Phys. D Appl. Phys., 38
(15), 2633
–2639
(2005). http://dx.doi.org/10.1088/0022-3727/38/15/015 JPAPBE 0022-3727 Google Scholar
J. E. Browneet al.,
“Assessment of the acoustic properties of common tissue-mimicking test phantoms,”
Ultrasound Med. Biol., 29
(7), 1053
–1060
(2003). http://dx.doi.org/10.1016/S0301-5629(03)00053-X USMBA3 0301-5629 Google Scholar
R. G. Barret al.,
“Speed of sound imaging improved image quality in breast sonography,”
Ultrasound Q., 25
(3), 141
–144
(2009). http://dx.doi.org/10.1097/RUQ.0b013e3181b789aa ULQUEZ 0894-8771 Google Scholar
J. LubbersR. Graaff,
“A simple and accurate formula for the sound velocity in water,”
Ultrasound Med. Biol., 24
(7), 1065
–1068
(1998). http://dx.doi.org/10.1016/S0301-5629(98)00091-X USMBA3 0301-5629 Google Scholar
V. Rajagopalet al.,
“Creating individual-specific biomechanical models of the breast for medical image analysis,”
Acad. Radiol., 15
(11), 1425
–1436
(2008). http://dx.doi.org/10.1016/j.acra.2008.07.017 1076-6332 Google Scholar
X. Wanget al.,
“Microwave induced thermal acoustic imaging modeling for potential breast cancer detection,”
in IEEE Antennas Propag. Mag.,
722
–725
(2011). Google Scholar
R. Maet al.,
“Non-invasive whole-body imaging of adult zebrafish with optoacoustic tomography,”
Phys. Med. Biol., 57
(22), 7227
–7237
(2012). http://dx.doi.org/10.1088/0031-9155/57/22/7227 PHMBA7 0031-9155 Google Scholar
S. A. Ermilovet al.,
“3D laser optoacoustic ultrasonic imaging system for preclinical research,”
in Photons Plus Ultrasound: Imaging and Sensing 2013,
85810N
(2013). Google Scholar
J. Joseet al.,
“Passive element enriched photoacoustic computed tomography (PER PACT) for simultaneous imaging of acoustic propagation properties and light absorption,”
Opt. Express, 19
(3), 2093
–2104
(2011). http://dx.doi.org/10.1364/OE.19.002093 OPEXFF 1094-4087 Google Scholar
|
||||||||||||||||||||||||||||||||||||||||||||||||


