|
|
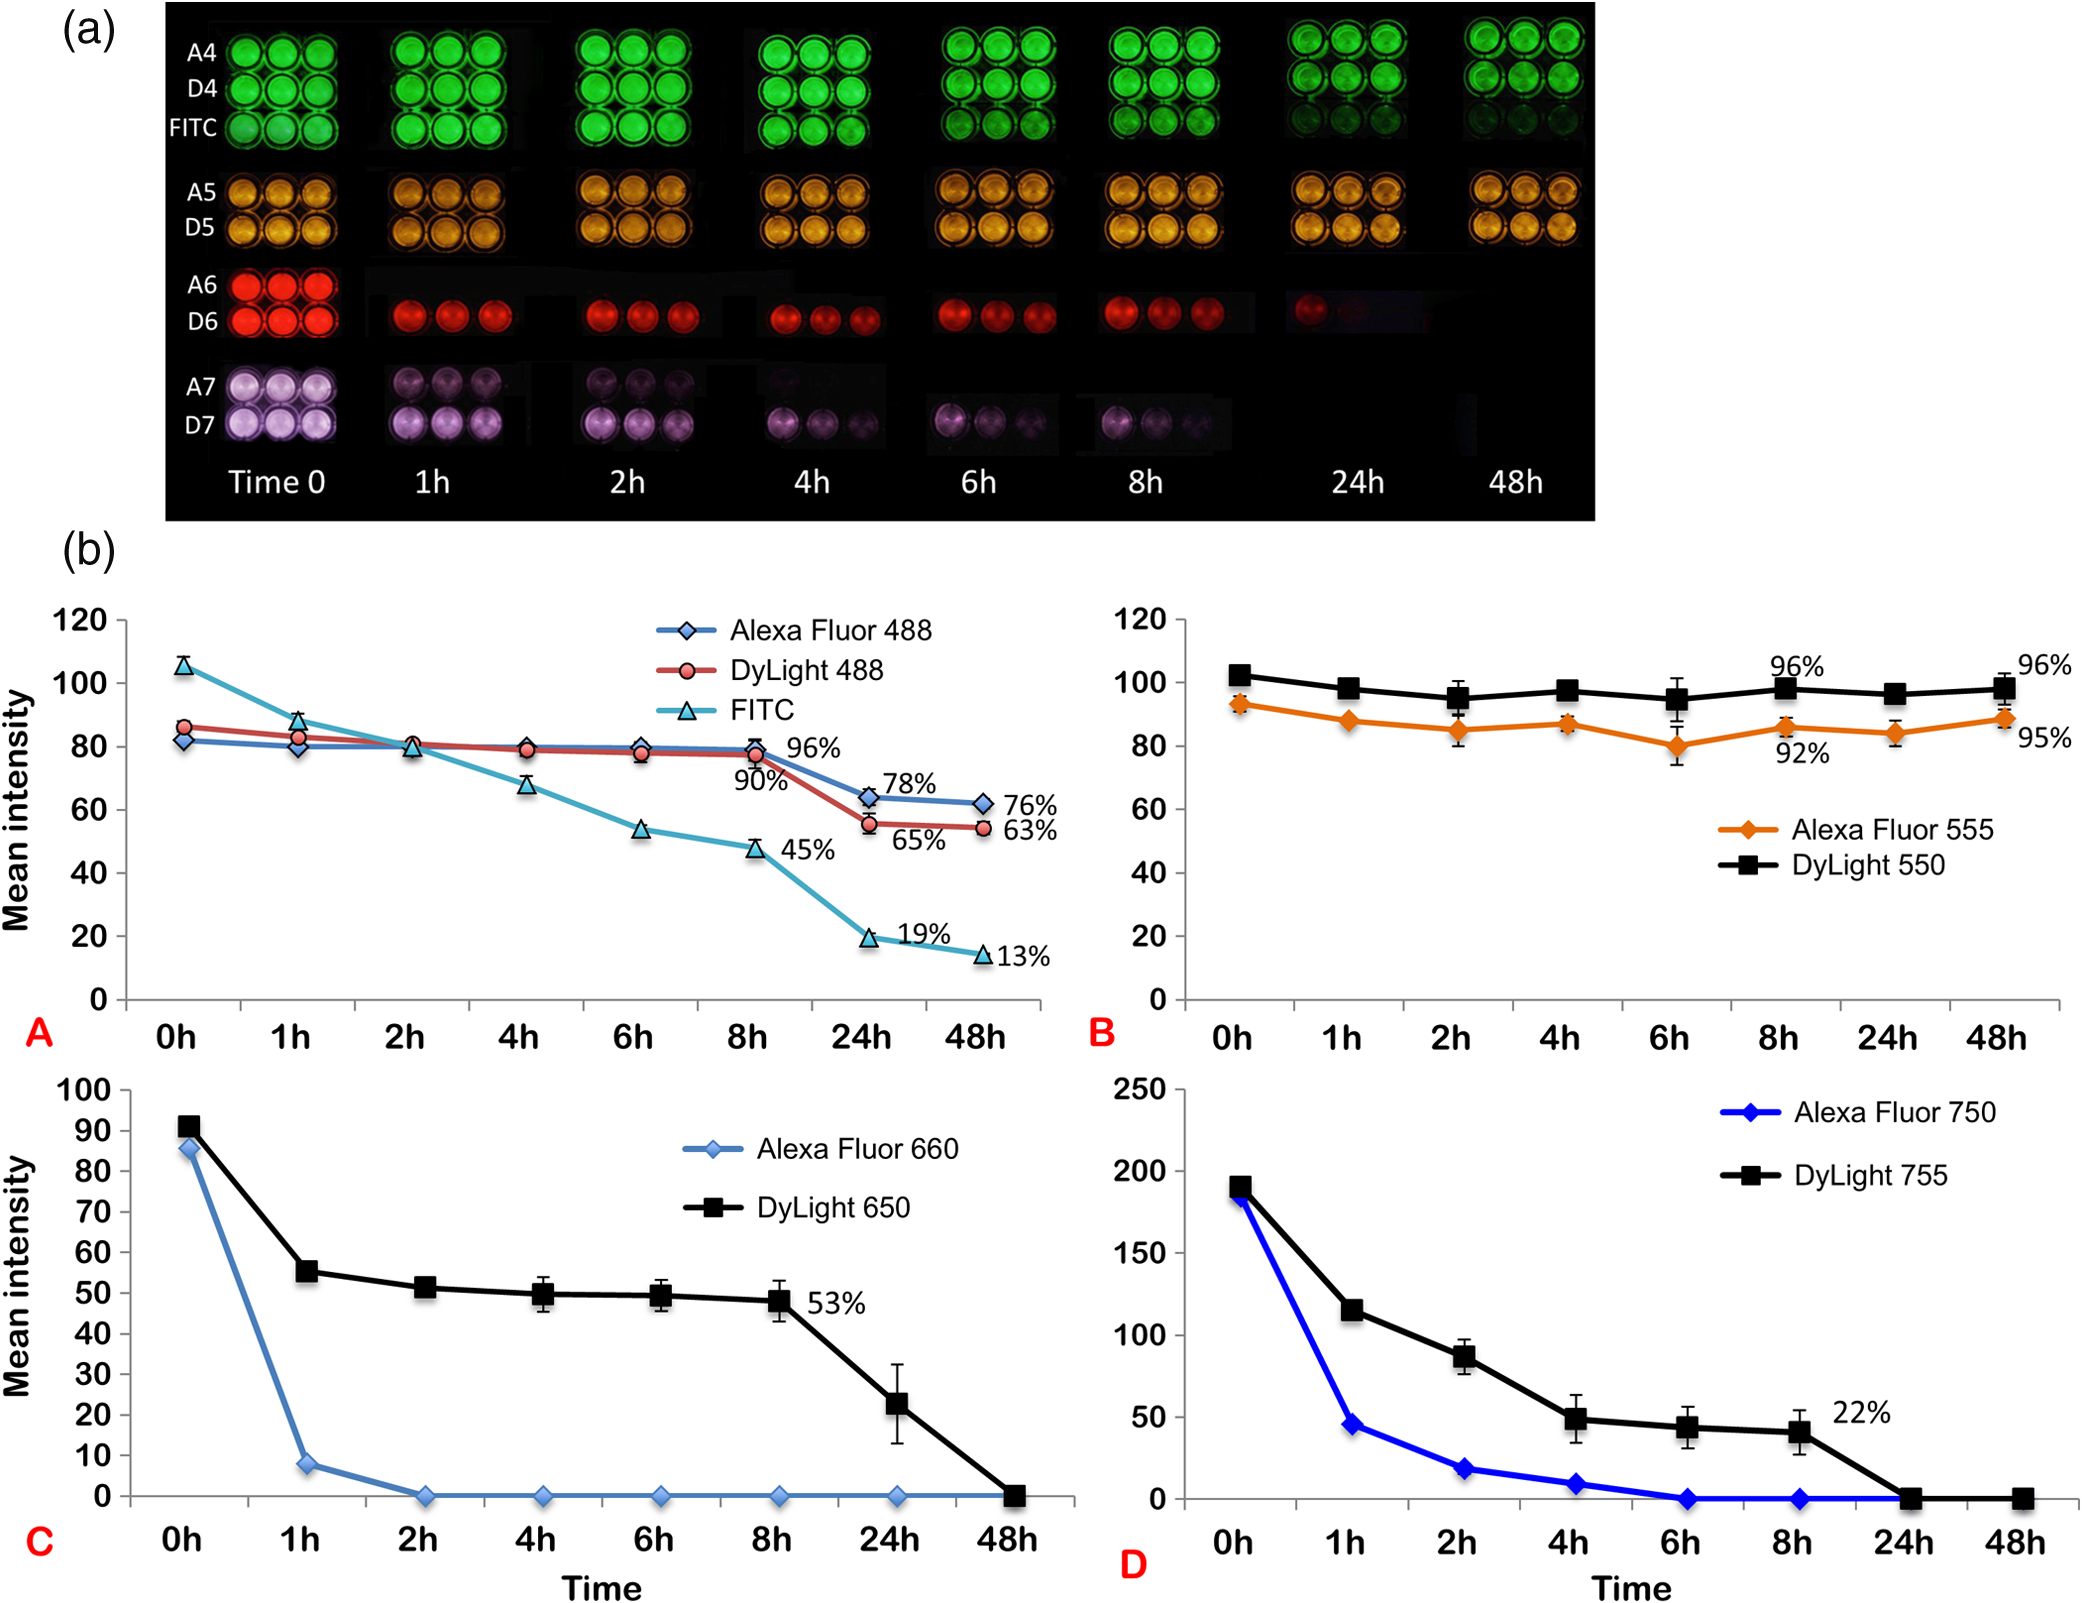
1.IntroductionThe use of fluorescence imaging has become widespread in mouse models of cancer and has begun to make an impact in the clinical care of patients.1,2 Fluorescently tagged tissues of interest allow for easy detection and demarcation from other structures in both living and fixed tissues. In living tissue, this allows for differential imaging of cells or molecules without disrupting other biological processes and also for real-time imaging.1 Fluorescence-guided surgery (FGS) using a variety of techniques has been evaluated in mouse models and humans and been shown to facilitate evaluation of critical structures and resection of tumors.3–11 In an effort to bring FGS to the clinic, we have performed FGS in orthotopic mouse models of pancreatic and colon cancers, labeled with tumor-specific monoclonal mouse antibodies conjugated to Alexa Fluor 488, a green fluorophore.12,13 In subsequent studies, minimally invasive fluorescence laparoscopy was used to image orthotopic pancreatic tumors in mice labeled with fluorophore-conjugated monoclonal mouse antibodies to CEA.14,15 However, there remains uncertainty regarding the choice of the appropriate fluorophore for optimal imaging of pancreatic cancer with fluorophore-conjugated antibodies. We hypothesized that there would be a hierarchy in the ability of a set of visible and near-infrared fluorophores, conjugated to a chimeric anti-CEA antibody, to detect pancreatic tumors with respect to depth of imaging, resolution, tumor-to-background ratio (TBR), photobleaching, and hemoglobin quenching. Therefore, the aim of this study was to compare several commercially available fluorophores of different wavelengths, conjugated to a novel clinically relevant chimeric anti-CEA antibody, to determine the optimal dyes for imaging pancreatic cancer growing orthotopically in nude mice. The chimeric anti-CEA antibody used in the present study has a human Fc portion and a mouse Fab portion. As nonhuman proteins, mouse antibodies tend to evoke an immune reaction if administered to humans. The chimerization process involves engineering the replacement of segments of the antibody molecule. Since the chimeric anti-CEA antibody has a human Fc domain, it thereby eliminates most of the potentially immunogenic portions of the antibody, without altering its specificity for the intended target. The present studies were performed in an orthotopic model of pancreatic cancer and included the determination of the dyes’ ability to penetrate skin, peritoneum, and liver. These are all clinically relevant concerns when considering the appropriate choice of fluorophore for tumor detection. 2.Materials and Methods2.1.Cell CultureThe human pancreatic cancer cell-line BxPC-3 was maintained in RPMI-1640 medium supplemented with 10% fetal bovine serum and 2-mM glutamine from Gibco-BRL, Life Technologies, Inc. (Grand Island, New York). All cells were cultured at 37°C in a 5% incubator. 2.2.Surgical Orthotopic ImplantationAfter confluence, BxPC-3 human pancreatic cancer cells () were injected subcutaneously into the flanks of nude mice until tumors grew between 10 and 20 mm in diameter. The tumor was harvested, and tumor fragments were implanted orthotopically in nude mice, as previously described by our laboratory.16–19 2.3.Antibody-Dye ConjugationChimeric anti-CEA antibody (Aragen Biosciences, Morgan Hill, California) was conjugated with Alexa Fluor dyes (Life Technologies, Inc.) or DyLight dyes (Thermo Fisher Scientific, Rockford, Illinois) (Table 1) per manufacturer specifications, ensuring a minimum of at least dye:protein ratio. Protein:dye concentrations were confirmed using a NanoDrop Spectrophotometer (Thermo Fisher Scientific, Waltham, Massachusetts). 2.4.Animal CareAthymic nu/nu nude mice (AntiCancer, Inc., San Diego, California), between 4 and 6 weeks of age, were maintained in a barrier facility at AntiCancer, Inc., on high-efficiency particulate air-filtered racks. The animals were fed with autoclaved laboratory rodent diet (Teckland LM-485; Western Research Products, Orange, California). All surgical procedures and imaging were performed with the animals anesthetized by intramuscular injection of 0.02 mL of a solution of 50% ketamine, 38% xylazine, and 12% acepromazine maleate. When inhalational anesthesia was required, 99% isoflurane and 100% oxygen were delivered via a vaporizer. All animal studies were conducted in accordance with the principles and procedures outlined in the NIH Guide for the Care and Use of Animals under PHS licence number A3873-1. 2.5.Experimental ProtocolAfter surgical orthotopic implantation of the human pancreatic cancer cell-line BxPC-3, tumors were allowed to grow for 7 days, after which the mice were injected with the antibody-dye conjugate into the retro-orbital vein (Fig. 1). Antibody amounts were maintained between 50 and 75 μg, while ensuring 1.25-μmol dye was delivered with each injection. Whole body imaging was subsequently performed using the OV100 Small Animal Imaging System (Olympus, Tokyo, Japan) after 24 h. If tumors were detectable on whole body imaging, the animal was sacrificed, and tumor characteristics including size, fluorescence intensity, weight, and depth were determined. For mice that did not demonstrate tumors on initial imaging, the tumors were allowed to grow for another 7 days, and the process repeated until the tumor was visible, at which point mice were sacrificed and tumors analyzed as above. 2.6.Tissue PenetrationPrelabeled tumor fragments, with either Alexa Fluor or DyLight dye–antibody conjugate, were cut into fragments of 0.5, 1, and 2 mm. Three fragments of each size were then placed on a petri dish and imaged. After confirming fluorescence labeling, the fragments were covered with a layer of skin obtained from a nude mouse and imaged to evaluate skin penetration. The tumor and peritoneum were then covered with the abdominal wall obtained from a nude mouse and subsequently imaged to evaluate for penetration through the skin and the abdominal wall. 2.7.PhotobleachingThe 488, 550, 650, and the 755 groups of dye conjugates were titrated to equal fluorescence intensity in three consecutive wells on a 64-well plate. Each well plate contained 200 μL. The conjugates were then continuously exposed to a 60-W halogen light bulb to mimic operating room settings for up to 48 h. For the 488 group, fluorescein was also added as a control. The dye conjugates were imaged at the 1-, 2-, 4-, 6-, 8-, 24- and 48-h time points and intensities were recorded. 2.8.Hemoglobin QuenchingDyLight 488, 550, 650, and 755 dye conjugates were titrated to approximately equal fluorescence intensity on three consecutive wells on a 64-well plate. Each well contained 200 μL. Then 15 μL mouse whole blood was then sequentially added to each well, after which the wells were imaged and the fluorescence was recorded. Tumor fragments, prelabeled with each of the dyes, were then covered with a liver fragment, modeled to simulate penetration through a hemoglobin-dense organ. Imaging was performed with the OV100 to assess for penetration through the liver tissue. 2.9.Animal ImagingMice were imaged using the OV100, containing an MT-20 light source (Olympus Biosystems, Planegg, Germany) and DP70 CCD camera (Olympus Corp.). The OV100 was used due to its unique ability to accomplish high-fidelity fluorescence imaging with variable magnification capabilities that allow for imaging of not only the whole animal, but also the subcellular level.20 The instrument incorporates a unique combination of high numerical aperture and long working distance. Four individually optimized objective lenses, parcentered and parfocal, provide a 105-fold magnification range for seamless imaging of the entire body down to the subcellular level without disturbing the animal. In addition, openings on the machine allow for delivery of inhalational anesthesia to the animal without allowing entry of outside light. This allows for capturing high-quality in vivo images with minimal morbidity to the animal by avoiding anesthetic injections. All images were analyzed using Image-J (National Institutes of Health, Bethesda, Maryland) and were processed with the use of Photoshop elements-11 (Adobe Systems Inc., San Jose, California). 2.10.Frozen Section AnalysisTwenty-four hours after injection of 1.25 μmol of anti-CEA conjugated to DyLight 650, the orthotopic tumor was harvested. The tumor was placed in OCT compound and subsequently dipped into liquid nitrogen. Once the tumor was frozen, it was placed on a microtome, sliced into 5-μm sections, placed on a glass slide, and immediately dipped in 95% ethanol for fixation. Alternate slides were stained with hematoxylin & eosin (H&E) or 4′,6-diamidino-2-phenylindole for fluorescence imaging. Fluorescence and bright-field microscopy were performed with the Biorevo BZ-9000 microscope (Keyence Corp., Itasca, Illinois). 2.11.Statistical AnalysisAll statistical analyses were performed using SPSS software version 21 (IBM, Armonk, New York). For pairwise comparisons between groups within the wavelengths, quantitative variables were compared with the Student’s t-test and confirmed with the Wilcoxon rank-sum test. A -value of was considered significant. The 95% confidence intervals obtained on analysis of the data were configured into all the error bars of the appropriate figures and graphs. Multiple groups () were initially compared with one-way analysis of variance (ANOVA), and if a difference was found, pairs of interest were further compared with the Student’s t-test. For tumor size versus intensity modeling, the following values were obtained when a quadratic function plot was used for regression analysis: DyLight 488: 0.32; DyLight 550: 0.34; DyLight 650: 0.26; and DyLight 755: 0.41. 3.Results3.1.Fluorescence Intensity of Dye-Antibody ConjugatesMice with orthotopic BxPC-3 pancreatic cancers were treated with various anti-CEA antibody-dye conjugates and then imaged 24 h later with the OV100 (Fig. 1). Within the 550 and 750 group of dyes, the DyLight dyes were brighter than the corresponding Alexa Fluor dyes (). Alexa Fluor 488 was significantly brighter than DyLight 488 (). There was no significant difference in the 650 group of dyes (). The brightest dye was DyLight 755 (Fig. 2), which was significantly brighter than the next brightest dye, Alexa Fluor 488 (). There was no significant difference on ANOVA analysis between Alexa Fluor 488, DyLight 650, and Alexa Fluor 600 with . DyLight 650 was, however, significantly brighter than Alexa Fluor 750 with . No significant difference was noted between Alexa Fluor 750 and DyLight 488 with , although Alexa Fluor 750 was significantly brighter than DyLight 550 (). DyLight 550 had no significant difference when compared with DyLight 488 () but was significantly brighter than Alexa Fluor 555 with . A summary of the intensities is provided in Fig. 3. Fig. 2Representative images of each dye used in imaging studies. (a) Alexa Fluor 488 is significantly brighter than DyLight 488 (). (b) DyLight 550 is significantly brighter than Alexa Fluor 555 (). (c) Although DyLight 650 appeared brighter, no significant difference was noted between Alexa Fluor 660 and DyLight 650 (). (d) DyLight 755 is significantly brighter than Alexa Fluor 750 (). Note the decreasing ability to discern the background with increasing wavelength (a–d).  Fig. 3DyLight 755 was significantly brighter than Alexa Fluor 488 (). There was no significant difference with ANOVA between Alexa Fluor 488, DyLight 650, and Alexa Fluor 600 (). DyLight 650 was significantly brighter than Alexa Fluor 750 (). There was no significant difference between Alexa Fluor 750 and DyLight 488 (). Alexa Fluor 750 was significantly brighter than DyLight 550 (). There was no significant difference between DyLight 550 and 488 (), which were significantly brighter than Alexa Fluor 555 (), which had the lowest overall intensity. 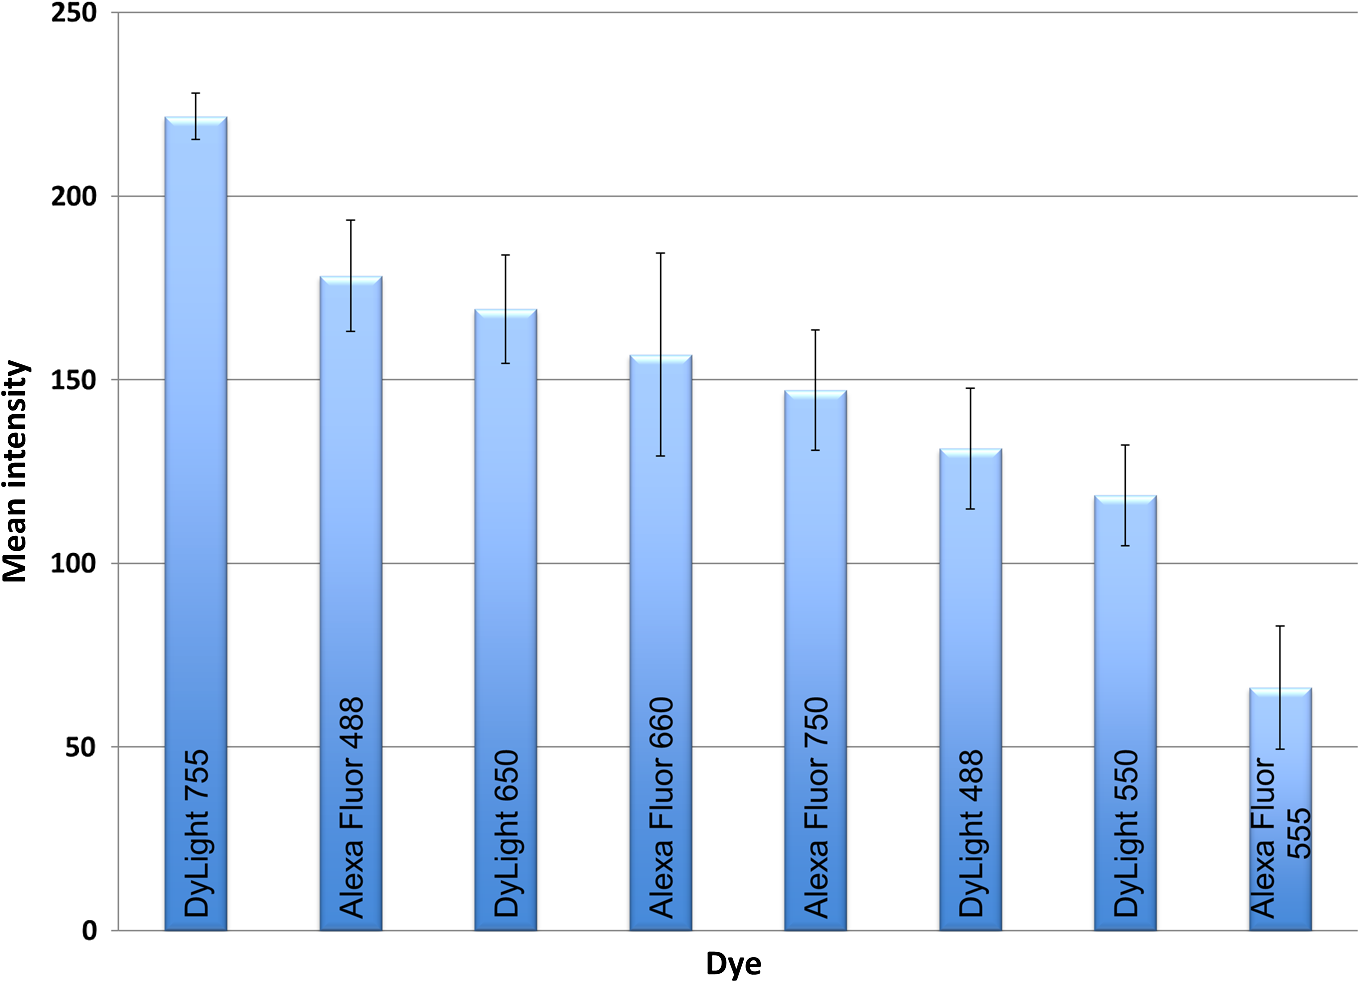 3.2.Tumor-to-Background RatioThe 750 and 650 group of dyes had the highest TBRs (Fig. 4) with DyLight 755 showing the highest ratio of the other dyes (). ANOVA analysis showed no significant difference between the TBRs of DyLight 650, Alexa Fluor 650, and Alexa Fluor 750, all of which were significantly higher than the dye with the next highest ratio DyLight 550 (). The TBR of DyLight 550 was significantly higher than that of Alexa Fluor 555 (). No significant difference was noted between the Alexa Fluor 555 and 488 pair () and between the Alexa Fluor 488 and DyLight 488 pair (). Alexa Fluor 555 had a TBR that was significantly higher than DyLight 488 () Fig. 4DyLight 755 had a significantly higher tumor-to-background ratio (TBR) compared with all the other dyes (). There was no significant difference between DyLight 650, Alexa Fluor 650, and Alexa Fluor 750 with ANOVA. DyLight 550 was significantly higher than Alexa Fluor 555 (). There was no significant difference between Alexa Fluor 555 and 488 () and between Alexa Fluor 488 and DyLight 488 (). Alexa Fluor 555 was significantly higher than DyLight 488 ().  The longer-wavelength dyes had the most contrast between tumor and background. The most background autofluorescence was noted with the 488 group, allowing for near complete visualization of the background, while little to no background was discernible with the 650 and 750 groups. 3.3.Tumor Depth and SizeThe ability to detect the smallest and the deepest tumors consistently increased with longer wavelengths [Figs. 5(a) and 5(b)]. The longer wavelength dyes (650 and 750 nm) had the best tissue penetration with the ability to visualize the smallest tumors. In general, DyLight was able to detect smaller and deeper tumors better than Alexa Fluor within each group, except for the 488 group. There was no significant difference in the ability to detect deeper tumors within the 750 and 550 groups ( and 0.2, respectively). There was a significant difference, however, within the 650 and 488 groups. DyLight 650 could detect deeper tumors better than Alexa Fluor 660 (). Alexa Fluor 488 could detect deeper tumors better than DyLight 488 (). Between groups, DyLight 755 could be detected significantly deeper than DyLight 650 () and DyLight 650 could be detected significantly deeper than DyLight 550 (). No significant difference was observed between DyLight 550 and Alexa Fluor 488 (). Fig. 5(a) White bars represent the smallest detectable tumor size, and colored bars represent tumor depths. In analyzing the tumor depths, within groups, there was no significant difference between DyLight 755 and Alexa Fluor 750 () and between DyLight 550 and Alexa Fluor 555 (). DyLight 650 enabled significantly deeper imaging than Alexa Fluor 660 (), and Alexa Fluor 488 enabled significantly deeper imaging than DyLight 488 (). Between groups, DyLight 755 enabled significantly deeper imaging than DyLight 650 (), and DyLight 650 enabled significantly deeper imaging than DyLight 550 (). There was no significant difference between DyLight 550 and Alexa Fluor 488 (). With respect to tumor size, within groups, DyLight 755 detected significantly smaller tumors than Alexa Fluor 750 (); DyLight 550 detected significantly smaller tumors than Alexa Fluor 555 (), and Alexa Fluor 488 detected significantly smaller tumors than DyLight 488 (). No significant difference within the 650 group was observed (). Between groups, there were significant differences, except between DyLight 550 and 650 (). DyLight 755 detected significantly smaller tumors than DyLight 650 (), and DyLight 550 detected significantly smaller tumors than Alexa Fluor 488 (). (b) Depiction of the relationship between tumor size, depth, and dye wavelength. With an increase in wavelength, there was an increase in the ability to detect deeper and smaller tumors.  Similarly, smaller tumors were detected at longer wavelength with DyLight dyes better than Alexa Fluor dyes, except for the 488 group. Differences within the groups were all significant except for the 650 group (). Within the 750 and 550 groups, DyLight conjugates detected significantly smaller tumors ( and 0.01, respectively). In the 488 group, Alexa Fluor 488 was able to detect significantly smaller tumors (). Between groups, there were significant differences, except between DyLight 550 and 650 (). DyLight 755 was able to detect significantly smaller tumors than DyLight 650 (), and DyLight 550 was able to detect significantly smaller tumors than Alexa Fluor 488 (). Prelabeled tumor fragments of 0.5, 1, and were imaged, and subsequently a layer of skin and body wall was placed over the fragments. Repeated imaging verified better tissue penetration with the longer wavelength dyes (Fig. 6). With addition of the tissue layers, the smallest of the DyLight 650 and 755 labeled fragments were still visible on imaging but were invisible in the 550 and 488 groups. Within all groups, the DyLight-labeled fragments were visible at greater depths in comparison to the Alexa Fluor dyes. This held true for all the groups except for the 488 group, where there was better tumor visualization with the Alexa Fluor 488-labeled tumor fragments. 3.4.Tumor Size and Fluorescence IntensityIn assessing for a correlation between tumor size and fluorescence intensity with a constant dose of antibody-dye conjugate, the fluorescence intensity of all the DyLight dye labeled tumors and the corresponding tumor sizes were measured. In the analysis, the fluorescence intensity was set as the dependent variable and the tumor sizes as an independent variable, thus creating a model for prediction of the expected intensity given a certain tumor size (Fig. 7). Small tumors appeared to have a lower signal intensity, which would then increase to a maximum for an “optimum” tumor size and would again begin to decrease with increasing tumor size. The longer wavelength dyes were not only the brightest, but also maintained their signal intensity over a broader range of tumor sizes when compared with the shorter-wavelength dyes. 3.5.PhotobleachingPhotobleaching was assessed with a 60-W halogen light continuously shone on antibody-dye conjugates for a period of up to 48 h, with serial imaging and analysis of fluorescence intensity. Overall, the DyLight dyes were more photostable than the Alexa Fluor dyes [Figs. 8(a) and 8(b)]. The time point of eight hours was used as a reference point for evaluation, as this would encompass even the lengthiest of most pancreatico-duodenectomies and other oncologic surgeries. At the 8-h time point, there was no significant difference in the percentage of the original intensity in the 488 () and 550 () groups. Alexa Fluor 488 and DyLight 488 retained 96% and 90% of their original intensity, respectively. Both Alex Fluor 488 and DyLight 488 were significantly brighter than FITC, which retained only 45% of its original intensity ( and 0.002, respectively). The 550 group of dyes was the most photostable, retaining approximately 95% of their original intensity for up to 48 h. With the longer-wavelength dyes, however, there was a significant difference between groups. Alexa Fluor 660 lost all of its fluorescence in 1 h. In contrast, by 8 h, DyLight 650 still had 53% of its original fluorescence (). Similarly, in the 750 group, there was a more rapid decline in the fluorescence intensity of Alexa Fluor 750, and by 8-h, Alexa Fluor 750 had no discernible fluorescence DyLight 755 retained 22% of its original fluorescence intensity at 8 h. Overall, DyLight dyes were more photostable than Alexa Fluor. 3.6.Hemoglobin QuenchingWith the assessment of hemoglobin quenching, a significant difference was noted between the longer and shorter wavelength dyes. Wavelengths of 550 nm or less showed significant quenching of the fluorescence signal upon addition of whole blood. Dyes at 650 nm or greater showed resistance to hemoglobin quenching [Figs. 9(a) and 9(b)]. With serial addition of whole blood, both DyLight 488 and 550 had of their original intensity after 100 μL; while DyLight 650 and 755 had 95% and 89% of their original intensity, respectively. In a related experiment, a thin slice of liver tissue was placed over prelabeled fragments of tumor and imaged to evaluate for tissue penetration. Similarly, the 488 and 550 fragments were not discernible after placing the liver tissue overlay, while all three fragments in the 650 and 750 groups were visible, illustrating the difference in tissue penetration between the longer and shorter wavelength dyes. Fig. 9(a) 64-well plate with antibody-dye conjugates. Whole blood was serially added to each well in 15 μL. 488, 550, 650, and 750 correspond to DyLight 488, DyLight 550, DyLight 650, and DyLight 755, respectively. (b) Graphic depiction of hemoglobin quenching. 488, 550, 650, and 750 correspond to DyLight 488, DyLight 550, DyLight 650, and DyLight 755, respectively. DyLight 755 and 650 maintained their fluorescence signal, while DyLight 488 and 550 showed significant hemoglobin quenching.  3.7.Frozen Section Analysis of Surgical MarginsFigure 10 depicts a frozen section of tumor margin prelabeled with an anti-CEA antibody conjugated to DyLight 650 alongside a corresponding H&E-stained slide. The sharp demarcation of tumor versus normal tissue interface on fluorescence imaging allows for more accurate determination of tumor margins. Fig. 10(a) Frozen section of tumor margin prelabeled with an anti-CEA antibody conjugated to DyLight 650. (b) Corresponding H&E-stained slide. Note sharp demarcation of the tumor-normal tissue interface seen with fluorescence imaging (arrows), allowing for more accurate determination of tumor margins.  4.DiscussionWe have predominantly used FGS as a method to reduce tumor recurrence and to prolong survival in mouse models of pancreatic and other cancers labeled with fluorescent antibodies or proteins.8–10,12–15 In this study, we determined the fluorophores that would optimize tumor labeling. The high-fluorescence intensity, lack of anomalous peaks, and high quantum yields of Alexa Fluor and DyLight dyes, compared to dyes with comparable spectra are important features. The findings from this study suggest that DyLight dyes had higher fluorescence intensities and higher TBRs compared with Alexa Fluor dyes, with the exception of the 488 group of dyes. This study demonstrated that tissue penetration and the ability to identify the smallest and the deepest tumors increased with an increase in wavelength. With the longer-wavelength dyes in the 650 and 750 groups, we were able to identify even submillimeter tumors with noninvasive whole-body imaging. Overall, DyLight 755 had the best tissue penetration and the ability to identify the smallest tumors. The 488 group had the poorest ability to penetrate tissue and required fairly large and superficial tumors prior to identification with whole-body imaging. Similarly, DyLight dyes outperformed Alexa Fluor dyes within each group, with the exception of the 488 group, where Alexa Fluor 488 had better tissue penetration and enabled imaging of smaller and deeper tumors compared with DyLight 488. The chemical bond between the chimeric anti-CEA antibody and the fluorophore is a covalent amide bond for both the Alexa Fluor and DyLight dyes. Therefore, it is likely that the difference between dyes observed is due to lower autofluorescence and higher imaging depth with the longer- compared to the shorter- wavelength dye conjugates. The hemoglobin molecule has high levels of absorption in the 400- to 600-nm wavelength range. This raised the question as to whether an emitted fluorescence signal within this range would be significantly quenched. The implications would be significant with respect to FGS, vascular imaging, or imaging of any hemoglobin-rich organ, if this were the case. We were able to demonstrate with our hemoglobin quenching assay that the emission of the 488 and 550 dyes was significantly affected when exposed to whole blood or within the vicinity of a hemoglobin-rich organ, such as the liver. Conversely, the 650- and 750-nm dyes maintained a robust signal with the addition of whole blood and showed good penetration through liver tissue. Photostability is also a very important attribute for any dyes that would be used in surgical procedures, given the likely continuous exposure to white light, or an excitation-specific signal, over multiple hours necessary for the operation. Typically, even the lengthiest of surgical procedures typically lasts less than 8 h.21,22 Both the 488 and 550 dyes were very photostable during this time frame and maintained of the signal at 8 h. With the longer wavelength dyes, the DyLight dyes were significantly more stable than the Alexa Fluor dyes. There was no signal remaining in the longer wavelength Alexa Fluor dyes, while DyLight 650 and 750 maintained 53% and 22% of the fluorescence signal, respectively. In summary, the longer-wavelength dyes had increased depth of penetration and the ability to detect the smallest tumor deposits and provided the highest TBRs, lower autofluorescence, resistance to hemoglobin quenching, and specificity. The shorter-wavelength dyes were more photostable compared with the longer wavelength dyes. These studies were done in an orthotopic model of pancreatic cancer, which mimics the clinical scenario, and also with a novel chimeric anti-CEA antibody that could be used in clinical trials. To our knowledge, this type of study has not been previously reported. This study showed the unique advantages of each dye for specific cancer imaging, which is important information for future clinical applications such as FGS. Table 1Characteristics of fluorescent dyes.
Note: Mw=Molecular weight, ε=extinction coefficient. AcknowledgmentsWork supported in part by grants from the National Cancer Institute CA142669 and CA132971 (to M.B. and AntiCancer, Inc.). ReferencesR. M. Hoffman,
“The multiple uses of fluorescent proteins to visualize cancer in vivo,”
Nat. Rev. Cancer, 5
(10), 796
–806
(2005). http://dx.doi.org/10.1038/nrc1717 NRCAC4 1474-175X Google Scholar
M. BouvetR. M. Hoffman,
“Glowing tumors make for better detection and resection,”
Sci. Transl. Med., 3
(110), 110fs10
(2011). http://dx.doi.org/10.1126/scitranslmed.3003375 STMCBQ 1946-6242 Google Scholar
B. T. Leeet al.,
“The FLARE intraoperative near-infrared fluorescence imaging system: a first-in-human clinical trial in perforator flap breast reconstruction,”
Plast. Reconstr. Surg., 126
(5), 1472
–1481
(2010). http://dx.doi.org/10.1097/PRS.0b013e3181f059c7 PRSUAS 0032-1052 Google Scholar
T. OkudaH. YoshiokaA. Kato,
“Fluorescence-guided surgery for glioblastoma multiforme using high-dose fluorescein sodium with excitation and barrier filters,”
J. Clin. Neurosci., 19
(12), 1719
–1722
(2012). http://dx.doi.org/10.1016/j.jocn.2011.12.034 JCNUE6 0967-5868 Google Scholar
G. Spinoglioet al.,
“Real-time near-infrared (NIR) fluorescent cholangiography in single-site robotic cholecystectomy (SSRC): a single-institutional prospective study,”
Surg. Endosc., 27
(6), 2156
–2162
(2013). http://dx.doi.org/10.1007/s00464-012-2733-2 SUREEX 1432-2218 Google Scholar
G. M. van Damet al.,
“Intraoperative tumor-specific fluorescence imaging in ovarian cancer by folate receptor-alpha targeting: first in-human results,”
Nat. Med., 17
(10), 1315
–1319
(2011). http://dx.doi.org/10.1038/nm.2472 1078-8956 Google Scholar
F. P. Verbeeket al.,
“Intraoperative near infrared fluorescence guided identification of the ureters using low dose methylene blue: a first in human experience,”
J. Urol., 190
(2), 574
–579
(2013). http://dx.doi.org/10.1016/j.juro.2013.02.3187 JOURDD 0248-0018 Google Scholar
C. A. Metildiet al.,
“Fluorescence-guided surgery allows for more complete resection of pancreatic cancer, resulting in longer disease-free survival compared with standard surgery in orthotopic mouse models,”
J. Am. Coll. Surg., 215
(1), 126
–136
(2012). http://dx.doi.org/10.1016/j.jamcollsurg.2012.02.021 JACSEX 1072-7515 Google Scholar
C. A. MetildiR. M. HoffmanM. Bouvet,
“Fluorescence-guided surgery and fluorescence laparoscopy for gastrointestinal cancers in clinically-relevant mouse models,”
Gastroenterol. Res. Pract., 2013 290634
(2013). http://dx.doi.org/10.1155/2013/290634 1687-6121 Google Scholar
C. A. Metildiet al.,
“Fluorescence-guided surgery of human colon cancer increases complete resection resulting in cures in an orthotopic nude mouse model,”
J. Surg. Res., 179
(1), 87
–93
(2013). http://dx.doi.org/10.1016/j.jss.2012.08.052 JSGRA2 0022-4804 Google Scholar
H. Kishimotoet al.,
“In vivo internal tumor illumination by telomerase-dependent adenoviral GFP for precise surgical navigation,”
Proc. Natl. Acad. Sci. U. S. A., 106
(34), 14514
–14517
(2009). http://dx.doi.org/10.1073/pnas.0906388106 PNASA6 0027-8424 Google Scholar
S. Kaushalet al.,
“Fluorophore-conjugated anti-CEA antibody for the intraoperative imaging of pancreatic and colorectal cancer,”
J. Gastrointest. Surg., 12
(11), 1938
–1950
(2008). http://dx.doi.org/10.1007/s11605-008-0581-0 1091-255X Google Scholar
M. McElroyet al.,
“Imaging of primary and metastatic pancreatic cancer using a fluorophore-conjugated anti-CA19-9 antibody for surgical navigation,”
World J. Surg., 32
(6), 1057
–1066
(2008). http://dx.doi.org/10.1007/s00268-007-9452-1 WJSUDI 0364-2313 Google Scholar
C. A. Metildiet al.,
“An LED light source and novel fluorophore combinations improve fluorescence laparoscopic detection of metastatic pancreatic cancer in orthotopic mouse models,”
J. Am. Coll. Surg., 214
(6), 997
–1007
(2012). http://dx.doi.org/10.1016/j.jamcollsurg.2012.02.009 JACSEX 1072-7515 Google Scholar
H. S. Tran Caoet al.,
“Tumor-specific fluorescence antibody imaging enables accurate staging laparoscopy in an orthotopic model of pancreatic cancer,”
Hepatogastroenterology, 59
(118), 1994
–1999
(2012). http://dx.doi.org/10.5754/hge11836 0172-6390 Google Scholar
M. Bouvetet al.,
“Real-time optical imaging of primary tumor growth and multiple metastatic events in a pancreatic cancer orthotopic model,”
Cancer Res., 62
(5), 1534
–1540
(2002). CNREA8 0008-5472 Google Scholar
M. Bouvetet al.,
“Chronologically-specific metastatic targeting of human pancreatic tumors in orthotopic models,”
Clin. Exp. Metastasis, 18
(3), 213
–218
(2000). http://dx.doi.org/10.1023/A:1006767405609 CEXMD2 0262-0898 Google Scholar
X. FuF. GuadagniR. M. Hoffman,
“A metastatic nude-mouse model of human pancreatic cancer constructed orthotopically with histologically intact patient specimens,”
Proc. Natl. Acad. Sci. U. S. A., 89
(12), 5645
–5649
(1992). http://dx.doi.org/10.1073/pnas.89.12.5645 PNASA6 0027-8424 Google Scholar
T. Furukawaet al.,
“A novel “patient-like” treatment model of human pancreatic cancer constructed using orthotopic transplantation of histologically intact human tumor tissue in nude mice,”
Cancer Res., 53
(13), 3070
–3072
(1993). CNREA8 0008-5472 Google Scholar
K. Yamauchiet al.,
“Development of real-time subcellular dynamic multicolor imaging of cancer-cell trafficking in live mice with a variable-magnification whole-mouse imaging system,”
Cancer Res., 66
(8), 4208
–4214
(2006). http://dx.doi.org/10.1158/0008-5472.CAN-05-3927 CNREA8 0008-5472 Google Scholar
M. K. Dieneret al.,
“A systematic review and meta-analysis of pylorus-preserving versus classical pancreaticoduodenectomy for surgical treatment of periampullary and pancreatic carcinoma,”
Ann. Surg., 245
(2), 187
–200
(2007). http://dx.doi.org/10.1097/01.sla.0000242711.74502.a9 ANSUA5 0003-4932 Google Scholar
K. T. Tranet al.,
“Pylorus preserving pancreaticoduodenectomy versus standard Whipple procedure: a prospective, randomized, multicenter analysis of 170 patients with pancreatic and periampullary tumors,”
Ann. Surg., 240
(5), 738
–745
(2004). http://dx.doi.org/10.1097/01.sla.0000143248.71964.29 ANSUA5 0003-4932 Google Scholar
|