
|
|
1.IntroductionThe brain contains a high amount of lipids that are subdivided into a large variety of classes (such as phospholipids, sphingolipids, glycosphingolipids, and cholesterol), and play an important role in neuronal functions.1 For example, cholesterol, phospholipids, and galactolipids are the main constituents of myelin, the insulating substance that covers the axons and enables saltatory conduction.2 Several pathological states (such as tumors,3–6 sclerosis,2,7 Alzheimer,7 and injury8) are characterized by an alteration in quantity and/or quality of lipids. Coherent anti-Stokes Raman scattering (CARS) microscopy is an ideal technique to visualize brain structures by addressing the distribution of lipids. CARS is a nonlinear variant of Raman spectroscopy based on the resonant excitation of a molecular vibration using ultrashort pulsed lasers.9 CARS imaging is performed by tuning the system on the Raman band at , which is produced by the symmetric stretching vibration of bonds in functional groups. Therefore, CARS is an emerging technique to probe the contributions of lipids,10–13 enabling label-free imaging of brain,14–16 and nervous structures17,18 for the physiological or pathological studies. CARS microscopy was largely applied in vivo and to native nervous tissue,17,19–21 but it is also emerging as a method for label-free histopathology, applied on histology preparations (e.g., tissue sections 22–24 and smears25). Fixation is a standard procedure in histopathology preparation, necessary to preserve the tissue from autolysis and putrefaction.26 During fixation, the tissue components are stabilized and made insoluble, the proteolytic enzymes are inactivated and bacteria are killed. The aim of fixation is to preserve the morphological and biochemical characteristics of the tissue, so that it can be further processed with the histological or immunohistochemical staining. The effects of fixation on histology and immunohistochemistry are well studied,27 but are of limited use for the CARS imaging. As CARS directly probes the chemical composition of the tissue, the effects of all preparation procedures that might remove endogenous compounds or add exogenous compounds have to be verified. The native tissue composition can be retrieved from unfixed cryosections, but they have drawbacks. They can be stored for only a limited period of time and the natural decay of tissue starts immediately after thawing. In other cases, the tissue from the pathology is already fixed in bulk as part of the standard preparation procedures. Therefore, it is important to know how the fixation procedures may alter the CARS signal intensity, modify the CARS image contrast of tissue structures with different compositions, and finally, choose the method that less affects the CARS image. Although some research was performed to study the effects of tissue preparation on the vibrational spectroscopy of brain,28,29 as well as of other organs30–34 and cells,35 no specific studies were performed to our knowledge about the consequences of fixation on the CARS images. Here, we analyze the effects of two different methods of fixation for the brain tissue, namely with formalin and methanol–acetone, on the contrast and intensity of the CARS images, and interpret the results with Raman microspectroscopy. An incubation in aqueous solution of formaldehyde (known as formalin) is a common chemical method for fixation of bulk samples as well as of cryosections. It acts by creating covalent bonds between the proteins in the tissue36 and fixation is achieved through cross-linking of amines, amides, aromatic rings, hydroxyls, guanidine, sulfhydryl groups, and reactive hydrogen atoms.37 Another fixation method often used for thin brain cryosections is performed by incubation in a solution of methanol and acetone at . It reduces the solubility of proteins, which precipitate and aggregate.26 Monohydric alcohols, such as methanol, denature the proteins by breaking the protein tertiary structure and stabilizing the secondary structures.38 2.Methods2.1.Sample PreparationAdult female nude mice were used (Experimental Center of the University Hospital, Dresden, Germany). The animal experiment was conducted in accordance with the guidelines of the Technical University in Dresden—Germany based on the national laws and are in full agreement with the European Union directives (Regierungspräsidium, Dresden, Germany, AZ: 24-9168.11-1/2011-39). For the normal brain tissue harvesting, the animals were euthanized and the brain was removed. The experimental tumor was induced by stereotactic implantation of human nonmelanotic melanoma cells (A375 cell line) into the brain parenchyma. The culture and preparation of tumor cells were performed as described earlier.39 The mice were anesthetized and after the scalp incision, the skull was opened. Tumor cells () were injected using a stereotactic device. The incision was sutured and the tumor was allowed to continue growing. After three weeks, the tumor-bearing brain was harvested. For the production of cryosections, the brains were embedded in tissue freezing medium and frozen on dry ice. The blocks were stored at . Subsequently, consecutive cryosections were prepared on slides or on glass. Human brain tumor biopsies were obtained during routine tumor surgery. The patient gave written consent and the study was approved by the ethics committee at Dresden University Hospital (EK 323122008). Cryosections were produced as described above. Tissue cryosections were left unfixed, fixed in 4% paraformaldehyde (PFA) in phosphate-buffered saline (PBS) for 45 min, or fixed in a solution of methanol and acetone at for 10 min. Bulk tissue samples were fixed in formalin with an incubation of 20 h. After CARS imaging and Raman spectroscopy, standard hematoxylin and eosin (H&E) histology were done. 2.2.CARS Microscopy and Image AnalysisLaser excitation was provided by two picoseconds Erbium fiber sources. The laser producing the pump beam (Femto Fiber pro NIR from Toptica Photonics AG, Munich, Germany) emits at 781 nm and has a pulse duration of 1.2 ps. The Stokes source used to excite the CARS signal (Femto Fiber pro TNIR, also from Toptica Photonics AG) has a pulse duration of 0.8 ps and was set to 1005 nm, in order to probe the vibration at . Both lasers have a repetition rate of 40 MHz. The multiphoton microscope is an Axio Examiner Z.1 coupled to a scanning module LSM 7 (all from Carl Zeiss AG, Jena, Germany) and equipped with the photomultipliers in nondescanned detection configuration. The excitation light was focused with a C-Apochromat numerical aperture (NA) objective. The laser power in the sample was 51 mW at 781 nm and 0.6 mW at 1005 nm. For imaging of cryosections, the CARS signal was collected in the forward direction and filtered by the use of a band-pass filter centered on 647 nm with a bandwidth of 57 nm. For imaging of bulk samples, the CARS signal was acquired in the backward direction using the same filter. A tiling procedure was used for the acquisition of images larger than the microscope objective field of view. The CARS images were displayed as 8-bit images. The analysis of the CARS signal intensity was performed in the software Fiji,40 by manually selecting the regions of interest in white and gray matter areas. Nonresonant images were acquired at by tuning the Stokes laser at 980 nm. The intensities of the resonant and nonresonant images were related to each other by probing a completely nonresonant target (a glass coverslip) as described in Ref. 41. This procedure allowed correcting for different laser power and detection efficiency by multiplying the nonresonant images by a calibration factor equal to the ratio between the resonant and nonresonant glass images. Image calibration was performed with MATLAB (MathWorks Inc., Natick, MA, USA). 2.3.Raman MicrospectroscopySpectra were obtained using Raman spectrometer (RamanRxn1™, Kaiser Optical Systems Inc., Ann Arbor, MI, USA) coupled to a light microscope (DM2500 P, Leica Microsystems GmbH, Wetzlar, Germany). The Raman scattering was excited using a diode laser emitting at a wavelength of 785 nm, propagated to the microscope with a 100 μm optical fiber, and focused on the samples by means of a microscope objective, leading to a focal spot of about 20 μm. The Raman signal was collected in the reflection configuration and sent to the holographic spectrograph by using a 62.5 μm core optical fiber. Spectral maps with the step size of 20 μm were collected on selected areas. For each position, two spectra were recorded with 1 s of accumulation time and averaged. The spectra were collected in the spectral region 150 to with a resolution of . MATLAB packages were used for the processing of spectra. A variable baseline was calculated for each spectrum by applying the function “msbackadj.” The baseline was estimated within the multiple windows wide, shifted with steps, and a linear interpolation method was chosen. Subsequent normalization of the set of spectra was obtained by standardizing the area under the spectra to the group median value by using the function “msnorm.” Both functions are contained in the Bioinformatics Toolbox. Further normalization of average spectra representative of the different samples was done on the intensity of the phenylalanine band at . The intensity of the Raman band (which supplies an indication of the tissue lipid content) was calculated as an integral in the range 2835 to . This bandwidth is representative of the one excited in the CARS experiments. 3.Results and DiscussionIn order to verify the effect of tissue fixation on the CARS image contrast and quality, consecutive cryosections of mouse brain (i) without any fixation, (ii) fixed with methanol–acetone, and (iii) fixed in 4% PFA were imaged with the CARS system tuned on the Raman band at . Image acquisition was performed using the same parameters (laser power, beam focalization, and photomultiplier gain) so that the CARS images could be compared. The CARS images acquired in the brainstem of the unfixed sample are shown in Fig. 1 (left, as indicated) at two different levels of magnification, and matched the structure revealed by H&E staining, which was performed on the very same samples after CARS imaging. The overall structure of the tissue [Fig. 1(a), left] was recognizable: white matter, which is rich in myelin and has high lipid content, appeared brighter in the CARS image, while gray matter, poorer in lipids, appeared darker. After PFA fixation (Fig. 1, middle), the difference in the CARS signal intensity generated by white and gray matters was still clearly visible and the image brightness was not substantially modified. Nevertheless, the magnified image in panel B shows an alteration of tissue micromorphology. The effect of fixation with the methanol–acetone was dramatic (Fig. 1, right). The CARS intensity was strongly decreased within both the white and gray matters and the micromorphology appeared to be also strongly affected. Fig. 1Effects of fixation on the CARS images of mouse brain. (a) CARS images and H&E staining pictures of 20-μm thick consecutive tissue cryosections, unfixed, formalin fixed (4% PFA), and methanol–acetone fixed (Met–Ace). The H&E staining was performed on the very same sections and provides then a precise reference for the tissue morphology to be compared with the CARS images. (b) Zoom-in of the boxes in (a).  The analysis of the CARS signal intensity of white and gray matters confirmed that the difference existing between lipid-rich and lipid-poor structures was affected by fixation. In the unfixed samples, the ratio between CARS intensity in gray and white matters was on the average of 0.51, in the PFA fixed sample 0.49 and in the methanol–acetone fixed 0.79. The effects of fixation on contrast and intensity of the CARS image suggested a profound interaction of methanol–acetone fixation with the tissue lipids. This is consistent with the property of acetone to dissolve lipids. In order to gain a better insight in the biochemical effects of fixations, Raman spectroscopy was used to directly probe the tissue composition. The spectra of maps composed by points covering an area of were acquired on unfixed, formalin, and methanol–acetone fixed cryosections of mouse brain tissue. The Raman measurements were performed in comparable regions in the lateral lobe of the brain (Fig. 2, measurement position A indicated on the H&E staining shown on the right). An area was chosen, where the tissue appeared homogeneous, in order to avoid differences due to the changes in tissue structure and composition throughout the sections investigated. The averages and the standard deviations of the 651 spectra acquired were calculated for each sample and then normalized to the phenylalanine band at (stretching of the bond42); the spectra are shown in Fig. 2(a). The normalization on the intensity of the phenylalanine band was chosen to quantitatively compare the spectra of the different samples because fixation was not reported to alter this band, in contrast to the one of amide. Amide vibrations are influenced by the reaction of methylene glycol, e.g., hydrated formalin, that cross-links the nitrogen atoms of lysine with the nitrogen atom of peptide linkages.30 Fig. 2Raman spectroscopy on unfixed, formalin (4% PFA), and methanol–acetone (Met–Ace) fixed consecutive brain cryosections. (a) Average Raman spectra and standard deviations, displayed in stacked view; the normalization of average spectra was done on the intensity of phenylanine band (indicated by the star). The underlined bands are related to the lipid vibrations and numbered in accordance with Table 1. The inset shows in details the spectra region between 600 and . (b) Difference spectra obtained by subtracting the average spectrum of the unfixed sample from the average spectra of the PFA and methanol–acetone fixed samples. The intensity scale was changed with respect (a) in order to better visualize small variations. (c) Raman maps of unfixed and fixed consecutive cryosections are already shown in Fig. 1. The maps were obtained by plotting the integral intensity of the band in the range 2835 to . All maps are displayed in the same gray scale.  The spectra of fixed samples differed from the one acquired on unfixed tissue. The band intensity changes are resumed in Table 1 and the affected bands are underlined in Figs. 2(a) and 2(b). The changes were found to be stronger in the case of methanol–acetone fixation, which produced a marked decrease of all lipid-related bands. For instance, when the band at is considered, formalin fixation did not appear to alter its intensity, while a strong reduction was caused by the methanol–acetone fixation; this is in agreement with the results of the CARS experiments. Table 1Variations of the intensity for lipid-related Raman bands of fixed samples compared to the unfixed one. ↓↓: decrease to <50%; ↓: decrease from 90% to 50%; –: unchanged (variation in the range ±10%), ↑: increase up to 50%. Band assignment following Refs. 42, 43, and 44.
The Raman bands exclusively attributed to proteins and nucleic acids were generally found to be not affected by fixation, namely: the bands at 621 and [ring deformation of phenylalanine and tyrosine, respectively42—see inset in Fig. 2(a)], the band at (symmetric breathing of tryptophan42), the region around where the vibrations of proteins and nucleic acids are reported,42 and the band at attributed to amide II vibration.42 Contamination with formalin was not evident in the spectra. Formalin contamination was reported31 to generate bands at 907, 1041, 1254, and . In our study, only a weak band could be detected arising at . To further verify the effects of fixation on lipid distribution inside the tissue, Raman mapping was performed on the same regions already imaged by CARS (Fig. 2, measurement position C). In Fig. 2(c), the Raman maps of unfixed and fixed samples obtained by plotting the band intensity in the same gray scale are reported. Although the maps on unfixed and formalin fixed samples were in a similar range of intensity, the one acquired on the methanol–acetone fixed sample was characterized by strongly reduced intensity. These measurements confirmed that fixation with methanol and acetone strongly decreased the content of tissue lipids. When compared to the CARS images in Fig. 1(a), the overall intensities agree quite well, even though they cannot be quantitatively compared because the intensity of the Raman bands has a linear dependence to the number of scattering centers, while CARS has a quadratic dependence and a contribution from the nonresonant background.9 The ability of CARS microscopy to assess the lipid content of tissue is relevant for tumor pathology and any fixation-induced alteration of tissue lipid content is expected to have a negative impact on tumor detection, analysis, and diagnosis. The effects of fixation on tumorous tissue are shown in Fig. 3 using a consecutive cryosection of mouse brain with an experimental melanoma. In the CARS image of an unfixed section [Fig. 3(b)], the tumor appeared as a compact mass surrounded by white matter (compare the H&E staining in panel A); the high cellularity of the tumor could be discerned and the cell nuclei recognized as darker round shapes [arrowheads in Fig. 3(e)], in agreement with already reported results.45 After formalin fixation [Fig. 3(c)], the tumor was still clearly distinguished from the surrounding tissue and cell nuclei remained visible, although less defined [arrowheads in Fig. 3(f)]. As expected, methanol–acetone fixation profoundly altered the intensity of the CARS signal in the overall sample [Fig. 3(d)] and was again consistent with a strong removal of lipids. The tumor and the surrounding white matter were characterized by a similar CARS signal intensity and only a few cell nuclei were barely visible [arrowhead in Fig. 3(g)]. The comparison of the resonant and nonresonant images of the unfixed [Figs. 3(h) versus 3(i)] and PFA fixed samples [Figs. 3(j) versus 3(k)] demonstrated that there is an appreciable amount of resonant CARS signal produced by the tissue constituents. The comparison of the resonant and nonresonant images of the methanol–acetone fixed sample [Figs. 3(l) versus 3(m)] shows that the resonant signal (now expected to be generated by bonds in proteins) was in fact strongly reduced. Fig. 3Effects of fixation on the CARS images of mouse brain tumor (melanoma metastasis). (a) H&E staining of a 10-μm thick cryosection, the box indicates the area imaged by CARS. (b–d) CARS images of consecutive cryosections unfixed, fixed with 4% PFA, and with methanol–acetone, respectively. The H&E staining was performed on the very same section shown in (b). (e–g) Details of the tumor showing cell nuclei (arrowheads). (h, j, l) Resonant images of the tumor border. (i, k, m) Nonresonant images of the regions shown in (h), (j), and (l).  Moreover, CARS images of tumor samples clearly showed an alteration of tissue morphology after fixation [e.g., small tissue cracks in Figs. 3(e) versus 3(f) and 3(g)]. The presented results provided evidence that fixation with methanol and acetone decreases the tissue lipid content and therefore, strongly modifies the CARS signals acquired on cryosections of normal and tumorous mouse tissues, while formalin fixation might constitute an alternative to unfixed samples. In the study of nervous tissue, CARS imaging is widely used for imaging of lipid-rich axonal structures and may help to localize lipid-loaded cells by the detection of intracellular lipid droplets (LD). In order to further assess the applicability of formalin fixation, the potential fixation-induced changes on those microstructures were analyzed. CARS imaging of LDs was performed on the cryosections of human glioblastoma. In the normal brain, LDs cannot be likely observed, but in high grade astrocytic tumors extracellular LDs are a consequence of necrosis, while cytosolic LDs are expressed by the tumor cells.46 As shown in Fig. 4, only minor differences could be detected between the images acquired before (panel A) and after fixation in PFA (panel B), which are likely due to the small differences in the focal plane position. To enable a better visualization of LDs, the section was imaged with the rehydration in PBS. Fig. 4Effects of formalin fixation on the CARS images of human glioblastoma cryosection. (a) Unfixed, rehydrated cryosection. (b) Formalin fixed, rehydrated cryosection. 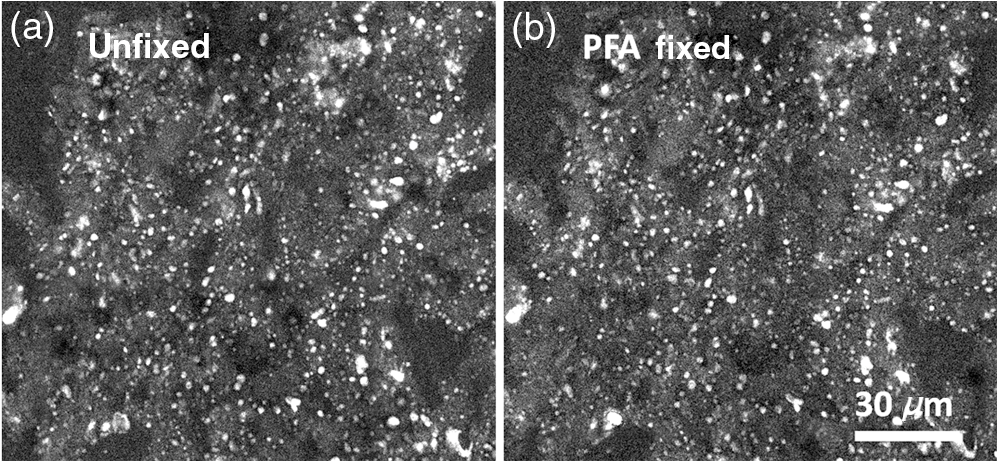 Finally, the effects of formalin fixation were investigated using the fresh bulk samples of mouse brain cerebellum. The axonal structures of white matter tracts were imaged on the fresh, native tissue [Fig. 5(a)], and after formalin fixation of the same tissue specimen [Fig. 5(b)]. CARS imaging of comparable regions did not underline alterations in the myelin sheath appearance, demonstrating that formalin fixation preserves axonal microstructure and is a viable solution also when applied to bulk tissue samples. 4.ConclusionsWe analyzed the effects of two common methods of fixation (formalin and methanol–acetone) on brain tissue, showing how the procedure modifies the biochemistry of the tissue and therefore the CARS image intensity and contrast. Fixation with methanol and acetone strongly decreased the tissue lipid content and therefore it was considered to be incompatible with the CARS imaging. On the other hand, the results show that fixation with formalin constitutes a viable alternative that does not alter substantially the CARS image contrast generated by the different tissue structures. AcknowledgmentsThis work was funded by the German Federal Ministry of Education and Research (MediCARS project, A.Z. 13N10777). We gratefully acknowledge Dipl.-Biol. Elke Leipnitz for highly professional assistance in tissue section preparation and histology staining. ReferencesX. Han,
“Neurolipidomics: challenges and developments,”
Front. Biosci., 12 2601
–2615
(2007). http://dx.doi.org/10.2741/2258 1093-9946 Google Scholar
C. M. DeberS. J. Reynolds,
“Central-nervous-system myelin—structure, function, and pathology,”
Clin. Biochem., 24
(2), 113
–134
(1991). http://dx.doi.org/10.1016/0009-9120(91)90421-A CLBIAS 0009-9120 Google Scholar
A. Beljebbaret al.,
“Ex vivo and in vivo diagnosis of C6 glioblastoma development by Raman spectroscopy coupled to a microprobe,”
Anal. Bioanal. Chem., 398
(1), 477
–487
(2010). http://dx.doi.org/10.1007/s00216-010-3910-6 ABCNBP 1618-2642 Google Scholar
N. Bergneret al.,
“Unsupervised unmixing of Raman microspectroscopic images for morphochemical analysis of non-dried brain tumor specimens,”
Anal. Bioanal. Chem., 403
(3), 719
–725
(2012). http://dx.doi.org/10.1007/s00216-012-5858-1 ABCNBP 1618-2642 Google Scholar
L. S. Eberlinet al.,
“Classifying human brain tumors by lipid imaging with mass spectrometry,”
Cancer Res., 72
(3), 645
–654
(2012). http://dx.doi.org/10.1158/0008-5472.CAN-11-2465 CNREA8 0008-5472 Google Scholar
T. E. Sjobakket al.,
“Metabolic profiles of brain metastases,”
Int. J. Mol. Sci., 14
(1), 2104
–2118
(2013). http://dx.doi.org/10.3390/ijms14012104 IJMCFK 1422-0067 Google Scholar
C. X. Huet al.,
“Analytical strategies in lipidomics and applications in disease biomarker discovery,”
J. Chromatogr. B, 877
(26), 2836
–2846
(2009). http://dx.doi.org/10.1016/j.jchromb.2009.01.038 JCBBEP 0378-4347 Google Scholar
R. M. AdibhatlaJ. F. HatcherR. J. Dempsey,
“Lipids and lipidomics in brain injury and diseases,”
AAPS J., 8
(2), E314
–E321
(2006). http://dx.doi.org/10.1007/BF02854902 AJAOB6 1550-7416 Google Scholar
M. MullerA. Zumbusch,
“Coherent anti-Stokes Raman scattering microscopy,”
ChemPhysChem, 8
(15), 2156
–2170
(2007). http://dx.doi.org/10.1002/(ISSN)1439-7641 CPCHFT 1439-4235 Google Scholar
C. L. EvansX.S. Xie,
“Coherent anti-Stokes Raman scattering microscopy: chemical imaging for biology and medicine,”
Annu. Rev. Anal. Chem., 1 883
–909
(2008). http://dx.doi.org/10.1146/annurev.anchem.1.031207.112754 ARACFU 1936-1327 Google Scholar
T. T. LeS. H. YueJ. X. Cheng,
“Shedding new light on lipid biology with coherent anti-Stokes Raman scattering microscopy,”
J. Lipid Res., 51
(11), 3091
–3102
(2010). http://dx.doi.org/10.1194/jlr.R008730 JLPRAW 0022-2275 Google Scholar
J. P. Pezackiet al.,
“Chemical contrast for imaging living systems: molecular vibrations drive CARS microscopy,”
Nat. Chem. Biol., 7
(3), 137
–145
(2011). http://dx.doi.org/10.1038/nchembio.525 1552-4450 Google Scholar
H. W. Wanget al.,
“Chasing lipids in health and diseases by coherent anti-Stokes Raman scattering microscopy,”
Vib. Spectrosc., 50
(1), 160
–167
(2009). http://dx.doi.org/10.1016/j.vibspec.2008.11.007 VISPEK 0924-2031 Google Scholar
C. L. Evanset al.,
“Chemically-selective imaging of brain structures with CARS microscopy,”
Opt. Express, 15
(19), 12076
–12087
(2007). http://dx.doi.org/10.1364/OE.15.012076 OPEXFF 1094-4087 Google Scholar
T. Meyeret al.,
“Nonlinear microscopy, infrared, and Raman microspectroscopy for brain tumor analysis,”
J. Biomed. Opt., 16
(2), 021113
(2011). http://dx.doi.org/10.1117/1.3533268 JBOPFO 1083-3668 Google Scholar
C. Pohlinget al.,
“Chemoselective imaging of mouse brain tissue via multiplex CARS microscopy,”
Biomed. Opt. Express, 2
(8), 2110
–2116
(2011). http://dx.doi.org/10.1364/BOE.2.002110 BOEICL 2156-7085 Google Scholar
Y. Fuet al.,
“Ex vivo and in vivo imaging of myelin fibers in mouse brain by coherent anti-Stokes Raman scattering microscopy,”
Opt. Express, 16
(24), 19396
–19409
(2008). http://dx.doi.org/10.1364/OE.16.019396 OPEXFF 1094-4087 Google Scholar
Y. Z. Shiet al.,
“Longitudinal in vivo coherent anti-Stokes Raman scattering imaging of demyelination and remyelination in injured spinal cord,”
J. Biomed. Opt., 16
(10), 106012
(2011). http://dx.doi.org/10.1117/1.3641988 JBOPFO 1083-3668 Google Scholar
E. Belangeret al.,
“Live animal myelin histomorphometry of the spinal cord with video-rate multimodal nonlinear microendoscopy,”
J. Biomed. Opt., 17
(2), 021107
(2012). http://dx.doi.org/10.1117/1.JBO.17.2.021107 JBOPFO 1083-3668 Google Scholar
T. B. Huffet al.,
“Real-time CARS imaging reveals a calpain-dependent pathway for paranodal myelin retraction during high-frequency stimulation,”
PLoS One, 6
(3), e17176
(2011). http://dx.doi.org/10.1371/journal.pone.0017176 1932-6203 Google Scholar
J. Imitolaet al.,
“Multimodal coherent anti-Stokes Raman scattering microscopy reveals microglia-associated myelin and axonal dysfunction in multiple sclerosis-like lesions in mice,”
J. Biomed. Opt., 16
(2), 021109
(2011). http://dx.doi.org/10.1117/1.3533312 JBOPFO 1083-3668 Google Scholar
R. Galliet al.,
“Vibrational Spectroscopic imaging and multiphoton microscopy of spinal cord injury,”
Anal. Chem., 84
(20), 8707
–8714
(2012). http://dx.doi.org/10.1021/ac301938m ANCHAM 0003-2700 Google Scholar
R. Galliet al.,
“Non-linear optical microscopy of kidney tumours,”
J. Biophoton.,
(2013). http://dx.doi.org/10.1002/jbio.201200216 JBOIBX 1864-063X Google Scholar
R. Galliet al.,
“CARS and non-linear microscopy imaging of brain tumors,”
Proc. SPIE, 8797 87970E
(2013). http://dx.doi.org/10.1117/12.2031729 PSISDG 0277-786X Google Scholar
R. Mitraet al.,
“Detection of lipid-rich prostate circulating tumour cells with coherent anti-Stokes Raman scattering microscopy,”
BMC Cancer, 12 540
–549
(2012). http://dx.doi.org/10.1186/1471-2407-12-540 BCMACL 1471-2407 Google Scholar
P. J. Stoward, Fixation in Histochemistry, Chapman and Hall, London
(1973). Google Scholar
F. D’AmicoE. SkarmoutsouF. Stivala,
“State of the art in antigen retrieval for immunohistochemistry,”
J. Immunol. Methods, 341
(1–2), 1
–18
(2009). http://dx.doi.org/10.1016/j.jim.2008.11.007 JIMMBG 0022-1759 Google Scholar
S. Devpuraet al.,
“Raman spectroscopic investigation of frozen and deparaffinized tissue sections of pediatric tumors: neuroblastoma and ganglioneuroma,”
J. Raman Spectrosc., 44
(3), 370
–376
(2013). http://dx.doi.org/10.1002/jrs.v44.3 JRSPAF 0377-0486 Google Scholar
M. J. Hackettet al.,
“Chemical alterations to murine brain tissue induced by formalin fixation: implications for biospectroscopic imaging and mapping studies of disease pathogenesis,”
Analyst, 136
(14), 2941
–2952
(2011). http://dx.doi.org/10.1039/c0an00269k ANLYAG 0365-4885 Google Scholar
O. Faolainet al.,
“A study examining the effects of tissue processing on human tissue sections using vibrational spectroscopy,”
Vib. Spectrosc., 38 121
–127
(2005). http://dx.doi.org/10.1016/j.vibspec.2005.02.013 VISPEK 0924-2031 Google Scholar
Z. W. Huanget al.,
“Effect of formalin fixation on the near-infrared Raman spectroscopy of normal and cancerous human bronchial tissues,”
Int. J. Oncol., 23
(3), 649
–655
(2003). IJONES 1019-6439 Google Scholar
C. M. Krishnaet al.,
“Evaluation of the suitability of ex vivo handled ovarian tissues for optical diagnosis by Raman microspectroscopy,”
Biopolymers, 79
(5), 269
–276
(2005). http://dx.doi.org/10.1002/(ISSN)1097-0282 BIPMAA 0006-3525 Google Scholar
M. G. ShimB. C. Wilson,
“The effects of ex vivo handling procedures on the near-infrared Raman spectra of normal mammalian tissues,”
Photochem. Photobiol., 63
(5), 662
–671
(1996). http://dx.doi.org/10.1111/php.1996.63.issue-5 PHCBAP 0031-8655 Google Scholar
Y. N. Yeniet al.,
“Effect of fixation and embedding on Raman spectroscopic analysis of bone tissue,”
Calcif. Tissue Int., 78
(6), 363
–371
(2006). http://dx.doi.org/10.1007/s00223-005-0301-7 CTINDZ 0171-967X Google Scholar
M. M. Marianiet al.,
“Impact of fixation on in vitro cell culture lines monitored with Raman spectroscopy,”
Analyst, 134 1154
–1161
(2009). http://dx.doi.org/10.1039/b822408k ANLYAG 0365-4885 Google Scholar
C. H. Foxet al.,
“Formaldehyde fixation,”
J. Histochem. Cytochem., 33 845
–853
(1985). http://dx.doi.org/10.1177/33.8.3894502 JHCYAS 0022-1554 Google Scholar
C. B. Moelanset al.,
“Formaldehyde substitute fixatives analysis of macroscopy, morphologic analysis, and immunohistochemical analysis,”
Am. J. Clin. Pathol., 136 548
–556
(2011). http://dx.doi.org/10.1309/AJCPHH1B0COCBGOM AJCPAI 0002-9173 Google Scholar
Q. Shaoet al.,
“From protein denaturant to protectant: comparative molecular dynamics study of alcohol/protein interactions,”
J. Chem. Phys., 136
(11), 115101
(2012). http://dx.doi.org/10.1063/1.3692801 JCPSA6 0021-9606 Google Scholar
M. Kirschet al.,
“Angiostatin suppresses malignant glioma growth in vivo,”
Cancer Res., 58 4654
–4659
(1998). CNREA8 0008-5472 Google Scholar
J. Schindelinet al.,
“Fiji: an open-source platform for biological-image analysis,”
Nat. Methods, 9 676
–682
(2012). http://dx.doi.org/10.1038/nmeth.2019 1548-7091 Google Scholar
O. Burkackyet al.,
“Dual-pump coherent anti-Stokes-Raman scattering microscopy,”
Opt. Lett., 31
(24), 3656
–3658
(2006). http://dx.doi.org/10.1364/OL.31.003656 OPLEDP 0146-9592 Google Scholar
Z. MovasaghiS. RehmanI. U. Rehman,
“Raman spectroscopy of biological tissues,”
Appl. Spectrosc. Rev., 42
(5), 493
–541
(2007). http://dx.doi.org/10.1080/05704920701551530 APSRBB 0570-4928 Google Scholar
M. Kohleret al.,
“Characterization of lipid extracts from brain tissue and tumors using Raman spectroscopy and mass spectrometry,”
Anal. Bioanal. Chem., 393
(5), 1513
–1520
(2009). http://dx.doi.org/10.1007/s00216-008-2592-9 ABCNBP 1618-2642 Google Scholar
C. Krafftet al.,
“Near infrared Raman spectra of human brain lipids,”
Spectrochim. Acta A, 61
(7), 1529
–1535
(2005). http://dx.doi.org/10.1016/j.saa.2004.11.017 SAMCAS 1386-1425 Google Scholar
T. Meyeret al.,
“Interpreting CARS images of tissue within the C–H-stretching region,”
J. Biophoton., 5
(10), 729
–733
(2012). http://dx.doi.org/10.1002/jbio.201200104 JBOIBX 1864-063X Google Scholar
I. BarbaM. E. CabanasC. Arus,
“The relationship between nuclear magnetic resonance-visible lipids, lipid droplets, and cell proliferation in cultured C6 cells,”
Cancer Res., 59
(8), 1861
–1868
(1999). CNREA8 0008-5472 Google Scholar
|


