|
|
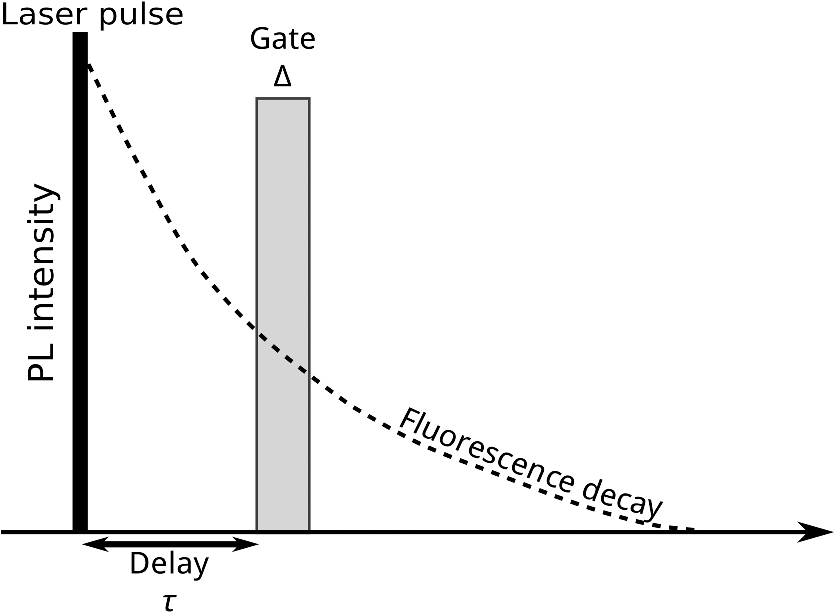
1.IntroductionSeveral in vivo cell tracking techniques based on the magnetic resonance imaging or positron emission tomography1 have been developed but remain challenging for rare and individual cell detection, mainly because of their low-spatial resolution. On contrary, the fluorescence microscopy allows a cell scale detection, but is limited by a low sensitivity. Indeed, absorption and scattering of visible light, as well as tissue autofluorescence degrade image contrast. Time-gated detection has been developed for fluorescence lifetime imaging microscopy measurements2 and also allows the rejection of short lifetime signals such as tissue autofluorescence.3–6 In the last few years, quantum dots have been used as probes for biological applications7,8 because they combine a high resistance to photobleaching with interesting optical properties: broad absorption cross section, tunable emission wavelength (according to their size and composition) and high fluorescence quantum yields (QY). For fluorescence imaging, there is indeed an “optical therapeutic window” (from 700 to 900 nm), where the absorption and scattering of major tissue chromophores are minimum.9,10 In this range of wavelengths, in vivo fluorescence imaging has been performed due to near-infrared-emitting quantum dots (NIR QDs).11 Recently, NIR QDs based on I–III–VI materials have emerged12–14 and exhibit a long fluorescence lifetime (around 150 ns).15–17 Moreover, unlike other semiconductor nanoparticles emitting in the IR (PbSe, CdTe), they are made of low toxicity materials.18 Nevertheless, the current challenge in this range of wavelengths consists of synthesizing probes with high fluorescence QY.12,15,19–22 Moreover, for cell tracking applications, cells have to be loaded with numerous probes, which have to be equally distributed between the two daughter cells to preserve homogeneous population labeling. We present here a new synthesis of NIR QDs made of low toxicity materials, emitting at 800 nm, and with fluorescence QY up to 35% in hexane. Their emission wavelength allows an excitation with a red-emitting laser, giving a better light penetration depth in tissues. The quantum dots are coated with a copolymeric ligand we recently developed,23 which allows one to obtain bright, stable, and homogeneously distributed probes in the cell cytoplasm at least for 48 h. Furthermore, our NIR QDs exhibit a long fluorescence lifetime (around 150 ns) compared to tissue autofluorescence (). Due to these unique properties and a time-gated detection on a widefield microscope, these QDs allow significant enhancement of the detection sensitivity of individual cells by efficiently rejecting short fluorescence lifetime signals. 2.Materials and Methods2.1.Synthesis of NIR QDsThe synthesis of Zn–Cu–In-Se/ZnS core/shell quantum dots is inspired by Cassette et al.14 In our core synthesis, all precursors (0.4 mmol of CuCl, 0.4 mmol of , 0.8 mmol of selenourea, and 0.8 mmol of Zn acetate) are introduced in a three-necked flask with 10 mL of octadecene (ODE) and 4 mL of trioctylphosphine (TOP), and briefly sonicated. Then, 4 mL of oleylamine (OAm) and 2 mL of dodecanethiol are added. The solution is stirred and degassed for 30 min under vacuum. The flask is then filled with argon and the solution is heated progressively up to 260°C in, typically, 10 min. Heating is stopped immediately after the target temperature is reached and the flask is cooled down to room temperature. The Zn–Cu–In–Se cores are precipitated with ethanol and then dispersed in 10 mL of hexane. For the shell synthesis, 4 mL of as-prepared cores is dispersed in 4 mL of ODE and 1 mL of OAm into a new three-necked flask. The mixture is degassed under vacuum at 40°C. A solution of zinc ethylxanthate and zinc oleate (respectively, 0.13 mmol and 0.8 mmol) dissolved in ODE (2 mL), TOP (3 mL), and dioctylamine (1 mL) is loaded into an injection syringe. The flask is heated to 190°C and these ZnS precursors are added dropwise in 1 h under argon atmosphere. At the end of the injection, the reaction flask is cooled down to room temperature. The resulting Zn–Cu–In–Se/ZnS QDs are finally precipitated with ethanol and redispersed in 10 mL of hexane. Optical spectroscopy characterization is performed using a F900 Edinburgh spectrometer. 2.2.Solubilization in WaterThe solubilization in water is performed due to a ligand exchange. Four hundreds microliters of the Zn–Cu–In–Se/ZnS QDs are precipitated with ethanol and resuspended in 100 μL of mercaptopropionic acid overnight at 60°C. The QDs are dissolved in dimethylformamide (1 mL) and precipitated using potassium tert-butoxide. QDs are resuspended in basic water (sodium tetraborate 10 mM, pH 9.2) and mixed with a solution of poly(dithiol-co-sulfobetaine) zwitterionic ligands23 for 12 h at 60°C. After the ligand exchange, the QDs are purified as previously described by Giovanelli et al. using ultrafiltration and ultracentrifugation. The QDs are finally resuspended in a 20 mM aqueous solution of NaCl. 2.3.Cell LabelingQDs are diluted in Dulbecco’s modified Eagle medium enriched with 10% fetal bovine serum and 1% penicillin–streptomycin antibiotics, later referred to as complete medium. About 500,000 HeLa cells are suspended with 10 μM of QDs in a final volume of 100 μL in a 2-mm electroporation cuvette. The cuvette is subjected to 0.15 kV for a 30-ms pulse using a Gene Pulser (Biorad, Hercules) electroporator. The cells are rinsed five times with warm complete medium, dispersed in a nonfluorescent imaging medium (OptiMEM® with no phenol red, Life technologies, Carlsbad, California) and deposited on a microscope coverslip (25 mm in diameter). The cells are kept at least for 1 h at 37°C under a 5% of atmosphere before imaging. 2.4.Optical SetupThe light source used for time-gated imaging (setup shown in Fig. 1) is a picosecond pulsed laser diode (Picoquant PDL 800, Berlin, Germany), emitting at 659 nm, with a 1 or 5 MHz repetition rates injected in the epi-illumination path of a commercial microscope body (Olympus BX51WIF, Shinjuky, Japan). The beam spot size and position on the sample are controlled by an external telescope and periscope. We use a water immersion Olympus objective () and a Olympus objective (). We use emission filters to discriminate between the QDs fluorescence and the excitation signal. A relay achromatic pair matches the image size to the intensifier and gate surface (Picostar HRI, LaVision, Goettigen, Germany). The same relay system is placed head to tail between the intensifier and the electron multiplying charge-coupled device (EMCCD) camera (Roper QuantEM 512 C, Photometrics, Tucson, Arizona) to preserve the nominal microscope magnification factor. The laser diode and the intensifier are synchronized by two phase-locked function generators (Agilent 33120A and Agilent 33220A). 2.5.Photoluminescence Intensity Decay MeasurementsThe system described above can be used to carry out photoluminescence (PL) intensity decay measurements. The intensifier is used in a mode in which the gate is driven by a waveform synthesizer. This mode is suited to perform time-gated detection as well as fluorescence intensity decay measurements. PL intensity decays are measured by acquiring a sequence of images, while phase shifting a 200-ns width gate trigger signal with respect to the laser trigger, as illustrated in Fig. 2. This introduces a controllable time delay, , between the laser excitation and the beginning of the detection gate. Thus, for each gate position, an image is acquired. A common region of interest (ROI) for all images is selected and for each image, the average intensity of the ROI pixels is measured. The image offset, induced by the camera or by the external light sources, is eliminated by recording a sequence without laser excitation and substracting the average of the pixel intensity of the same ROI from the original sequence. The results are then normalized to the measure obtained after the laser pulse. For fluorescence decay measurements, we typically use radio frequency gain at 30% and Micro Channel Plate gain at 700 V and an input driving peak to peak voltage of 2 V. 3.Results and Discussion3.1.NIR QDs as Stable Probes for Cell Imaging3.1.1.Spectroscopic characterization of NIR QDsWe have developed and optimized the synthesis of NIR emitting Zn–Cu–In–Se/ZnS core/shell QDs. Compared to the previously reported Cu–In–Se/ZnS QDs,14,24 we note that the incorporation of zinc during the core synthesis improves their fluorescence QY, and provided us with brighter core/shell QDs, as already noted with Zn–Cu–In–S QDs.13,20,25 This has been putatively attributed to defect passivation and filling of vacancy sites by Zn atoms inside the QD cores. The QD size is estimated at typically 3 nm by electron microscopy and x-ray diffraction (data not shown). The initially hydrophobic QDs are solubilized in water as described in Sec. 2. These ligands provide suitable long-term colloidal and intracellular stability for our NIR QDs as will be demonstrated below. Figure 3 presents the emission spectra of our NIR QDs in hexane and water, as well as the PL intensity decays. The emission (with an FWHM of around 130 nm) is centered around 800 nm, which corresponds to the “optical therapeutic window” for in vivo fluorescence imaging, in which the tissue penetration is maximal.9,10 Fluorescence QY measurements gave typical values of 35% for QDs in hexane and 20% for QDs in aqueous solution after ligand exchange. We have observed that the emission is slightly blue shifted after ligand exchange, which could be attributed to a slight etching of the QD surface, or to better PL QY preservation of bluer-emitting QDs during the ligand exchange. Fig. 3(a) Normalized photoluminescence spectra. (b) Normalized photoluminescence intensity decays of near-infrared-emitting quantum dots (NIR QDs) in hexane (black) and water (gray). 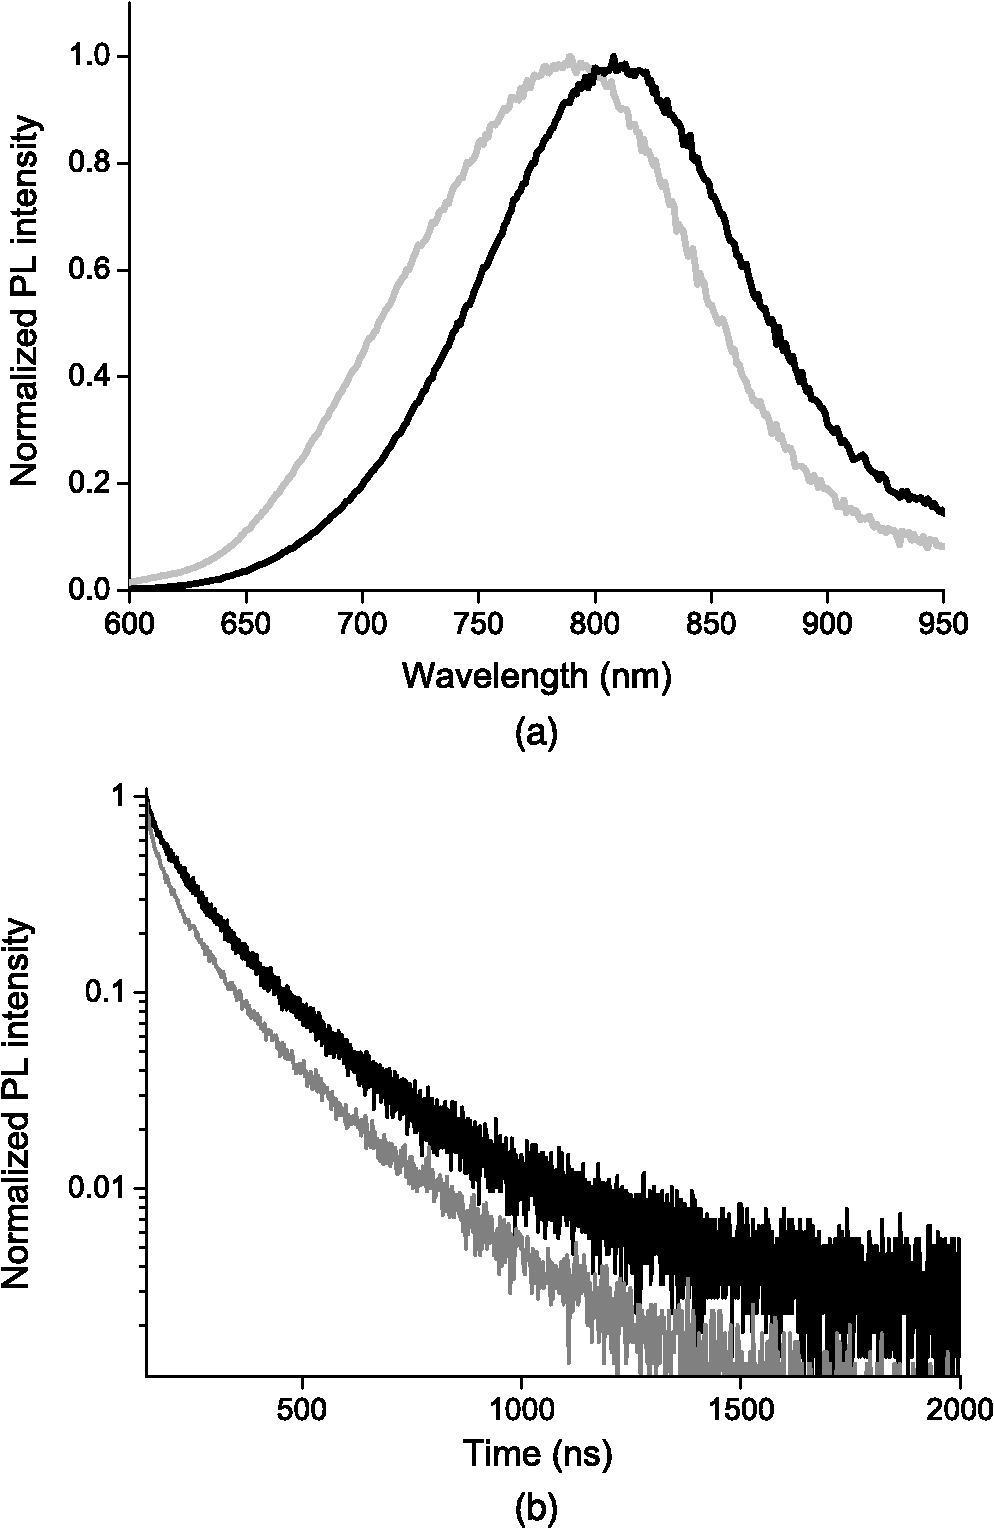 PL decays are multiexponential with a slow component, typically from 150 to 200 ns, compared to II–VI QDs, which usually decay in .4,26 This slow component is dominant. It can be related to a donor–acceptor transition and defect recombination. In fact, the localization of the exciton electron on Cu atoms strongly reduces the exciton overlap in these QDs and yields longer excitonic lifetimes.15 This type of recombination also explains the broad emission spectra compared to II–VI QDs.16 A shorter component between 10 and 60 ns is mainly due to intrinsic recombination of initially populated core states or surface states.16 3.1.2.Labeling of live cells and NIR QDs stabilityAs we aim to track cells over a few days, they need to be stained with a very high concentration of probes. Indeed, the cell division leads to a QDs dilution between two daughter cells. For this reason, we choose electroporation within the several techniques27 because it allows one to obtain cells which are massively loaded with QDs in their cytoplasm. Moreover, cell tracking experiments require highly stable intracellular probes. QDs have to remain individual and freely diffusing in order to be equally distributed in two daughter cells. Muro et al.28 observed that the cytoplasmic aggregation kinetics depend strongly on the nanoparticle surface chemistry. Consequently, we have chosen to coat our quantum dots with a multidentate ligand which allows a high stability in cells for visible emitting quantum dots during several days.23 Figure 4 shows images of living HeLa cells electroporated with NIR QDs, obtained at different times after the electroporation (5, 24, and 48 h). In order to visually compensate for the diminution of the fluorescence signal induced by QD dilution after each cell division, the intensity level of the middle image (24 h) was doubled and the level of the last image (48 h) was quadrupled according to the number of cell divisions. The original images exhibit average levels compatible with one and two division stages and no leaking of QDs. The images in Fig. 4 show that NIR QDs coated with this surface chemistry stay bright and homogeneously distributed in the cell cytoplasm for several days. Moreover, while initial free-floating cells are round (Fig. 4, 5 h), they become adherent on the coverslip the day after the electroporation (Fig. 4, 24 h). This, together with their preserved mitotic activity, is coherent with an expected low level of toxicity.29 Fig. 4Fluorescence microscopy images of HeLa cells electroporated with NIR QDs at different times after the electroporation: 5, 24, and 48 h (scale bar: 16 μm).  As we intend to couple these probes to a time-gated detection, we have to verify that they keep their long fluorescence lifetime in different media and in the cell cytoplasm with time. We have measured the fluorescence intensity decays on three different samples in order to observe the influence of the QDs surrounding medium on their fluorescence lifetime. The lifetime measurements have been performed as described above in Sec. 2.5. Figure 5(a) shows fluorescence intensity decays obtained for three NIR QD samples: in hexane, in water (after ligand exchange), and in the cytoplasm of living cells. We performed the same experiment to measure fluorescence decays in the cell cytoplasm at different times after the electroporation (5, 24, and 48 h). We have fitted the fluorescence decay curves by a multiexponential curve with two major components and presented the different parameters in Table 1. The corresponding values of each parameter and are equatable from one curve to the other, taking into account the standard deviations. Fig. 5(a) Normalized fluorescence intensity decay measurements of NIR QDs in different media (hexane, water, and cell cytoplasm). (b) Normalized fluorescence intensity decay of NIR QDs in the cell cytoplasm at different times after the electroporation (5, 24, and 48 h).  Table 1Numerical values of τ1 and τ2 used to fit our fluorescence decay curves in Fig. 5 and their respective weights, α1 and α2.
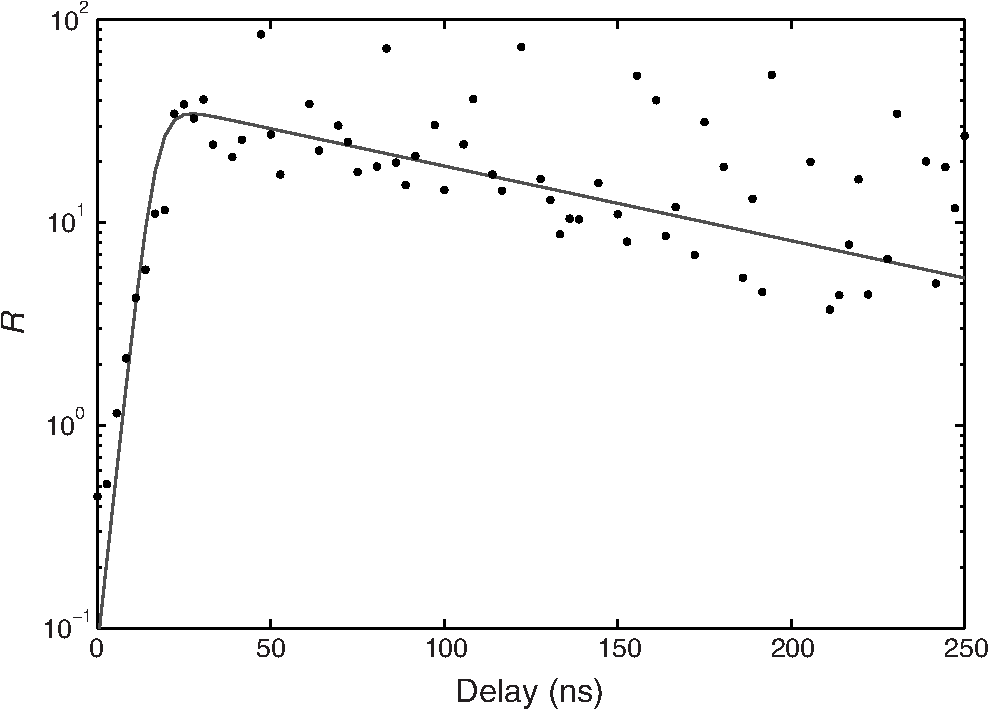
The decay kinetics remain unchanged not only in different media [Fig. 5(a)] but also in the cell cytoplasm even after 3 days [Fig. 5(b)], reflecting the long-term stability of QDs in the cytoplasmic medium, and confirming the possibility to use them to label cells for tracking applications. 3.2.NIR QDs Coupled to Time-Gated Detection for Short Lifetime Autofluorescence Rejection3.2.1.Proof of principleWe demonstrate the increase of sensitivity by combining time-gated fluorescence detection with cells labeled with our long PL lifetime NIR QDs. To this end, we have imaged simultaneously cells electroporated with NIR QDs and cells electroporated with NIR fluorescent beads (beads coated with NIR organic fluorophores, F8783, Invitrogen, Life technologies, Carlsbad, California) with a very short fluorescence lifteime (). The cells have been rinsed, mixed together, and deposited on the same coverslip. As described in Sec. 2, we have illuminated the cells with the pulsed laser source at 1 MHz and imaged them through 200-ns gate. For this study, we did not investigate the influence of these two parameters that have been fixed arbitrarily. Each image has been acquired using a different delay , between the laser pulse excitation and the opening of the gate. We have varied this delay between 0 and 200 ns with 2.7 ns steps. The camera exposure duration was fixed to 150 ms. Figure 6 shows examples of time-gated images of two cells taken at delay 0, 11, 30, and 50 ns. The left cell was stained with NIR QDs and the right one with fluorescent beads. The progressive disappearance of the cell stained with the fluorescent beads (right) clearly illustrates the rejection of the short lifetime signal as the delay increases. Figure 7 is a plot of the fluorescence intensity decay of the two cells shown in Fig. 6. The signal was averaged over the central area of each cell. At zero delay, the ratio between the fluorescent beads signal and the QD signal is 2.5. At a delay of , the fluorescent beads signal goes below the noise level. This is thus the optimal delay for opening the gate. We characterized the efficiency of the gated detection by defining a parameter which corresponds to the ratio of the signal from NIR QDs on the background noise and the spurious fluorescence signal corresponding to short lifetime signal. It can be written as where and are, respectively, the signal from the quantum dots and fluorescent beads at zero delay, is the background noise level, and is the gate delay. depends on the gate width but not on the delay. and are the fluorescence lifetimes of QDs and short lifetime fluorophores, respectively. As long as the denominator in Eq. (1) is dominated by the spurious fluorescence, the ratio increases as . If, on the contrary, the background noise is dominant, the ratio decreases as ; This behavior is illustrated in Fig. 8, where we plotted measured on the images presented in Fig. 6, as a function of the delay. The solid gray curve is a fit of the data with the function of Eq. (1). The fit allowed us to estimate the fluorescence lifetimes: we found and and a maximum ratio obtained at . The ratio increases by two orders of magnitude: at and .Fig. 6Images of HeLa cells labeled with NIR QDs (cell on the left) or beads containing NIR fluorescent organic dyes (cell on the right) at different delays after the laser pulse. (scale bar: 10 μm). 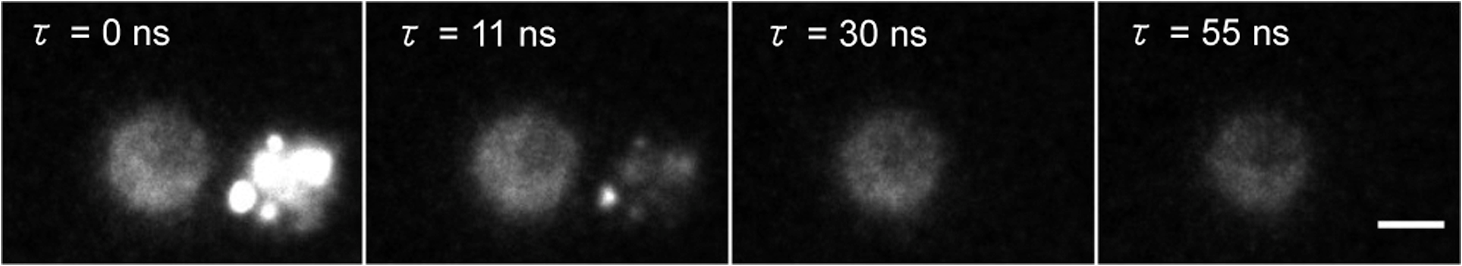 In order to quantify the time-gated detection efficiency, we define a fluorescence rejection factor as the ratio between the QD signal and the spurious fluorescence signal, normalized by the same ratio without time-gated detection. It can be written as with the gate width. Using the estimated values of the lifetimes, we obtain . The high value of the rejection factor is obtained due to the long fluorescence lifetime of NIR QDs in the cell cytoplasm. The optimal gate delay is fixed by spurious fluorescence level and lifetime and by the background noise level. It depends only weakly on the QDs’ lifetime and can be optimized independently on the QD characteristics.3.2.2.Ex vivo experimentWe have deposited HeLa cells previously electroporated with NIR QDs on a thin slice of ex vivo tissue of beef muscle. This corresponds to a situation where the QDs’ signal is superimposed to the autofluoresence one, compared to the previous experiments where both the signals were spatially decorrelated. We have illuminated the sample with the pulsed laser source at 5 MHz and imaged it through a 160 ns gate width. All images have been acquired with an exposure time of 100 ms and each image corresponds to an open gate position relative to the laser pulse at the zero delay . Figure 9 is a plot of the average intensity at the cell location (NIR QDs and tissue autofluorescence and noise) (black curve), the average intensity next to the cell location (tissue autofluorescence and noise) (gray curve) and the ratio as defined in the previous section. Fig. 9Average intensity at the cell location (black squares), average intensity of the autofluorescence (gray circles), and ratio (dark gray triangles).  For , which corresponds to a gate that is open when the laser pulse illuminates the sample, the autofluorescence signal dominates the NIR QDs one. Thus, both the signals are nearly constant and we mainly detect signal from tissue autofluorescence. For positive values of , since autofluorescence has a short fluorescence lifetime (), its contribution falls rapidly. At , when the autofluorescence signal falls below the noise level, reaches its highest value: . This maximum represents an increase by more than an order of magnitude compared to zero delay [], demonstrating the important benefit of our system. Then, decreases following the QDs’ fluorescence decay. Figure 10 shows images of the sample for two different time delays. On the left image, the gate opens before the laser impulsion, and both fluorescence from the cell and fluorescence from the tissue (autofluorescence) contribute to the signal. On the right image, the gate opens with a delay after the laser pulse. Fig. 10Images of NIR QDs stained cell for different positions of the gate detection (scale bar: 10 μm).  This experiment demonstrates that autofluorescence rejection through time-gated detection of long lifetime NIR-QDs exhibits performances and gain in sensitivity when a single cell is embeded within a strongly autofluorescent environment. 4.SummaryWe have synthesized and characterized new biocompatible NIR QDs for in vivo fluorescence imaging. These probes remain stable, bright, and homogeneously distributed in the cell cytoplasm. They also keep their long fluorescence decay in different media, including in the cell cytoplasm of living cells, at least for 48 h. Due to these properties, we demonstrated that we could couple these probes to a widefield time-gated imaging and efficiently discriminate between NIR QDs emission and spurious short lifetime signals, such as autofluorescence in an ex vivo sample. This combination of probes and widefield time-gated detections could be functional for in vivo cell tracking, where the autofluorescence is the main limitation. AcknowledgmentsPart of this work was funded by “les Laboratoires Servier” and the “Investissement d’Avenir project Nano-CTC.” We would like to thank Anne Simon for her help on cell culture and Aurore Bournigault-Nuquet for her help on the instrument characterization. ReferencesH. Honget al.,
“Non-invasive cell tracking in cancer and cancer therapy,”
Curr. Top. Med., 10
(12), 1237
–1248
(2010). http://dx.doi.org/10.2174/156802610791384234 1568-0266 Google Scholar
D. Elsonet al.,
“Biomedical applications of fluorescence lifetime imaging,”
Opt. Photonics News, 13
(11), 36
–32
(2002). http://dx.doi.org/10.1364/OPN.13.11.000026 OPPHEL 1047-6938 Google Scholar
R. Richards-KortumE. Sevick-Muraca,
“Quantitative optical spectroscopy for tissue diagnosis,”
Ann. Rev. Phys. Chem., 47 555
–606
(1996). http://dx.doi.org/10.1146/annurev.physchem.47.1.555 ARPLAP 0066-426X Google Scholar
M. Dahanet al.,
“Time-gated biological imaging by use of colloidal quantum dots,”
Opt. Lett., 26
(11), 825
–827
(2001). http://dx.doi.org/10.1364/OL.26.000825 OPLEDP 0146-9592 Google Scholar
A. Mayet al.,
“Whole-body, real-time preclinical imaging of quantum dot fluorescence with time-gated detection,”
J. Biomed. Opt., 14
(6), 060504
(2009). http://dx.doi.org/10.1117/1.3269675 JBOPFO 1083-3668 Google Scholar
G. Mandalet al.,
“Cadmium-free quantum dots as time-gated bioimaging probes in highly-autofluorescent human breast cancer cells,”
Chem. Commun., 49
(6), 624
–626
(2013). http://dx.doi.org/10.1039/c2cc37529j CHCOFS 1364-548X Google Scholar
X. Michaletet al.,
“Quantum dots for live cells, in vivo imaging, and diagnostics,”
Science, 307
(5709), 538
–544
(2005). http://dx.doi.org/10.1126/science.1104274 SCIEAS 0036-8075 Google Scholar
M. Bruchez Jr.et al.,
“Semiconductor nanocrystals as fluorescent biological labels,”
Science, 281
(5385), 2013
–2016
(1998). http://dx.doi.org/10.1126/science.281.5385.2013 SCIEAS 0036-8075 Google Scholar
Q. MaX. Su,
“Near-infrared quantum dots: synthesis, functionalization and analytical applications,”
Analyst, 135
(8), 1867
–1877
(2010). http://dx.doi.org/10.1039/c0an00233j ANLYAG 0365-4885 Google Scholar
J. Frangioni,
“In vivo near-infrared fluorescence imaging,”
Curr. Opin. Chem. Biol., 7
(5), 626
–634
(2003). http://dx.doi.org/10.1016/j.cbpa.2003.08.007 COCBF4 1367-5931 Google Scholar
S. Kimet al.,
“Near-infrared fluorescent type II quantum dots for sentinel lymph node mapping,”
Nat. Biotechnol., 22
(1), 93
–97
(2004). http://dx.doi.org/10.1038/nbt920 NABIF9 1087-0156 Google Scholar
L. Liet al.,
“Highly luminescent core/shell nanocrystals: cadmium-free quantum dots for in vivo imaging,”
Chem. Mater., 21
(12), 2422
–2429
(2009). http://dx.doi.org/10.1021/cm900103b CMATEX 0897-4756 Google Scholar
T. Ponset al.,
“Cadmium-free quantum dots for sentinel lymph node imaging with reduced toxicity,”
ACS Nano, 4
(5), 2531
–2538
(2010). http://dx.doi.org/10.1021/nn901421v 1936-0851 Google Scholar
E. Cassetteet al.,
“Synthesis and characterization of near-infrared Cu–In–Se/ZnS core/shell quantum dots for in vivo imaging,”
Chem. Mater., 22
(22), 6117
–6124
(2010). http://dx.doi.org/10.1021/cm101881b CMATEX 0897-4756 Google Scholar
L. Liet al.,
“Efficient synthesis of highly luminescent copper indium sulfide-based core/shell nanocrystals with surprisingly long-lived emission,”
J. Am. Chem. Soc., 133
(5), 1176
–1179
(2011). http://dx.doi.org/10.1021/ja108261h JACSAT 0002-7863 Google Scholar
H. Zhonget al.,
“Controlled synthesis and optical properties of colloidal ternary chalcogenide CuInS2 nanocrystals,”
Chem. Mater., 20
(20), 6434
–6443
(2008). http://dx.doi.org/10.1021/cm8006827 CMATEX 0897-4756 Google Scholar
T. K. C. Tranet al.,
“Time-resolved photoluminescence study of nanocrystals,”
Adv. Nat. Sci.: Nanosci. Nanotechnol., 1
(2), 025007
(2010). http://dx.doi.org/10.1088/2043-6254/1/2/025007 2043-6254 Google Scholar
A. L. Rogachet al.,
“Infrared-emitting colloidal nanocrystals: synthesis, assembly, spectroscopy, and applications,”
Small, 3
(4), 536
–557
(2007). http://dx.doi.org/10.1002/(ISSN)1613-6829 1613-6829 Google Scholar
B. Chenet al.,
“Highly emissive and color-tunable colloidal semiconductor nanocrystals: off-stoichiometry effects and improved electroluminescence performance,”
Adv. Funct. Mater., 22
(10), 2081
–2088
(2012). http://dx.doi.org/10.1002/adfm.201102496 AFMDC6 1616-3028 Google Scholar
J. ZhangR. XieW. Yang,
“A simple route for highly luminescent quaternary Cu–Zn–In–S nanocrystal emitters,”
Chem. Mater., 23
(14), 3357
–3361
(2011). http://dx.doi.org/10.1021/cm201400w CMATEX 0897-4756 Google Scholar
H. Nakamuraet al.,
“Tunable photoluminescence wavelength of chalcopyrite semiconductor nanocrystals synthesized in a colloidal system,”
Chem. Mater., 18
(14), 3330
–3335
(2006). http://dx.doi.org/10.1021/cm0518022 CMATEX 0897-4756 Google Scholar
P. M. AllenM. G. Bawendi,
“Ternary I–III–VI quantum dots luminescent in the red to near-infrared,”
J. Am. Chem. Soc., 130
(29), 9240
–9241
(2008). http://dx.doi.org/10.1021/ja8036349 JACSAT 0002-7863 Google Scholar
E. Giovanelliet al.,
“Highly enhanced affinity of multidentate versus bidentate zwitterionic ligands for long-term quantum dot bioimaging,”
Langmuir, 28
(43), 15177
–15184
(2012). http://dx.doi.org/10.1021/la302896x LANGD5 0743-7463 Google Scholar
J. Parket al.,
“CuInSe/ZnS core/shell NIR quantum dots for biomedical imaging,”
Small, 7
(22), 3148
–3152
(2011). http://dx.doi.org/10.1002/smll.v7.22 1613-6829 Google Scholar
L. De Trizioet al.,
“Strongly fluorescent quaternary CuIn–Zn–S nanocrystals prepared from nanocrystals by partial cation exchange,”
Chem. Mater., 24
(12), 2400
–2406
(2012). http://dx.doi.org/10.1021/cm301211e CMATEX 0897-4756 Google Scholar
J. A. KloepferS. E. BradforthJ. L. Nadeau,
“Photophysical properties of biologically compatible CdSe quantum dot structures,”
J. Phys. Chem. B, 109
(20), 9996
–10003
(2005). http://dx.doi.org/10.1021/jp044581g JPCBFK 1520-6106 Google Scholar
A. DerfusW. ChanS. Bhatia,
“Intracellular delivery of quantum dots for live cell labeling and organelle tracking,”
Adv. Mater., 16
(12), 961
–966
(2004). http://dx.doi.org/10.1002/(ISSN)1521-4095 ADVMEW 0935-9648 Google Scholar
E. Muroet al.,
“Comparing intracellular stability and targeting of sulfobetaine quantum dots with other surface chemistries in live cells,”
Small, 8
(7), 1029
–1037
(2012). http://dx.doi.org/10.1002/smll.v8.7 1613-6829 Google Scholar
M. Helleet al.,
“Visualisation of sentinel lymph node with indium-based near infrared emitting quantum dots in a murine metastatic breast cancer model,”
PLoS One, 7
(8), e44433
(2012). http://dx.doi.org/10.1371/journal.pone.0044433 1932-6203 Google Scholar
BiographySophie Bouccara is currently a PhD student at the Laboratoire de Physique et d’Étude des Matériaux. She received her MSc in optics for biomedical applications from the Université Pierre et Marie Curie in 2011. Her research focuses on the combination of the synthesis of near-infrared fluorescent biological probes with time resolved widefield microscopy in order to follow metastatic cells migration in vivo. Alexandra Fragola is an assistant professor at Pierre et Marie Curie University, where she obtained a PhD in 2003 under the supervision of Claude Boccara and Lionel Aigouy in near-field microscopy. At the Laboratoire de Physique et d’Étude des Matériaux, she is currently developing super-resolution fluorescence microscopes for live cell and in vivo imaging, using time-gated detection, structured illumination techniques, and adaptive optics. Emerson Giovanelli is currently a teaching assistant in the quantum dot group of the Laboratoire de Physique et d’Etude des Matériaux at ESPCI ParisTech. He graduated from the French Grande Ecole Chimie ParisTech, together with a MSc in organic chemistry from University of Paris VI (2003), and received his PhD from University of Paris XI (2008). His research focuses on quantum dots’ surface chemistry and functionalization for water solubilization and in vivo applications. Gary Sitbon is currently a PhD student at the Physics and Materials Study Laboratory, Paris. He received his Msc in nanomaterials science from Pierre and Marie Curie University, Paris, in 2011. His current research focuses on the synthesis of magnetic and fluorescent nanocrystals for biomedical applications in order to guide the surgical intervention. Nicolas Lequeux is a professor of solid chemistry at the Ecole Supérieure de Chimie et Physique Industrielles of Paris. He received a PhD degree from University Paris-Sud (1990) and has been at ESPCI since 1991. His research focuses on chemistry of materials (ceramics and cements) and more recently on inorganic nanoparticle synthesis and functionnalization. Thomas Pons is a research scientist at the Laboratoire de Physique et d’Étude des Matériaux. He received his PhD in 2004 from Université Pierre et Marie Curie under the supervision of Jerome Mertz. After a postdoctoral fellowship at the Naval Research Laboratory under the direction of Hedi Mattoussi, he joined the LPEM where he is currently developing multifunctional quantum dot and nanoparticle probes for biological applications, including cellular and in vivo imaging. Vincent Loriette is a research scientist at the Laboratoire de Physique et d’Étude des Matériaux. He received his PhD in astrophysics in 1995 from Université Denis Diderot under the supervision of Claude Boccara. Until 2007, he was developing the optical metrology instruments for the Virgo project (gravitational wave detector). He is currently developing fluorescence microscopes with the extended spatial resolution or wide field optical sectioning properties. |