
|
|
1.IntroductionIntrinsic absorption and scattering limit the penetration of light within tissue, and thus place barriers on applications such as optical imaging, diagnostics, and therapy. Recently, tools and techniques have been developed for optical neural stimulation based upon visible1 and infrared (IR) light.2,3 Neural stimulation based on optogenetic techniques utilizes light-activated ion channels that respond to visible or two-photon IR wavelengths;4 IR neural stimulation is a another method that is believed to evoke neural signals by heat-induced changes in membrane capacitance.5,6 When light is delivered externally in these applications, tissue attenuation hinders access to neural structures in deeper layers of cortex or subcortical structures of the brain, or the innermost regions of large nerves. Optical neural stimulation has gained a lot of interest in the study of neuronal information processing, neuroprosthesis, etc. Cell-type specificity (for optogenetics), long-term viability and the lack of stimulus artifact are several reasons that make optical methods more appealing than electrical-based strategies.2,7 Targeted spatiotemporal triggering is desired for comprehensive systematic neural activation, as has been demonstrated with the thoroughly documented Utah electrode array for electrical stimulation.8 For optical stimulation, prominent neural interfaces either involve single/few probes for deep-localized light delivery or micro-light-emitting diode (LED) arrays for spatially addressed high-resolution patterned surface illumination.7,9,10 Advanced interfaces, though still having limited stimulation sites, include injectable wireless micro-LEDs, optetrodes, and coaxial optrodes.11–13 Recently, three-dimensional (3-D) multiwaveguide arrays combining deep-tissue and increased multisite light delivery have been reported in Refs. 1415.16.–17; these devices have yet to be characterized and tested in tissue. Here, we demonstrate that the Utah optrode array devices effectively mitigate the optical attenuation by media into which the arrays may be implanted and produce emission profiles suitable for neural stimulation. 2.Optrode Array ArchitecturesSilicon and fused silica (glass) optrode arrays shown in Fig. 1 were previously manufactured and bench-tested.14,15 Geometrical aspects of the arrays can be tailored for specific applications, but typical array sizes are on a 400-μm pitch, with optrode widths of about 100 μm and lengths ranging from 0.5 mm to several millimeters. Based upon current fabrication methods, glass arrays have constant optrode length within the array, but optrodes in silicon arrays can be of constant length or can vary in length along one direction (e.g., forming a “slant” array). When fabricated with methods adopted from electrical arrays,18 silicon optrodes are missile-shaped with little design flexibility. However, modifications on this fabrication method are needed for glass optrodes,15 which have square shanks with pyramidal tips and can take on any combination of width, length, and tip angle. This modified process can be adapted to silicon optrodes as well. The light transmission efficiency and profiles projected into air were previously characterized,14,15 but these properties may change when arrays are implanted in tissue. Over 90% transmission efficiency can be achieved with 1.5-mm-long glass optrodes in air, with output beam full-angle divergence in the range of 16 to 60 deg; 1.5-mm-long tapered silicon optrodes in air transmit nearly 40% of the input power with output beam full-angle divergence of about . In tissue, optrode arrays are intended to circumvent attenuation while delivering spatially addressable light patterns. Each optrode acts as an independent optical waveguide, but as currently implemented, these waveguides lack cladding layers which serve to reduce interface scattering losses and isolate the guided mode from external media. Nevertheless, we show that even without a cladding layer, optrodes transmit light through tissue with high efficiency. Although the optrodes are invasive and may cause tissue damage, preliminary histological analysis evaluates the damage as comparable to that resulting from implantation of the Utah electrode array, which is the only U.S. Food and Drug Administration (FDA)-approved neural array interface at present.19 In principle, various optical sources such as fiber-coupled lasers, micro-LED arrays, light through spatial light modulators and lensed arrays, and scanning microscopes can be used with these optrode devices. 3.Optrodes Transmit Light through Tissue with High EfficiencyGlass arrays with optrodes of 120-μm width were implanted in slices of fixed mouse brain, fresh mouse brain, frog sciatic nerve, and agarose. In mouse brain, the targeted region was limited to the cerebral cortex; it has been shown that different mouse brain regions exhibit different optical properties that affect light propagation within the tissue (e.g., attenuation coefficient at 453-nm wavelength of in cerebellum compared to in CA3).20 Fresh tissue samples were excised immediately from sacrificed animal subjects and were submerged in phosphate buffered saline (PBS) solution; samples were also constantly moistened with PBS from a micropipette during the experiment. Fixed mouse brain was prepared by standard immersion fixation using 10% formalin (excised tissue was immediately immersed in the fixative of volume that of tissue and tightly sealed in a bottle at room temperature for ). The thickness of each sample slice was slightly less than the length of the optrodes (1.5 mm), such that the optrode tips were exposed to air. The tips were then inserted through aluminum foil in order to isolate the power emitted from just the tips. White light was coupled through the 170-μm-thick array backplane into individual optrodes via a 50-μm core, 0.22 NA multimode optical fiber. The output power from the tips was captured by an integrating sphere and normalized to the power emitted from the in-coupling fiber alone. Figure 2 plots the resulting normalized output power from optrodes surrounded by various media. These results demonstrate that transmission is relatively independent of the surrounding tissue optical properties, which suggests that light penetration depth is primarily dictated by the optrode length. In the absence of penetrating waveguides, light propagation through tissue was previously shown to drastically attenuate with depth and vary with wavelength; blue and red light through 1-mm-thick mouse brain were shown to decrease to 8% and 27% of the input power, respectively.21 From a physiological perspective, the small reduction in the transmission through optrodes in tissue can be compensated by increasing the source power with minimal risk of tissue damage or spurious stimulation. Note, however, that when tips are also surrounded in tissue, the power emitted from the tips may be higher than measured in air; the smaller refractive index mismatch leads to (1) reduced Fresnel reflection loss and (2) a greater critical angle between the optrode and tissue, which decreases backreflection due to total internal reflection within the tips and thus increases the amount of light refracted into the tissue. Fig. 2Transmission efficiency through optrodes implanted into different tissues and phantoms. A 1.5-mm-long glass optrode emits of the input light through the tip nearly independent of the surrounding medium or input wavelength. Each trace is the average of transmission through 10 independent optrodes. 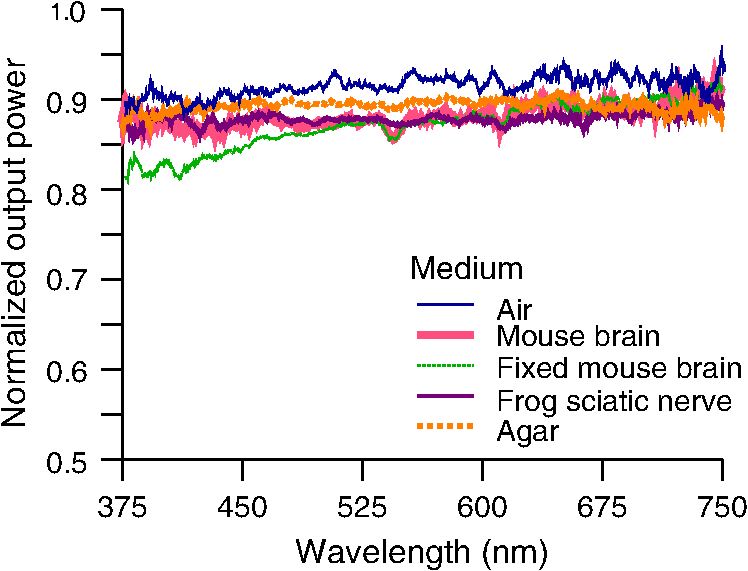 Although there appear to be only minor differences among the transmission measurements, closer analysis reveals that the transmission through the optrodes actually mirrors the attenuation spectrum of the implantation medium, but with about 3 orders of magnitude reduced effect. This is evident when the measurements in Fig. 2 are normalized to the transmission through optrodes in air to factor out extrinsic losses. Further measurements for comparably sized glass and tapered silicon optrodes utilized a white light source and a tunable telecommunications laser; results are limited to the wavelength ranges of the optical sources, as shown in Fig. 3. Fig. 3Measurement and simulation results for transmission through 1.5-mm-long optrodes in tissue/water normalized to optrode transmission into air (left axis). Light attenuation in tissue/water without optrodes is also plotted (right axis, log scale). Transmission through optrodes is dependent on the optical properties of the surrounding media (e.g., tissue), but the effective attenuation by tissue is reduced by 2 to 4 orders of magnitude.  A simple analysis can be performed to model the effects of tissue optical properties on the transmission spectrum through an optrode. In the analysis, the two-dimensional waveguide geometry is reduced to that of a symmetric one-dimensional slab waveguide in order to simplify the eigenvalue problem of solving for the guided modes. Optical properties of the optrode materials and surrounding media (e.g., refractive index and absorption) were maintained in a look-up table according to wavelength.22–28 For different wavelengths, the confinement factor of each guided mode was calculated. Reduced attenuation constants were computed by multiplying the tissue attenuation (i.e., combined absorption and scattering) by (); the maximum expected optrode sidewall scattering coefficients29 were then added to derive effective attenuation coefficients (). The fractional power emitted with each mode was determined using Beer–Lambert’s law with the corresponding . For tapered silicon optrodes, ray angles along the waveguide continually increase after each reflection, creating radiation loss along the taper due to unbounded rays; the radiation loss fraction30 per mode was also deducted from the transmission. The overall transmission through an optrode is then the weighted average across the modes, calculated according to the source power angular distribution, which determines the mode excitation distribution. The angular source distribution was determined from the actual in-coupling optical fiber having a 50-μm core diameter with a measured numerical aperture (NA) of 0.17. The angular distribution of the input power was modeled as a Gaussian in the form where andHere, is the optrode refractive index, is the angle with respect to the optical axis, is the input wavelength, and NA is the numerical aperture of the source (i.e., the in-coupling fiber in this case). Figure 4 shows that the model closely fits the measurements in air with input wavelengths of 640 and 1550 nm taken at discrete angles. From this source, the fraction of power that directly couples to nonguided rays was subtracted from the overall transmission to obtain the normalized output power with respect to the power delivered by the fiber (i.e., not to the power entering the optrode). All simulation results were further normalized to the corresponding calculations in air. These normalized curves are also plotted in Fig. 3 with the wavelength dependence similar to that of the measured values. Even though there is some discrepancy between the calculated and measured results, there is good qualitative agreement between the two in that features due to hemoglobin (around 410 nm) and water (around 1550 nm) absorption are clearly evident, and the scaling of attenuation with wavelength due to tissue scattering is consistent. The difference between measured and computed values may be due in part to the neglect of skew rays in the optical model or from the tissue attenuation models, which vary in the literature. The variation in the model values for the same tissue type at the same wavelength ensues from differences in measurement methods, ambient condition changes, and site-to-site, time-to-time, and sample-to-sample diversity. For example, based on the limited data on mouse cortex, the attenuation coefficient ranges from to 300 cm at wavelengths between 450 and 500 nm.7,20,31 Nonetheless, our simple model is useful in predicting the attenuation of light through optrodes in various media, and in predicting the performance of optrodes in potential applications of tissue spectroscopy. Fig. 4Angular distribution of input power from 50-μm in-coupling fiber with a measured 0.17 NA. Data points are measurements with 640- and 1550-nm input wavelengths () in air; line is Gaussian model used for simulations using an “average” wavelength as a fitting parameter.  To show clearly that the attenuation through optrodes is dramatically lower than that through tissue alone, attenuation coefficients of various loss mechanisms are plotted in Fig. 5. We first consider the optrode sidewall surface scattering coefficient.29 Scattering is higher for rougher surfaces and greater refractive index contrast; glass and silicon optrode sidewalls have 22- and 4.4-nm root mean square surface roughness, respectively, as measured by atomic force microscopy. Although the silicon-tissue interface has a significantly higher index contrast, the higher surface roughness of glass optrode shanks contributes considerably more to scattering; nevertheless the predicted scattering coefficient for glass optrode is . The scattering coefficient also decreases with increasing wavelength, which means that greater scattering occurs when using shorter wavelengths. Regardless, surface scattering for both glass and Si optrodes is negligible compared to the effective scattering and absorption of representative tissue components. Tissue chromophores absorb light and scattering occurs due to mismatches in refractive indices of different tissue components and structures. The attenuation spectrum for mouse brain is also plotted in Fig. 5 from data in Refs. 2526.27.–28. Mouse brain is modeled as consisting of water, lipids, and hemoglobin, but its attenuation of light is dominated by water absorption in the near-IR. As outlined above, the surrounding tissue attenuation and optrode sidewall scattering determines the effective attenuation of light transmitted through optrodes. The effective attenuation follows the wavelength dependence of the attenuation of surrounding tissue, but orders of magnitude lower. The effect of the surrounding medium on light transmission is smaller for silicon optrodes because the higher refractive index of silicon confines more power within the optrode (increasing ). Fig. 5Estimated attenuation of light when transmitted in mouse brain tissue versus via optrodes in tissue. Absorption and scattering (i.e., attenuation) spectrum of tissue components compared with effective attenuation of light when transmitting through glass (a) and silicon (b) optrodes. Dominant attenuation components include tissue scattering26,27 and absorption by water, lipids, and hemoglobin.25  4.Optrode Emission Profiles Fulfill Illumination Requirements for Neural StimulationEmission profiles from the optrodes were reconstructed from output beam images captured by a CCD camera or a beam profiler at varying distances from the tips and through tissue. Optrode arrays implanted into tissue, with tips exposed, were again used. However, additional 100- to 400-μm slices of fixed mouse brain were placed over the tips, from which the 2-D spatial power distributions of light at the tissue/air interface were imaged, as illustrated in Fig. 6. The 2-D images from the different tissue thicknesses were used to interpolate the volume of illumination as light propagates into tissue from the optrode tips. This volume necessarily depends on the beam width at the tip, the beam divergence, and tissue attenuation. For the purposes of optical neural stimulation, we define the illumination volume by the volume where the intensity is greater than of its maximum value at the tip exit. Note that in contrast to measurements in tissue, the emitted beam propagation parameters in air (i.e., width and divergence) can be directly determined by the beam profiler without recordings at multiple distances from the optrode tips. Fig. 6Optrode array tips were inserted into additional slices of tissue. Light is transmitted through the optrodes and into the tissue surrounding the tips. A camera or beam profiler then captures the two-diemsional (2-D) profile of the light at the tissue-air interface. Different tissue thicknesses correspond the varying propagation distance from the tips.  The beams projected from the optrode tips were assumed to propagate as Gaussian-like beams. The 2-D power profiles in tissue measured at different distances from the tip were used in fitting the parameters of Gaussian beam propagation. Section 4.1 details the Gaussian beam properties and output beam reconstruction. Measured data points and Gaussian-fit approximations for different wavelengths are shown in Fig. 7 for three sets of optrodes, including silicon and 150-μm-wide glass with 45 and 30 deg tips (tip angle with respect to optical axis; 30 deg being sharper). The estimated beam propagation in a lossless homogeneous medium is also plotted in Fig. 7 (with divergence length ) for reference, as extrapolated from beam profile measurements in air (beam width smaller than measurements in tissue due to lack of tissue scattering). Note that, while the fits are based on data only up to depths where measurements were made (400-μm maximum depth), extrapolation is presumed accurate up to the “transport” scattering length (), where scattering becomes truly random. Because tissue components (e.g., cells) are of comparable size to visible, IR wavelengths, scattering is mostly in the forward direction; brain tissue scattering length (; average distance between scattering events) is 50 to 200 μm from the blue to NIR range and anisotropy (; amount of forward direction retained) is high at , which leads to of 0.5 to 2 mm.26,32 At depths beyond , light intensity is expected to diminish drastically, and we truncate the Gaussian fit at that distance (e.g., for blue and for yellow21). However, Monte Carlo simulations in tissue, more importantly in mouse brain illuminated by a divergent light source, suggest that light propagation follows a Gaussian model (i.e., beam width broadens according to Gaussian propagation) even beyond and at depths where normalized intensity falls to .33,34 Fig. 7Reconstructed beam profiles into fixed mouse brain for different wavelengths emitted by 45-deg tip glass, (b) 30 deg tip glass, (c) silicon, and (d) optrodes. Effective stimulation volume is dependent on both illumination volume and incident power; intensity decays (exponential fit) into the medium at different rates for various wavelengths, optrode geometry and tissue properties. (a) In the beam width plots, symbols are measured data and lines are Gaussian-fit extrapolations (terminated at the transport scattering length; see line for 470 nm). Full-angle divergence () and divergence length (, within across all wavelengths) are indicated. Expected propagation for loss medium extrapolated from bench tests in air is also shown in dotted lines ( labeled as ). Data points are average of five measurements. 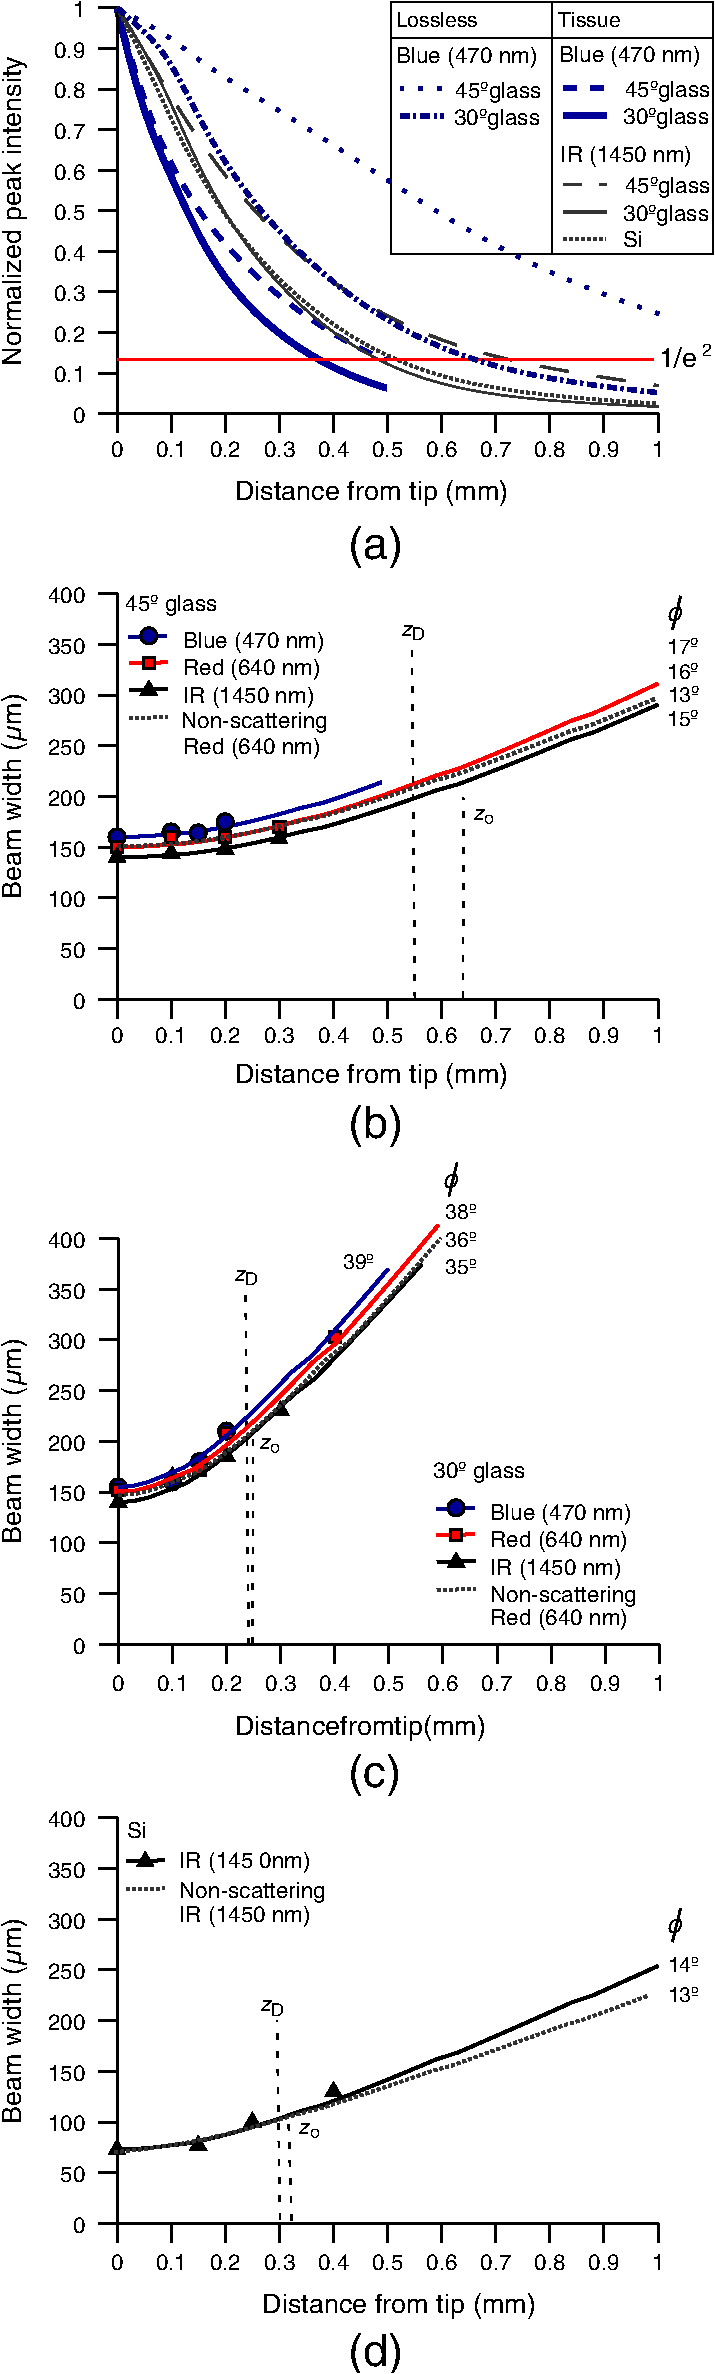 The wider beam and its faster broadening for shorter wavelengths are indications of the higher scattering in tissue (also previously observed in Monte Carlo simulations and experimental data21,33). The results show that 45-deg-tip glass optrodes provide a more uniform illumination volume through the tissue depth with a divergence length about twice that of the sharper glass optrodes; 30-deg-tip glass optrodes are suitable for wider and shallower illumination. Note that the fabrication method used for glass optrodes enables a high degree of customization because the output beam width can be varied independently from the divergence by changing the optrode width and tip angle, respectively.15 We define an effective stimulation volume based upon the exponential intensity decay along the lateral and axial directions from the optrode tips. While ultimately determined by the local intensity compared to the threshold intensity for activation, the maximum practical depth of stimulation is approximately the intensity distance or the transport scattering length, whichever is shorter. Beyond this distance, achieving above-threshold intensity would require large increases in incident power that could cause tissue damage near the tip and only lead to marginal increase in stimulation depth. Normalized intensity with respect to the tip (i.e., 0-mm distance) at various depths changes with the optrode and wavelength used, as shown in Fig. 7. Notice that a smaller (Si compared with 45-deg glass) or more divergent (30-deg glass compared with 45-deg glass) incident beam results in greater intensity decay rate, which is consistent with theory. The plots in Fig. 7 provide the beam spread and intensity decay characteristics, and the effective stimulation volumes summarized in Table 1. Beam profile requirements vary by application, but optrodes can produce various stimulation area and depth combinations; some examples are presented in Sec. 4.2. Table 1Summary of tip output beam width (2w0) at 13.5% of peak power, divergence length (zD), divergence angle (ϕ), 1/e2 intensity depth (z1/e2), and beam width at 1/e2 intensity depth (w1/e2) for transmission of wavelengths of 470, 640, and 1450 nm. Different optrodes (tip taper angle of 45 or 30 deg with 150-μm-shank width glass optrode and 1-mm-long silicon optrodes) and an in-coupling fiber of 50 m was used.
4.1.Gaussian Beam Reconstruction of Optrode Output BeamsPropagation of a Gaussian beam mode follows where is the radius of the contour along the propagation distance , is the beam waist (i.e., smallest beam radius at ), and is a quality factor used to describe the deviation from a theoretical Gaussian. For a single Gaussian beam mode, and the Rayleigh distance , with the wavelength. A multimode Gaussian beam can be modeled with higher values, but the “Rayleigh distance” does not necessarily follow the relationship above.35–37 Thus, we refer to a divergence length as a multimode analogue to the Rayleigh length, which is the distance at which the beam width increases by a factor of from its minimum value.From experimental measurements using tissue slices of different thicknesses, the beam width at peak power is extracted from the 2-D beam profiles and plotted against the tissue thickness; data points are then fitted into the Gaussian propagation model using and as fitting parameters. Example 2-D profiles in tissue are shown in Fig. 8. Figure 9 shows an intensity-gradient representation of the 45-deg-tip glass optrode emission profile () in tissue plotted against both radius and depth of propagation; propagation from the same optrode adjusted for a lossless medium is also shown for comparison. The intensity maps are derived from the Gaussian-fit beam spreading and power versus depth measurements plotted in Fig. 10. The Gaussian propagation model applied to the optrode output beam is a reasonable approximation for both lossless and scattering media, but scattering noticeably affects the spatial extent of illumination. Fig. 8Output 2-D power profiles imaged by the beam profiler in fixed mouse brain at planes perpendicular to propagation. The optrode tip is physically located at , , , 0, 0. Example images shown are for 45-deg tip glass optrodes using a wavelength of 640 nm; , scale is from to 200 μm. Gaussian fit propagation has . 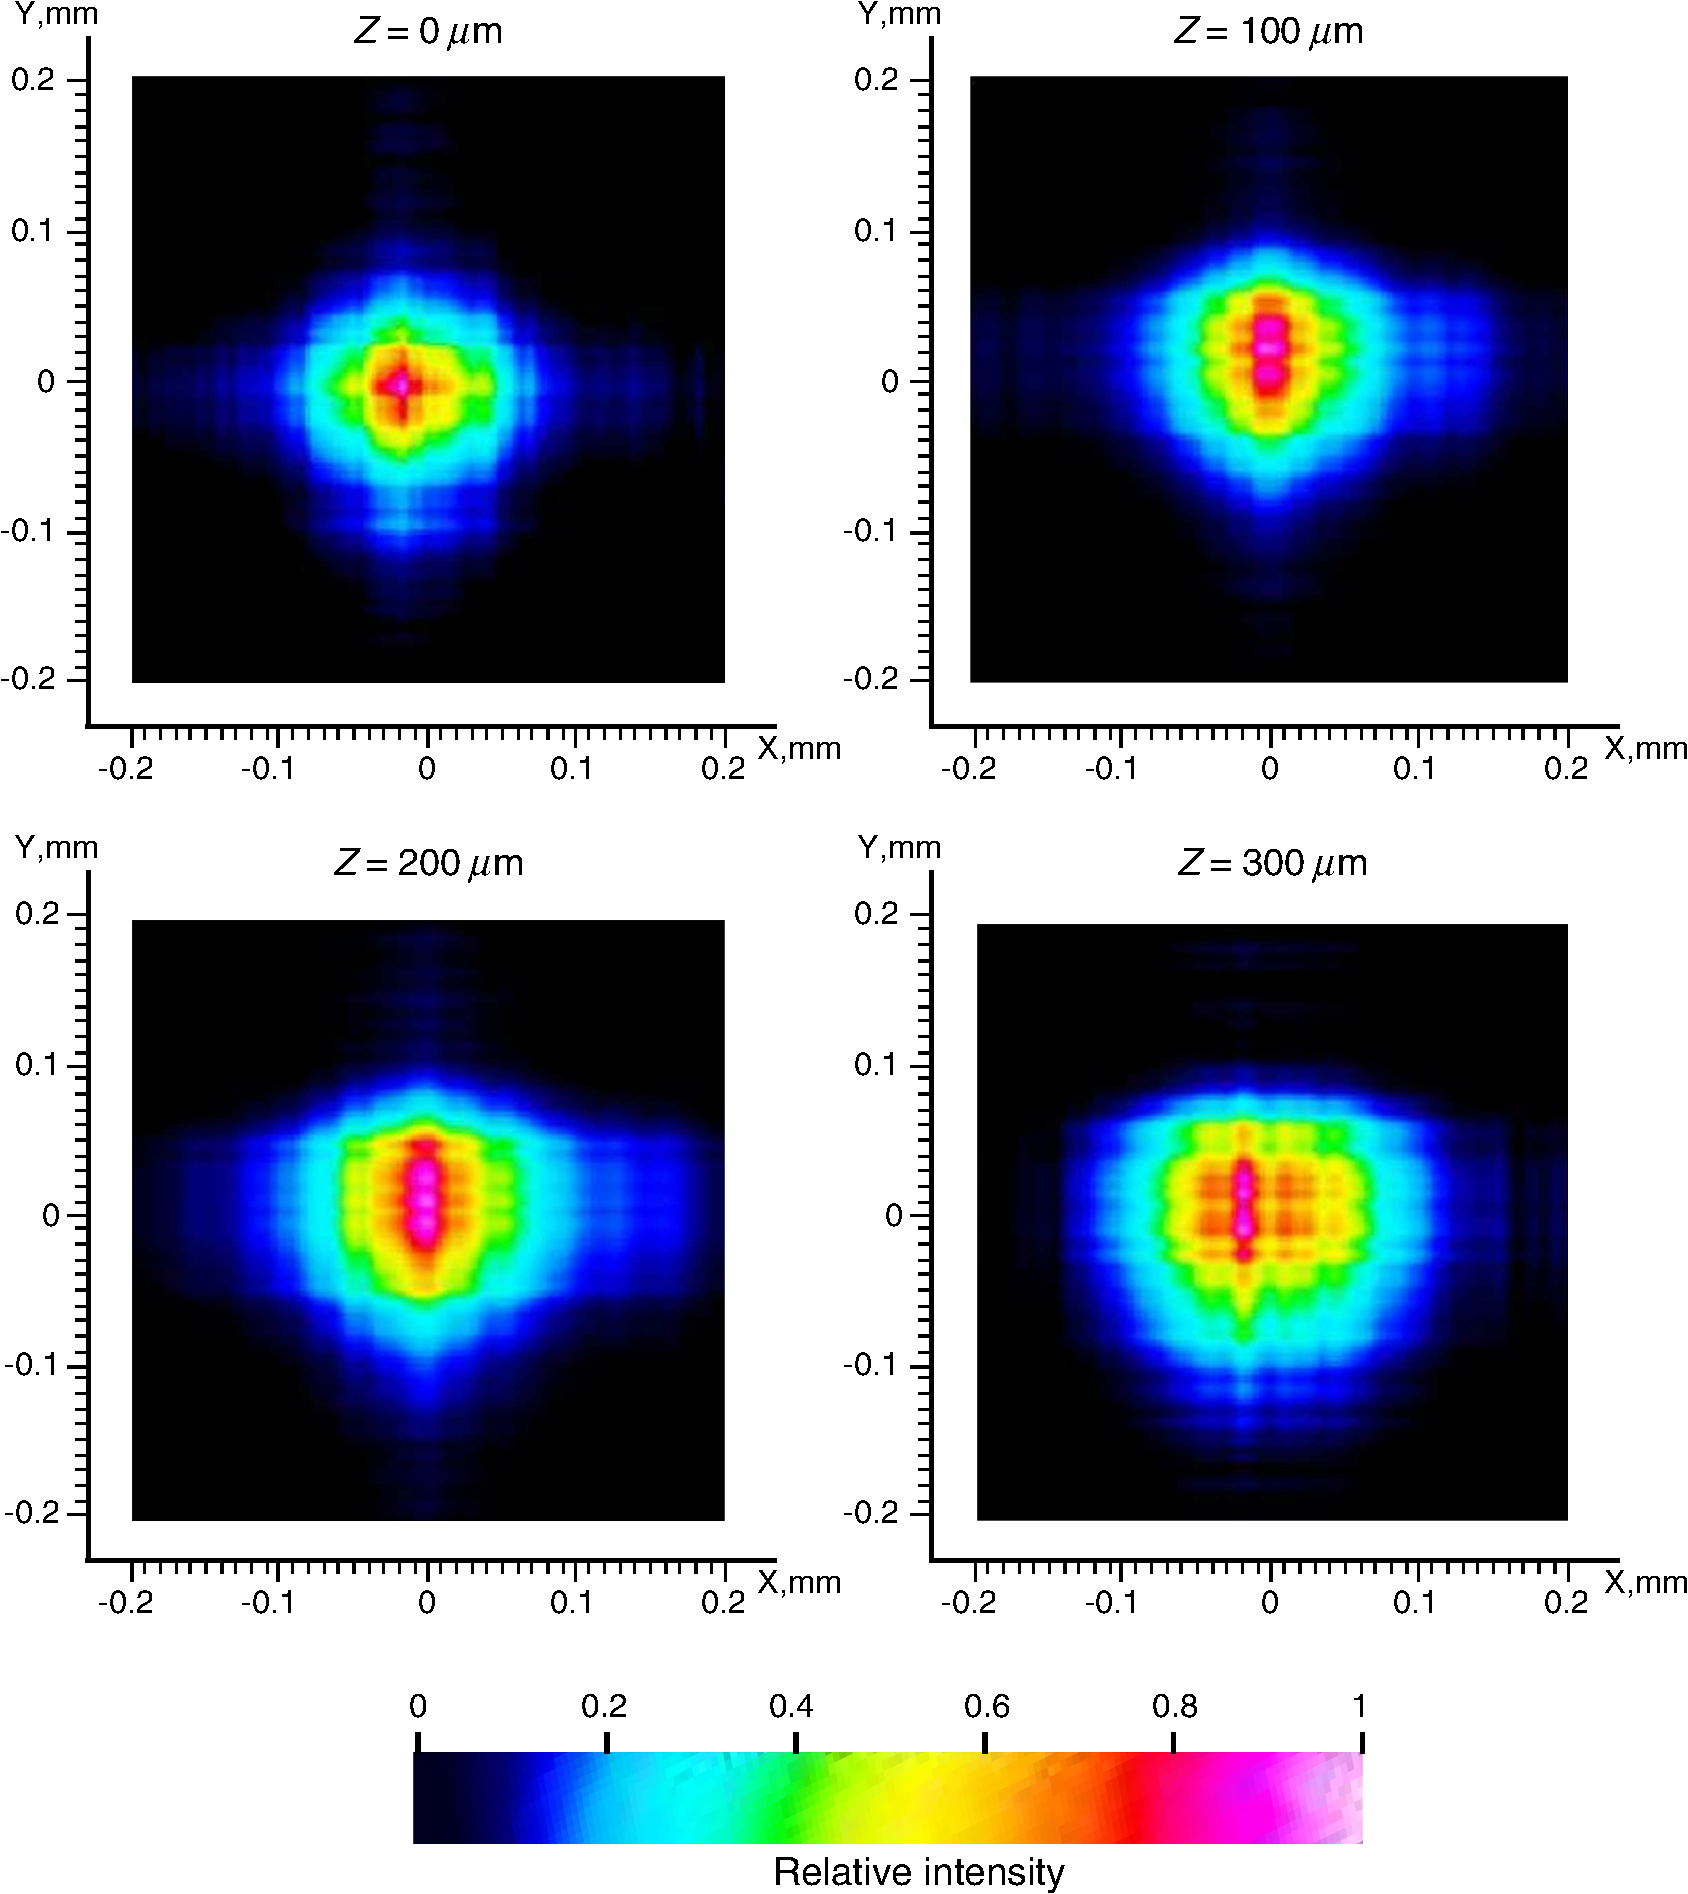 4.2.Potential Applications of Optrode Arrays across Experimental Paradigms Requiring Different Illumination Volumes and ProtocolsIn-vitro optogenetic experiments have demonstrated action potential firing by illumination of a cell body; a spot as small as 5-μm wide can evoke action potential trains, but larger spots up to 15-μm wide increased the spiking rate, photocurrent and response time.38 Further, widening of the spot can cause additional axonal/dendritic excitation by illuminating the soma (i.e., cell body) and surrounding axons/dendrites of the neuron. 30-μm diameter blue spots were generated from a μLED array to perform multisite dendritic excitation that can sustain spiking for the investigation of physiological information flow in hippocampal slices.10 The capability to control multiple points in the neural network is the basis of artificial replication of functional processes. This experiment can be translated into an in-vivo paradigm by accessing the hippocampus in intact brain using arrays consisting of less divergent thinner optrodes for -sized illumination volumes. Presently, in-vivo optical studies of hippocampus require removal of the overlaying cortical region due to penetration depth limitations. Arrays may also benefit other studies in in-vivo hippocampus such as the inhibition of epileptiform activity by delivering light to the CA1 and CA3 regions, which are 500- to 1000-μm wide in mouse.39 Here, however, the larger localized area may need -wide spot; arrays with micronwide optrodes are still useful because simultaneous illumination of 30-deg-tip glass optrodes allow an approximately uniform illumination layer inside tissue with adjoining profiles from adjacent optrodes. Note that wide-field irradiance is also common in attaining conduction threshold levels for optogenetic stimulation of sparse targets. Many other optogenetic experiments involve the neocortex, which is a highly nonuniform 3-D structure. Neocortex in mammals consists of up to six layers of different neuronal subtypes with a total thickness of 0.5 to 1 mm in rodents to about 1.5 to 2 mm in primates. The neurons in the outermost layers I to III project within the neocortex, while the innermost layers V and VI mostly project to the thalamus, brain stem, and spinal cord; however, neurons in layer VI receive all sensory information to the neocortex. It is commonly accepted that these layers are organized in columns, which comprise the basic functional units; primates have column diameters of roughly 0.5 mm, to which the optrode array pitch can be matched. Cholinergic signaling in the neocortex was studied using optogenetic two-photon microscopy in the IR, which only penetrated layers 1 to 3.40 Direct blue irradiation with glass optrodes could extend the stimulation depth. In contrast to multilayer coverage, stimulation within a single layer is desired, such as in exciting and/or inhibiting pyramidal cells in layers II/III and V/VI of the visual cortex for outputs to cortical and subcortical areas, respectively. These layers are 150 to 500-μm thick and lie from 200 to 500 μm inside rodent neocortex, and thick and deep into primate neocortex.41 Optrode length can be adjusted to access specific layers for these types of studies, and tip angle can be chosen to control stimulation depth. Hippocampal–neocortex interactions may now be studied further with the use of optogenetics with optrode arrays. In rodents for example, the optrode array would enable access to hippocampus through the cortical layer, preserving communications between hippocampus and neocortical structures. Memory consolidation, sleep-related motor activity and context discrimination are example functions of such communications.42–44 Although information transfer has been substantially established, the means and roles of local circuits remain ambiguous. With cell-type specificity of optogenetics and the access provided by the optrode arrays, simultaneous probing of isolated characteristic neuronal populations could be performed to observe distinct input-output relationships between the different hippocampal and cortical regions. Context discrimination regarding memory recall of fear has already been associated with specific neurons in the hippocampus via optogenetics, and optrode arrays may expand this type of study to include access to projections in the cortex and other hippocampal regions to confirm necessary engrams.45 There are also prominent studies based on highly-selective local firing of peripheral nerves for the restoration of sensory/motor control, which is suited for IR stimulation. For example, optical neuroprostheses via the sciatic nerve ideally require simultaneous independent access to individual axons. The sciatic nerve ranges in diameter from about 0.5 to 2 mm in rodents and 3 mm in cats, to 2.5 cm in humans. Within the nerve are fascicles, which are bundles of axons that are 200 to 400 μm in diameter; each axon has diameter. There are multiple fascicles lying hundreds of micrometers to millimeters inside the nerve. Within the nerve, activation of muscle groups can be performed through selective stimulation of axons within different fascicles, and activation of specific motor units can be obtained through selective stimulation of different axons within the same fascicle. This can be achieved with tightly confined beams from thin silicon optrodes of varying lengths illuminating different axon groups well inside the nerve.46 5.ConclusionsWe established the characteristics of light projection into tissue from microfabricated 3-D neural interface devices designed to enable patterned deep-tissue light delivery. Experimental and simulation results support the effectiveness of both glass and silicon optrodes in significantly minimizing light attenuation in tissue and providing different spatial profiles of emission for diverse optogenetic and IR stimulation requirements. Optrodes provide high-efficiency (up to ) delivery of light to tissue depths. The variety of possible input sources and optrode geometries provide a custom fit of the output beam to the stimulation target volume dictated by the application. These characteristics may be estimated using simulation models or even calculations from measurements in air to avoid cumbersome tissue tests. AcknowledgmentsThis work is supported by the University of Utah Research Foundation and NSF ECCS 1310654. We also acknowledge partial support by NSF MRSEC grant DMR 1121252. We thank Dr. Matt Wachowiak’s lab and the Center for Neural Interfaces of the University of Utah for providing us with tissue samples, and we thank the reviewers for many helpful suggestions to improve this manuscript. Florian Solzbacher has commercial interest in Blackrock Microsystems. ReferencesG. Nagelet al.,
“Channelrhodopsin-2, a directly light-gated cation-selective membrane channel,”
Proc. Natl. Acad. Sci. U. S. A., 100
(24), 13940
–13945
(2003). http://dx.doi.org/10.1073/pnas.1936192100 PNASA6 0027-8424 Google Scholar
J. Wellset al.,
“Optical stimulation of neural tissue in vivo,”
Opt. Lett., 30
(5), 504
–506
(2005). http://dx.doi.org/10.1364/OL.30.000504 OPLEDP 0146-9592 Google Scholar
K. Dhakalet al.,
“Fiber-optic two-photon optogenetic stimulation,”
Opt. Lett., 38
(11), 1927
–1929
(2013). http://dx.doi.org/10.1364/OL.38.001927 OPLEDP 0146-9592 Google Scholar
E. S. Boydenet al.,
“Millisecond-timescale, genetically targeted optical control of neural activity,”
Nat. Neurosci., 8
(9), 1263
–1268
(2005). http://dx.doi.org/10.1038/nn1525 NANEFN 1097-6256 Google Scholar
J. Wellset al.,
“Biophysical mechanisms of transient optical stimulation of peripheral nerve,”
Biophys. J., 93
(7), 2567
–2580
(2007). http://dx.doi.org/10.1529/biophysj.107.104786 BIOJAU 0006-3495 Google Scholar
M. G. Shapiroet al.,
“Infrared light excites cells by changing their electrical capacitance,”
Nat. Commun., 3 736
(2012). http://dx.doi.org/10.1038/ncomms1742 NCAOBW 2041-1723 Google Scholar
A. M. Aravaniset al.,
“An optical neural interface: in vivo control of rodent motor cortex with integrated fiberoptic and optogenetic technology,”
J. Neural Eng., 4
(3), S143
(2007). http://dx.doi.org/10.1088/1741-2560/4/3/S02 1741-2560 Google Scholar
R. A. Normannet al.,
“Coordinated, multi-joint, fatigue-resistant feline stance produced with intrafascicular hind limb nerve stimulation,”
J. Neural Eng., 9
(2), 026019
(2012). http://dx.doi.org/10.1088/1741-2560/9/2/026019 1741-2560 Google Scholar
S. Royeret al.,
“Multi-array silicon probes with integrated optical fibers: light-assisted perturbation and recording of local neural circuits in the behaving animal,”
Euro. J. Neurosci., 31
(12), 2279
–2291
(2010). http://dx.doi.org/10.1111/(ISSN)1460-9568 EJONEI 0953-816X Google Scholar
N. Grossmanet al.,
“Multi-site optical excitation using ChR2 and micro-LED array,”
J. Neural Eng., 7
(1), 016004
(2010). http://dx.doi.org/10.1088/1741-2560/7/1/016004 1741-2560 Google Scholar
T. Kimet al.,
“Injectable, cellular-scale optoelectronics with applications for wireless optogenetics,”
Science, 340
(6129), 211
–216
(2013). http://dx.doi.org/10.1126/science.1232437 SCIEAS 0036-8075 Google Scholar
P. Anikeevaet al.,
“Optetrode: a multichannel readout for optogenetic control in freely moving mice,”
Nat. Neurosci., 15
(1), 163
–170
(2011). http://dx.doi.org/10.1038/nn.2992 NANEFN 1097-6256 Google Scholar
I. Ozdenet al.,
“A coaxial optrode as multifunction write-read probe for optogenetic studies in non-human primates,”
J. Neurosci. Methods, 219
(1), 142
–154
(2013). http://dx.doi.org/10.1016/j.jneumeth.2013.06.011 JNMEDT 0165-0270 Google Scholar
T. V. F. Abayaet al.,
“Characterization of a 3D optrode array for infrared neural stimulation,”
Biomed. Opt. Express, 3
(9), 2200
–2219
(2012). http://dx.doi.org/10.1364/BOE.3.002200 BOEICL 2156-7085 Google Scholar
T. V. F. Abayaet al.,
“A 3D glass optrode array for optical neural stimulation,”
Biomed. Opt. Express, 3
(12), 3087
–3104
(2012). http://dx.doi.org/10.1364/BOE.3.003087 BOEICL 2156-7085 Google Scholar
A. N. Zorzoset al.,
“Three-dimensional multiwaveguide probe array for light delivery to distributed brain circuits,”
Opt. Lett., 37
(23), 4841
–4843
(2012). http://dx.doi.org/10.1364/OL.37.004841 OPLEDP 0146-9592 Google Scholar
K. KwonW. Li,
“Integrated multi-LED array with three-dimensional polymer waveguide for optogenetics,”
1017
–1020
(2013). Google Scholar
R. BhandariS. NegiF. Solzbacher,
“Wafer-scale fabrication of penetrating neural microelectrode arrays,”
Biomed. Microdevices, 12
(5), 797
–807
(2010). http://dx.doi.org/10.1007/s10544-010-9434-1 BMICFC 1387-2176 Google Scholar
F. V. TenoreR. J. Vogelstein,
“Revolutionizing prosthetics: devices for neural intergration,”
(2011). Google Scholar
S. I. Al-Jubooriet al.,
“Light scattering properties vary across different regions of the adult mouse brain,”
PLoS ONE, 8
(7), e67626
(2013). http://dx.doi.org/10.1371/journal.pone.0067626 1932-6203 Google Scholar
O. Yizharet al.,
“Optogenetics in neural systems,”
Neuron, 71
(1), 9
–34
(2011). http://dx.doi.org/10.1016/j.neuron.2011.06.004 NERNET 0896-6273 Google Scholar
G. M. HaleM. R. Querry,
“Optical constants of water in the 200-nm to 200-um wavelength region,”
Appl. Opt., 12
(3), 555
–563
(1973). http://dx.doi.org/10.1364/AO.12.000555 APOPAI 0003-6935 Google Scholar
M. Basset al., Handbook of Optics: Optical Properties of Materials, Nonlinear Optics, Quantum Optics, McGraw-Hill, USA
(2009). Google Scholar
V. Tuchin, Handbook of Optical Biomedical Diagnostics, SPIE Press, Bellingham, WA
(2002). Google Scholar
S. PrahlS. L. Jacques,
“Optical properties spectra,”
(2001) http://omlc.ogi.edu/spectra Google Scholar
A. N. Yaroslavskyet al.,
“Optical properties of selected native and coagulated human brain tissues in vitro in the visible and near infrared spectral range,”
Phys. Med. Biol., 47
(12), 2059
–2073
(2002). http://dx.doi.org/10.1088/0031-9155/47/12/305 PHMBA7 0031-9155 Google Scholar
X. Han,
“Optogenetics in the nonhuman primate,”
Progress Brain Res., 196 215
–233
(2012). http://dx.doi.org/10.1016/B978-0-444-59426-6.00011-2 PBRRA4 0079-6123 Google Scholar
N. G. Hortonet al.,
“In vivo three-photon microscopy of subcortical structures within an intact mouse brain,”
Nat. Photon., 7
(3), 205
–209
(2013). http://dx.doi.org/10.1038/nphoton.2012.336 1749-4885 Google Scholar
K. Yamada, Silicon Photonics IIApplied Physics, chap. Silicon Photonic Wire Waveguides: Fundamental Application, 1
–29 Springer-Verlag, Berlin Heidelberg
(2011). Google Scholar
Z.-N. LuR. BansalP. Cheo,
“Radiation losses of tapered dielectric waveguides: a finite difference analysis with ridge waveguide applications,”
J. Lightwave Technol., 12
(8), 1373
–1377
(1994). http://dx.doi.org/10.1109/50.317524 JLTEDG 0733-8724 Google Scholar
S. L. Jacques,
“Optical properties of biological tissues: a review,”
Phys. Med. Biol., 58
(11), R37
–R61
(2013). http://dx.doi.org/10.1088/0031-9155/58/11/R37 PHMBA7 0031-9155 Google Scholar
F. HelmchenW. Denk,
“Deep tissue two-photon microscopy,”
Nat. Methods, 2
(12), 932
–940
(2005). http://dx.doi.org/10.1038/nmeth818 1548-7091 Google Scholar
J. G. Bernsteinet al.,
“Prosthetic systems for therapeutic optical activation and silencing of genetically-targeted neurons,”
Proc SPIE, 6854 68540H
(2008). http://dx.doi.org/10.1117/12.768798 PSISDG 0277-786X Google Scholar
L. WangS. L. Jacques,
“MCML—Monte Carlo Modeling of Light Transport in Multi-layered Tissues in Standard C,”
(1992). Google Scholar
Technical Guide, 2.1
–2.14 CVI Melles Griot(2009). Google Scholar
J. Alda, Encyclopedia of Optical Engineering, 999
–1013 Marcel Dekker, Inc(2003). Google Scholar
R. Kapooret al.,
“An alternative approach to determine the spot-size of a multi-mode laser beam and its application to diode laser beams,”
Pramana J. Phys., 53
(2), 307319
(1999). http://dx.doi.org/10.1007/s12043-999-0130-8 PRAMCI 0304-4289 Google Scholar
E. Papagiakoumouet al.,
“Scanless two-photon excitation of channelrhodopsin-2,”
Nat. Methods, 7
(10), 848
–854
(2010). http://dx.doi.org/10.1038/nmeth.1505 1548-7091 Google Scholar
J. Tonnesenet al.,
“Optogenetic control of epileptiform activity,”
Proc. Natl. Acad. Sci., 106
(29), 12162
–12167
(2009). http://dx.doi.org/10.1073/pnas.0901915106 PNASA6 0027-8424 Google Scholar
A. KalmbachT. HedrickJ. Waters,
“Selective optogenetic stimulation of cholinergic axons in neocortex,”
J. Neurophysiol., 107
(7), 2008
–2019
(2012). http://dx.doi.org/10.1152/jn.00870.2011 JONEA4 0022-3077 Google Scholar
J. J. HutslerD.-G. LeeK. K. Porter,
“Comparative analysis of cortical layering and supragranular layer enlargement in rodent carnivore and primate species,”
Brain Res., 1052
(1), 71
–81
(2005). http://dx.doi.org/10.1016/j.brainres.2005.06.015 BRREAP 1385-299X Google Scholar
A. Sirotaet al.,
“Communication between neocortex and hippocampus during sleep in rodents,”
Proc. Natl. Acad. Sci. U. S. A., 100
(4), 2065
–2069
(2003). http://dx.doi.org/10.1073/pnas.0437938100 PNASA6 0027-8424 Google Scholar
E. J. MohnsM. S. Blumberg,
“Neocortical activation of the hippocampus during sleep in infant rats,”
J. Neurosci., 30
(9), 3438
–3449
(2010). http://dx.doi.org/10.1523/JNEUROSCI.4832-09.2010 JNRSDS 0270-6474 Google Scholar
S. J. MizumoriD. M. SmithC. B. Puryear,
“Hippocampal and neocortical interactions during context discrimination: electrophysiological evidence from the rat,”
Hippocampus, 17
(9), 851
–862
(2007). http://dx.doi.org/10.1002/(ISSN)1098-1063 35LUAN 1050-9631 Google Scholar
X. Liuet al.,
“Optogenetic stimulation of a hippocampal engram activates fear memory recall,”
Nature, 484
(7394), 381385
(2012). http://dx.doi.org/10.1038/484410a NATUAS 0028-0836 Google Scholar
G. A. Clarket al.,
“Selective, high-optrode-count, artifact-free stimulation with infrared light via intrafascicular utah slanted optrode arrays,”
Proc. SPIE, 8207 82075I
(2012). http://dx.doi.org/10.1117/12.907627 PSISDG 0277-786X Google Scholar
|
|||||||||||||||||||||||||||||||||||||||||||||||||||||||||||||||||||||||||||||||


