|
|
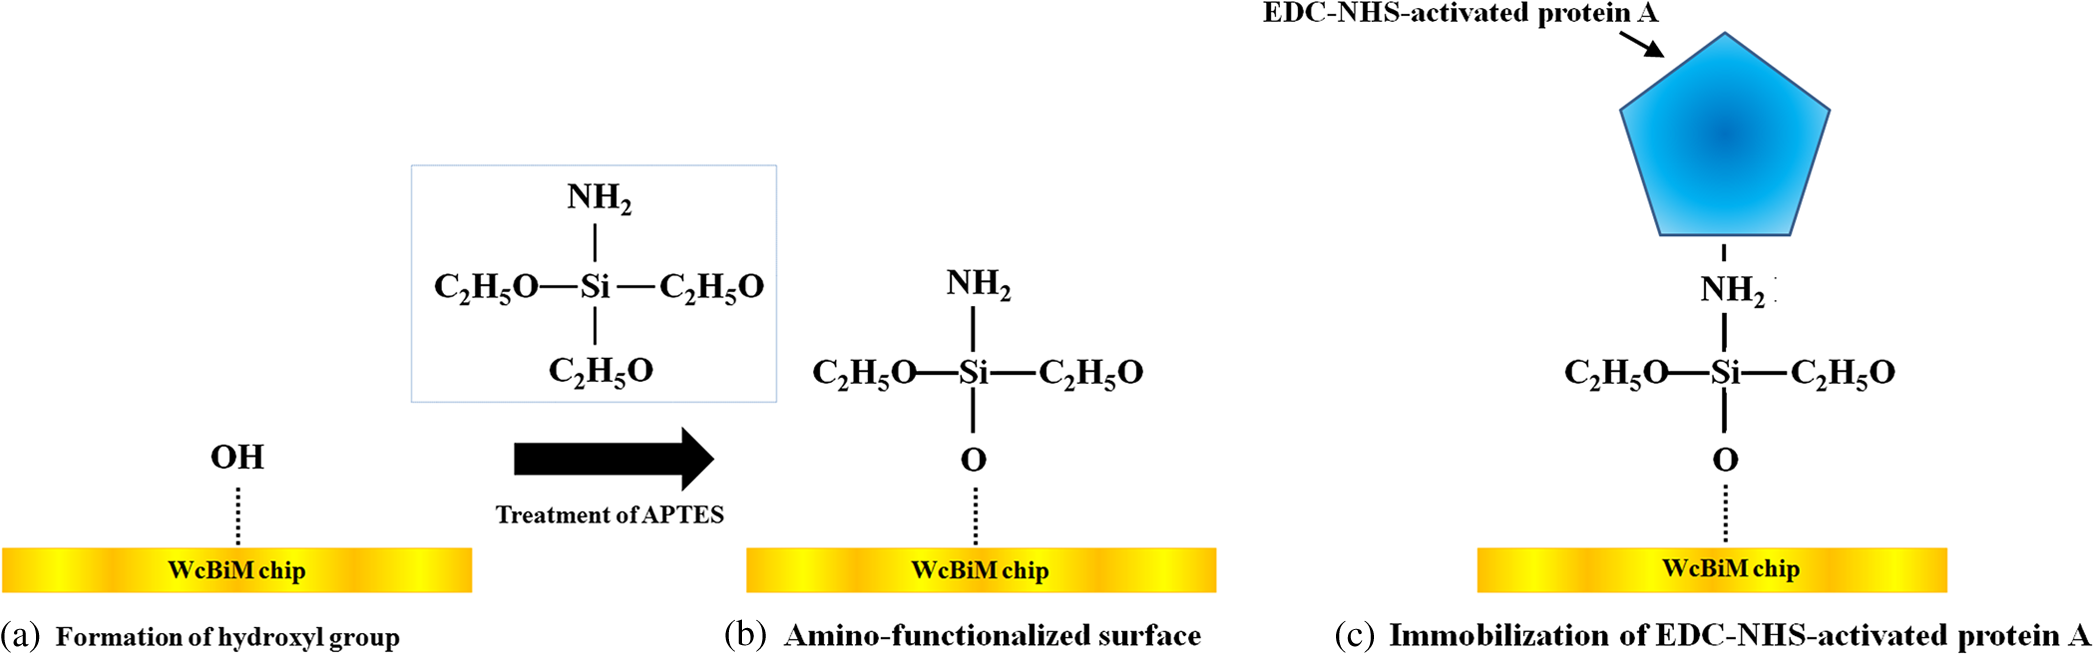
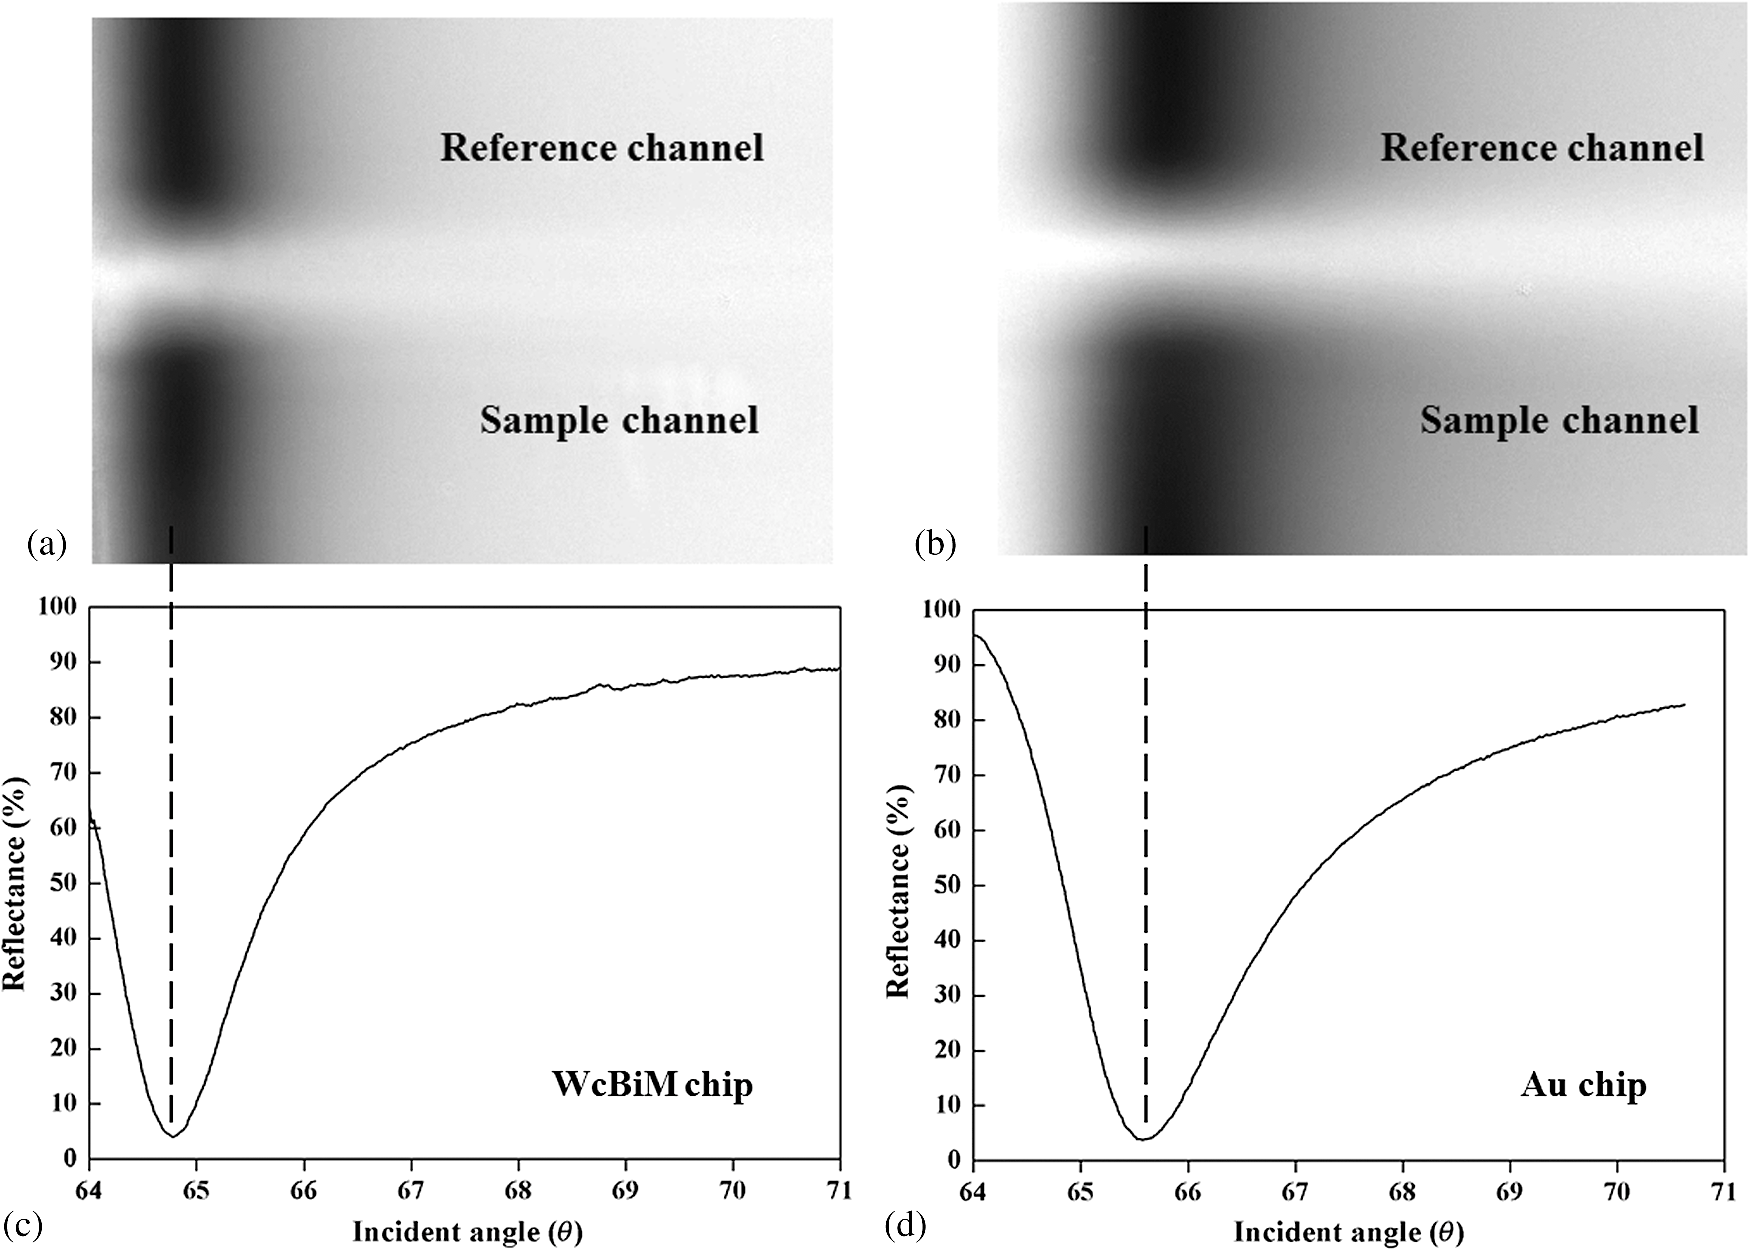
1.IntroductionIncreases in the average lifespan due to recent developments in biotechnology highlight the need to improve the quality of human life as people age. To improve the quality of human life, devices are required that are capable of screening diseases at an early stage before the person shows symptoms. Early detection not only offers a better chance of a cure but also a reduction in medical costs.1,2 Thus, the development of reliable and highly sensitive detection technologies is needed. Biosensors are compact analytical devices that incorporate bioreceptors with physicochemical transducers, which detect an analyte that may be a biomarker.3 Modern nanotechnology has allowed the production of biosensors that are faster, ultrasensitive, and portable.4 Among biosensors, label-free detection is preferable compared to labeling detection mechanisms, such as attaching a fluorescence tag to biomolecules.5 The former does not require any additional chemical processing and can preserve the intrinsic properties of biomarkers or bioreceptors.6 Label-free biosensors include field-effect transistors,7,8 quartz crystal microbalance,9 and surface plasmon resonance (SPR).6,10–13 It has been reported10–13 that SPR sensors of label-free biosensors are very sensitive to any change in the refractive index. The Kretschmann configuration of the attenuated total reflection method consists of an optical prism, an SPR metal layer, and a sensing layer. The incident light passes through the prism. At a certain incident angle, the incident light wave and the surface plasmon wave are matched giving rise to SPR. Consequently, the reflected light exhibits minimum intensity at a certain incident angle (SPR angle), with an SPR dip in an SPR reflectance curve. The sensitivity of the sensor and the resolution of the SPR sensor are determined by the properties of the SPR reflectance.10–12 Typical measurement modes of the SPR sensor are angular interrogation and intensity measurement.10,11 The angular interrogation measures the change in the SPR angle including any shift in the SPR reflectance curve. The intensity interrogation measures the reflectance at a certain fixed angle. Among these two measurement modes, the intensity interrogation is advantageous for miniaturization of devices. The intensity interrogation mode results in a larger change in the reflectance when a sensor chip with a narrower full width at half maximum (FWHM) and steeper slope in the SPR curve is used. The use of waveguide-coupled bimetallic (WcBiM) chips has been proposed6 because the conventional Au (gold) chips cannot detect low levels of biomolecules. The WcBiM chip has a much narrower FWHM and a steeper slope than the Au chip. The -terminal part of protein A has nearly five homologous domains, namely E, D, A, B, and C domains in order. These domains consist of approximately 58 residues and contain binding sites to the Fc region of the antibody of immunoglobulin gamma (IgG). The COOH-terminal part is thought to be a cell wall binding domain. Thus, protein A can be used as a linkage layer. However, if the protein A is randomly formed on the sensor chip, then the antibody is also randomly immobilized. Thus, in order to enhance the detection capability, protein A should be formed directionally on a sensor chip surface. The directionally formed protein A can immobilize the anti-IgG in an oriented direction, so that Fab region of anti-IgG can face away from the sensor surface, resulting in increasing the detection capability.14–16 For the site-directional immobilization of protein A, the amine () group is functionalized on the sensor chip by using the 3-aminopropyltriethoxysilane (APTES).17,18 The carboxyl group of the protein A is activated by using the catalyst (3-dimethylaminopropyl)-3-ethylcarbodiimide (EDC)/sulfo-N-hydroxysuccinimide (sulfo-NHS). EDC-NHS-activated protein A is captured on the -functionalized sensor chip, and the protein A was immobilized on the surface with Fc-binding domain facing away from the sensor surface. This increases the probability of site-directed antibody immobilization on the surface and improves the likelihood of antigen-antibody interactions.14–16 Proteins G and A are widely used to enhance the sensitivity of the biosensor since they have Fc-binding domains. Cysteine residues was genetically introduced at the N-terminus of protein G.19 This cysteine-tagged protein G enables better oriented immobilization of antibodies to enhance target analyte detection. Protein A was coupled to a gold binding peptide to provide the oriented immobilization of antibodies.20 In order to engineer such a cysteine-tagged protein G and a protein A fused with gold binding peptide, a polymerase chain reaction (PCR) should be carried out. However, a preparation of the EDC-NHS-activated protein A is relatively simple without performing PCR. In this present study, the detection capability of IgG of a waveguide-coupled bimetallic surface plasmon resonance (WcBiM SPR) sensor using the EDC-NHS-activated protein A was experimentally investigated in comparison with protein A and a self-assembled monolayer (SAM). The WcBiM sensor with narrow FWHM and steep slope was utilized since it led to a larger change in the reflectance. The performance of the WcBiM chip in the intensity detection mode was demonstrated by evaluating the FWHM and slope in the SPR reflectance curve. Also, EDC-NHS-activated protein A leads to the immobilization of anti-IgG with directed orientation, resulting in the improvement of detection capability for IgG. In the antigen-antibody interaction, the repeatability of a linear response for IgG at the concentrations of 50, 100, and was examined by repeating the experiments with three times. 2.Experimental Methods2.1.SPR SensorA miniaturized SPR sensor (SPRmicro, K-MAC, Daejeon, Korea) based on the Kretschmann type was used and its size was . Figure 1 shows a schematic diagram of the SPR sensor, which consists of a BK7 cylindrical prism, a sensor chip, a light source, and a detector array. As shown in this figure, a beam from a 780 nm light emitted diode first penetrates a bandpass filter () and reaches the sensor chip with an incident beam range from 64 to 71.4 deg through the prism. Subsequently, the reflected light is directed to a two-dimensional complementary metal oxide semiconductor (2-D-CMOS). A flowcell with two separate flow channels (a sample channel and a reference channel) excludes external environment variations such as temperature, since the SPR sensor does not have a thermostat. The reflectance from the two sensing channels was measured giving rise to the grayscale image in Fig. 2(a). The dark areas in the grayscale images denote a dip in the SPR reflectance curve because there is almost no reflected light. The upper and lower areas in the grayscale images signify the collected reflectance for both the reference and the sample channels. As the refractive index is changed by adsorbing the biomolecules on the sensor chip surface, the dark position of the sample channel is shifted, as shown in Fig. 2(b). In the intensity detection mode, the incident angle at the steepest slope in the SPR reflectance curve is fixed. The change in the reflectance was measured at this fixed angle, as shown in Fig. 2(c). The analyte signals were obtained by subtracting the reference signal from that of the sample signal. A peristaltic pump was used to flow the analytes or reference solution over the two sensing channels after air bubbles were removed with a degasser. Fig. 1Schematic diagram of a miniaturized surface plasmon resonance (SPR) sensor and a waveguide-coupled bimetallic (WcBiM) chip.  Fig. 2(a) SPR grayscale image from two-dimensional complementary metal oxide semiconductor before the adsorption of the biomolecules. (b) SPR grayscale image after the adsorption of the biomolecules. The dark area of the sample channel is shifted. (c) Intensity detection mode. Blue and red solid lines represent before the reaction and after the reaction, respectively. 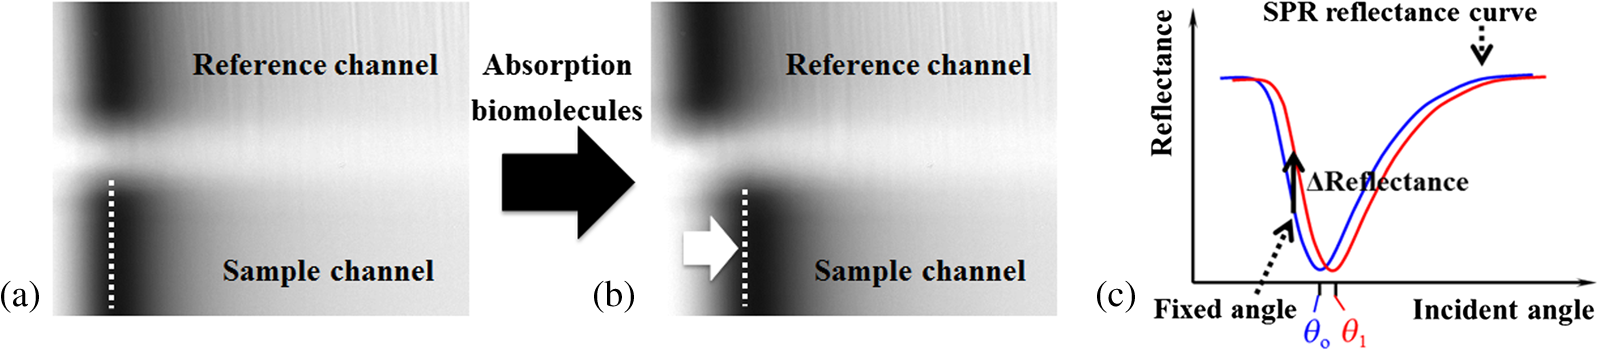 2.2.Waveguide-Coupled Bimetallic ChipThe WcBiM stack, which consisted of a glass substrate (Eagle XG corning glass) and a waveguide (WG; ) layer sandwiched between an Au layer and a silver (Ag) layer, is represented in the right part of Fig. 1. was used as the waveguide layer due to the outstanding adhesion and smooth interface between Au and Ag metals. The WcBiM chip was fabricated on the corning glass using the radio frequency (RF) magnetron sputtering method with 5 mTorr (0.67 Pa) of working pressure in a pure Ar atmosphere. The RF power for the and metallic Ag/Au was set to 80 and 20 W, respectively. As demonstrated in the previous work,21 an optimized multilayer stack of was selected using Fresnel equations and commercial optical thin-film software (SCI Film Wizard™, Carlsbad, CA, USA). To prove the high sensitivity of the WcBiM chip, its reflectance curve was compared with that of a conventional Au chip, which consists of . 2.3.Chemicals and ReagentsFor surface modification of the sensor chip, APTES in ethanol was utilized. EDC and sulfo-NHS were used to activate the carboxyl group of protein A. All chemical materials and proteins, including IgG, their relevant antibodies, phosphate-buffered saline (PBS, pH 7.4), protein A, and bovine serum albumin (BSA), were supplied from Sigma-Aldrich (St. Louis, Missouri). Diluted was used as the diluent of all proteins. SAM and the conventional Au chip were purchased from K-MAC. 2.4.Linkage LayersProtein A and SAM were used as the linkage layers to immobilize the anti-IgG, EDC-NHS-activated protein A. For SAM formation, 1 mM of NHS-SAM solution was prepared by dissolving 2 mg of NHS-SAM purchased from K-MAC in 2.5 ml of ethanol. A SAM was produced on the surface of the bare WcBiM chip by submerging it in the SAM solution for 12 h. The SAM-formed WcBiM chip was then installed in the SPR sensor. The formation of protein A on the WcBiM chip is relatively simple compared with the formation of SAM and the EDC-NHS-activated protein A on the chip. A total of of protein A solution was injected into the sample channel of the SPR sensor, giving rise to the formation of protein A on the bare chip. For EDC-NHS-activated protein A formation, surface modification of the WcBiM chip was carried out to make the surface reactable, as depicted in Figs. 3(a) and 3(b). First, a hydroxyl group () was formed on the bare WcBiM chip using an oxygen plasma device (Femto Science, Hwaseong-si, Gyeonggi, Korea), as shown in Fig. 3(a). The power was set to 60 W for 1 min, and the working pressure was 0.1 Torr. Then, the WcBiM chip was immediately dipped in 2% APTES in ethanol for 1 h, resulting in an amino group ()-functionalized surface, as shown in Fig. 3(b). A total of of protein A (980 μl) was reacted with 20 μl of a catalyst agent, EDC (4 mg) and sulfo-NHS (11 mg), and diluted in PBS for 1 h, resulting in an activated carboxyl group of the protein A. Then the -functionalized WcBiM chip was installed in the SPR sensor, and the EDC-NHS-activated protein A was injected into the sample channel of the SPR sensor. The EDC-NHS-activated protein A was captured on the -functionalized WcBiM chip, as shown in Fig. 3(c). In the whole experiment, of anti-IgG was used. A total of of BSA was flowed to minimize nonspecific binding before antibody-antigen interactions. The volume of all proteins was 200 μl. They were injected into the fluidic channel at a flow rate of . The experiment was repeated three times. 3.Results and Discussion3.1.SPR Reflectance CurveTo investigate the SPR response characteristics of the WcBiM SPR sensor using the EDC-NHS-activated protein A, protein A, and SAM, the SPR reflectance curves were first obtained for the WcBiM and conventional Au chips. Figure 4 shows the recorded grayscale images for the WcBiM and Au chips and their corresponding SPR reflectance curves. As shown in Figs. 4(a) and 4(b), dark areas in the grayscale images corresponding to a dip in the SPR reflectance curve were observed [Figs. 4(c) and 4(d)] since there was almost no reflected light. The upper and lower areas in the grayscale images signify the collected reflectance for the sample and the reference channels. The images show that the dark area in the grayscale image for the WcBiM chip is much narrower than that in the Au chip. As depicted in Figs. 4(c) and 4(d), numeric data for the SPR reflectance curve were acquired by fitting the reflectance profile of the grayscale image. The resonance angles with the reflectance were 64.79 deg with 4.01% for the WcBiM chip and 65.57 deg with 3.85% for the Au chip. The FWHM of the WcBiM and Au chips was 1.47 and 2.23 deg, respectively. Thus, the width of the SPR reflectance curve of the WcBiM chip was narrower than that of the Au chip. The differential values with respect to the incident angle were calculated to find the optimized incident angles where the higher resolution can be obtained in the intensity detection mode. The highest absolute values of the derivative were at 64.13 deg for the WcBiM chip and at 64.98 deg for the Au chip. In other words, the gradient in the SPR curve of the WcBiM chip was steeper than that of the Au chip. From these results, it was expected that the WcBiM chip would have higher sensitivity in the intensity detection mode because it leads to a larger reflectance change. 3.2.IgG DetectionTo verify the sensitivity of the WcBiM SPR sensor using the EDC-NHS-activated protein A, a specific binding test, was carried out during the antigen–antibody interaction. The antigen-antibody interaction led to a shift in the SPR reflectance curve, including the resonance angle. The reflectance increment was measured at the fixed incident angle with the steepest slope in the SPR reflectance curve. For the detection of IgG, the surface of the WcBiM chip was modified with anti-IgG using the EDC-NHS-activated protein A, protein A, and SAM. In this experiment, SAM was formed on the sensor chip before it was installed in the SPR sensor, and the EDC-NHS-activated protein A and protein A () were injected into the sample channel after the bare SPR chip was installed in the sensor. To immobilize anti-IgG, anti-IgG solution () was flowed across the WcBiM chip, which was coated with three-linkage layers. BSA with a concentration of was injected to block any reactable sites and prevent nonspecific interactions. Finally, IgG was introduced at increasing concentrations to study the sensitivity and the linearity of SPR responses. The concentrations used were 50, 100, and . The typical output responses from the two channels of the SPR system are shown in Fig. 5(a). The SPR response of the sample channel was increased by binding the proteins on the WcBiM chip after the sequence injection of the proteins. The reference channel was shown to be relatively constant compared to the sample channel. To exclude external environmental factors, the reference signal was subtracted from the sample signal, as shown in Fig. 5(b). The change in the reflectance following the injection of the EDC-NHS-activated protein A and protein A was, on average, 6.5111% and 11.8186%, respectively. The reflectance increment due to the anti-IgG and BSA using the EDC-NHS-activated protein A was, on average, 5.1293% and 0.8983%, respectively. The mean values when using protein A were 9.0293% and 1.1914%. In the case of SAM, they were 7.7069% and 0.8292% as shown in Fig. 5. The change in the reflectance with anti-IgG was highest when using protein A, as shown in Fig. 6. The vertical lines show the error bars. The error bar using protein A is the largest among the three-linkage layers due to the protein being randomly adsorbed on the sensor chip. Fig. 5(a) Signals from two channels: sequence injection of anti-IgG, BSA, and IgG (50, 100, and ) at the sample channel and injection of PBS solutions at the reference channel. (b) The actual meaningful signals due to biomolecular interaction acquired by taking off the reference signal from the sample signal.  Fig. 6Mean value of change in the reflectance for the injection of anti-IgG. Vertical lines represent the error bar in triplicate. 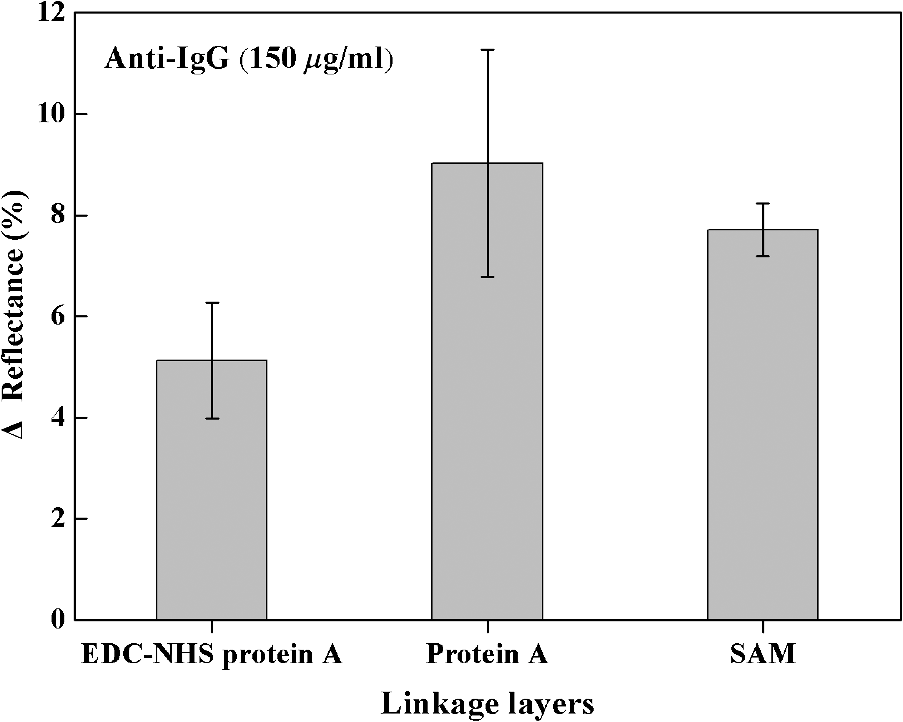 To compare the detection capabilities of the EDC-NHS-activated protein A, protein A, and SAM in the WcBiM sensor, the SPR response at IgG concentrations of 50, 100, and was analyzed. The results of repeat experiments performed in triplicate showed that the mean reflectance change for IgG at the concentrations of 50, 100, and using the EDC-NHS-activated protein A was 0.8405%, 1.6309%, and 2.6744%, respectively. In case of protein A, the average change in the reflectance at each concentration was 0.1987%, 0.5121%, and 0.8465%. The reflectance increments for SAM were 0.3988%, 0.7570%, and 1.3778%. These results demonstrate that the change in the reflectance was highest in the WcBiM SPR sensor chip using the EDC-NHS-activated protein A, even though the output signal for anti-IgG using protein A had the highest increment. Therefore, the binding of IgG does not seem to depend on the SPR response to anti-IgG. In addition, the EDC-NHS-activated protein A led to directional immobilization of anti-IgG, resulting in an increase in the binding of IgG. The increased binding capability is primarily due to the oriented formation of the protein A molecules due to the activated carboxyl group. The activated carboxyl group of protein A covalently interacted with the -functionalized sensor chip, as shown in Fig. 3(c). Even though carboxyl group of the amino acid in the five Fc-binding domains of protein A reacts with the -functionalized sensor chip, the other four homologous Fc-binding domains are still available to bind to Fc region of anti-IgG, resulting in Fab region of anti-IgG facing away from the sensor chip. Thus, it is expected that site-directed immobilization would enhance the ability of the sensor to detect IgG. To confirm the observations and results, the calibration curves for each IgG concentration were obtained. The average change in the reflectance of IgG at the concentrations of 50, 100, and are plotted in Fig. 7. The symbols depicted in Fig. 7 are the mean values for triplicate measurements, and the solid line joining them represents the best linear fitting. The error bars represent the standard deviation. As shown, the WcBiM SPR sensor using the EDC-NHS-activated protein A has the highest sensitivity among the three-linkage layers since the slope is the highest among the three-linkage layers. The sensitivity, defined as the change in the reflectance per unit change in the concentration of IgG, was 0.0185 [] for the EDC-NHS-activated protein A, 0.0065 [] for the protein A, and 0.0101 [] for the SAM. The correlation coefficient for the three-linkage layers was almost equal at approximately 99%. To evaluate the limit of detection (LOD), the lowest detectable concentration of IgG was acquired by calculating Eq. (1) as follows.22 Fig. 7Calibration curve of IgG with 50, 100, and . Symbols and the error bars represent the mean values and the standard deviation for triplicate, respectively.  The standard deviation for the EDC-NHS-activated protein A, protein A, and SAM was 0.0239%, 0.0170%, and 0.0219%, respectively. The calculated values for the EDC-NHS-activated protein A, protein A, and SAM were , , and , respectively. Based on the analysis of the LOD, the WcBiM sensor system using the EDC-NHS-activated protein A had higher sensitivity than the systems using protein A or SAM. These observations suggest that the WcBiM sensor with the EDC-NHS-activated protein A can detect very low levels of biomolecules. 4.ConclusionsIn this work, we demonstrated the WcBiM sensor based on the intensity detection mode using the EDC-NHS-activated protein A to improve the detection capability of IgG. For the verification of the enhanced sensitivity of the WcBiM chip, the SPR reflectance curve was first acquired by fitting the intensity profile recorded from 2-D-CMOS. The FWHM and slope in the SPR curve of the WcBiM chip were compared with that of conventional Au (gold) chip. It was proved that the WcBiM chip had a narrower FWHM and steeper slope than the Au chip. From these facts, it was expected that the WcBiM chip would have higher sensitivity than the Au chip. In antigen-antibody interaction, the EDC-NHS-activated protein A, protein A, and SAM were utilized to immobilize anti-IgG. From this specific binding test, the sensor possessed a linear response in the range of 50, 100, and for IgG. The sensitivity of the sensor system using the EDC-NHS-activated protein A, protein A, and SAM was obtained from the slope in the calibration curve for IgG, resulting in 0.0185 [], 0.0065 [], and 0.0101 [], respectively. The lowest detectable concentrations of IgG were , and . It was obvious from the analysis of LOD that the WcBiM sensor system when using the EDC-NHS-activated protein A had the highest sensitivity among the three-linkage layers. In addition, it is expected that the EDC-NHS-activated protein A in the WcBiM sensor will allow the detection of IgG at a very low-level concentration, leading to a potential biosensor device for an early diagnosis in the medical applications. The proper selections of the SPR sensor chip with site-directed immobilization of antibodies are one of the key issues in the development of the immunosensor. AcknowledgmentsThis research was supported by the Basic Science Research Program through the National Research Foundation of Korea (NRF) funded by the Ministry of Education (NRF-2013R1A1A2010028). ReferencesB. BohunickyS. A. Mousa,
“Biosensors: the new wave in cancer diagnosis,”
Nanotechnol. Sci. Appl., 4 1
–10
(2011). http://dx.doi.org/10.2147/NSA.S13465 Google Scholar
J. H. Revkinet al.,
“Biomarkers in the prevention and treatment of atherosclerosis: need, validation, and future,”
Pharmacol. Rev., 59
(1), 40
–53
(2007). http://dx.doi.org/10.1124/pr.59.1.1 PAREAQ 0031-6997 Google Scholar
A. P. F. TurnerI. KarubeG. S. Wilson, Biosensors: Fundamentals and Applications, Oxford University, USA
(1987). Google Scholar
K.-I. Chenet al.,
“Silicon nanowire field-effect transistor-based biosensors for biomedical diagnosis and cellular recording investigation,”
Nanotoday, 6
(2), 131
–154
(2011). http://dx.doi.org/10.1016/j.nantod.2011.02.001 NTAOCG 1748-0132 Google Scholar
M.-K. Jeonet al.,
“7-Triazolylcoumarin-based fluorescent tag system for stepwise, comparative assessment of small molecule microarrays,”
Tetrahedron, 68
(30), 6038
–6053
(2012). http://dx.doi.org/10.1016/j.tet.2012.05.018 TETRAB 0040-4020 Google Scholar
Y. K. Leeet al.,
“Waveguide-coupled bimetallic film for enhancing the sensitivity of a surface plasmon resonance sensor in a fixed-angle mode,”
J. Korean Phys. Soc., 62
(3), 475
–480
(2013). http://dx.doi.org/10.3938/jkps.62.475 KPSJAS 0374-4884 Google Scholar
K.-Y. Parket al.,
“Development of FET-type albumin sensor for diagnosing nephritis,”
Biosens. Bioelectron., 23
(12), 1904
–1907
(2008). http://dx.doi.org/10.1016/j.bios.2008.03.011 BBIOE4 0956-5663 Google Scholar
G. B. Kanget al.,
“Sensing of prostate-specific antigen using trimmed silicon nanowire field effect transistors,”
J. Nanoelectron. Optoelectron., 6
(3), 330
–333
(2011). http://dx.doi.org/10.1166/jno.2011.1179 JNOOAW 1555-130X Google Scholar
F. Salamet al.,
“Real-time and sensitive detection of Salmonella typhimurium using an automated quartz crystal microbalance (QCM) instrument with nanoparticles amplification,”
Talanta, 115 761
–767
(2013). http://dx.doi.org/10.1016/j.talanta.2013.06.034 TLNTA2 0039-9140 Google Scholar
J. Homolaet al.,
“Surface plasmon resonance sensors: review,”
Sens. Actuators, B, 54
(1–2), 3
–15
(1999). http://dx.doi.org/10.1016/S0925-4005(98)00321-9 SABCEB 0925-4005 Google Scholar
I. Abdulhalimet al.,
“Surface plasmon resonance for biosensing: a mini-review,”
Electromagnetics, 28
(3), 214
–242
(2008). http://dx.doi.org/10.1080/02726340801921650 ETRMDV 0272-6343 Google Scholar
Y. ChenH. Ming,
“Review of surface plasmon resonance and localized surface plasmon resonance sensor,”
Photonic Sens., 2
(1), 37
–49
(2012). http://dx.doi.org/10.1007/s13320-011-0051-2 Google Scholar
E. Pasqualottoet al.,
“Plasmonic platforms for innovative surface plasmon resonance configuration with sensing applications,”
Microelectron. Eng., 111 348
–353
(2013). http://dx.doi.org/10.1016/j.mee.2013.02.088 MIENEF 0167-9317 Google Scholar
S. Ghoseet al.,
“Antibody variable region interactions with protein a: implications for the development of generic purification processes,”
Biotechnol. Bioeng., 92
(6), 665
–673
(2005). http://dx.doi.org/10.1002/(ISSN)1097-0290 BIBIAU 0006-3592 Google Scholar
M. Uhlenet al.,
“Complete sequence of the staphylococcal gene encoding protein A,”
J. Biol. Chem., 259
(3), 1695
–1702
(1984). JBCHA3 0021-9258 Google Scholar
J. Sjodahl,
“Structural studies on the four repetitive Fc-binding regions in protein A from Staphylococcus aureus,”
Eur. J. Biochem., 78
(2), 471
–490
(1977). http://dx.doi.org/10.1111/ejb.1977.78.issue-2 EJBCAI 0014-2956 Google Scholar
J. Rajet al.,
“Surface immobilisation of antibody on cyclic olefin copolymer for sandwich immunoassay,”
Biosens. Bioelectron., 24
(8), 2654
–2658
(2009). http://dx.doi.org/10.1016/j.bios.2009.01.026 BBIOE4 0956-5663 Google Scholar
S. K. Vashist,
“Comparison of 1-ethyl-3-(3-dimethylaminopropyl) carbodiimide based strategies to crosslink antibodies on amine-functionalized platforms for immunodiagnostic applications,”
Diagnostics, 2
(3), 23
–33
(2012). http://dx.doi.org/10.3390/diagnostics2030023 DIAGC9 2075-4418 Google Scholar
J. M. Leeet al.,
“Direct immobilization of protein G variants with various numbers of cysteine residues on a gold surface,”
Anal. Chem., 79
(7), 2680
–2687
(2007). http://dx.doi.org/10.1021/ac0619231 ANCHAM 0003-2700 Google Scholar
E. de Juan-Francoet al.,
“Site-directed antibody immobilization using protein A-gold binding domain fusion protein for enhanced SPR immunosensing,”
Analyst, 138
(7), 2023
–2031
(2013). http://dx.doi.org/10.1039/c3an36498d ANLYAG 0365-4885 Google Scholar
Y. K. Leeet al.,
“Enhancing performance of a miniaturized surface plasmon resonance sensor in the reflectance detection mode using a waveguide-coupled bimetallic chip,”
Nanoscale Res. Lett., 8 344
(2013). http://dx.doi.org/10.1186/1556-276X-8-344 1556-276X Google Scholar
J. HomolaM. Piliarik,
“Surface plasmon resonance (SPR) sensors,”
Surface Plasmon Resonance Based Sensors, 45
–67 Springer, Berlin, Heidelberg
(2006). Google Scholar
BiographyYoung-Soo Sohn is currently a faculty member of the Department of Biomedical Engineering at Catholic University of Daegu. He received his BS and MS degrees at Kyungpook National University in 1994 and 1997, respectively. He got his PhD degree in solid-state devices at 2001 from the Department of Electrical and Computer Engineering at the University Texas at Austin. His research focuses on transducers, nano- and microsensors, biomedical devices, and other electronic devices. Yeon Kyung Lee obtained her BS degree from the Department of Biomedical Engineering at Catholic University of Daegu, in 2012. She is currently pursuing her MS degree at Catholic University of Daegu. Her research interest has been focused on the development of the high-sensitivity optical-based biosensor and surface modification of sensor chip to enhance the sensitivity. |