|
|
1.IntroductionHyperspectral imaging (HSI), also called imaging spectrometer,1 originated from remote sensing and has been explored for various applications by NASA.2 With the advantage of acquiring two-dimensional images across a wide range of electromagnetic spectrum, HSI has been applied to numerous areas, including archaeology and art conservation,3,4 vegetation and water resource control,5,6 food quality and safety control,7,8 forensic medicine,9,10 crime scene detection,11,12 biomedicine,13,14 etc. As an emerging imaging modality for medical applications, HSI offers great potential for noninvasive disease diagnosis and surgical guidance. Light delivered to biological tissue undergoes multiple scattering from inhomogeneity of biological structures and absorption primarily in hemoglobin, melanin, and water as it propagates through the tissue.15,16 It is assumed that the absorption, fluorescence, and scattering characteristics of tissue change during the progression of disease.17 Therefore, the reflected, fluorescent, and transmitted light from tissue captured by HSI carries quantitative diagnostic information about tissue pathology.17–20 In recent years, advances in hyperspectral cameras, image analysis methods, and computational power make it possible for many exciting applications in the medical field. In the following, we aim to introduce and explain medical hyperspectral imaging (MHSI) technology and to give an overview of the literature on MHSI hardware, software, and applications. This survey covers literature from fall 1988 to spring 2013. We start at the basics with the mechanisms of HSI and its current development status. We then classify MHSI based on its acquisition mode, spectral range and spatial resolution, measurement mode, dispersive devices, detector arrays, and combination with other techniques. Image analysis methods for MHSI are summarized with an emphasis on preprocessing, feature extraction and selection, and classification methods. The section on applications refers to the available literature on disease diagnosis and surgery guidance. These applications mainly cover the ultraviolet (UV), visible (VIS), and near-infrared (near-IR or NIR) regions. Interested readers can refer to other review papers for more applications in mid-infrared (mid-IR or MIR) regions.21,22 Finally, we conclude with a discussion on the achievements of the past years and some future challenges. 2.Tissue OpticsThe propagation of light within tissue is a significant problem in medical applications and in the development of diagnostic methods. Therefore, this section is dedicated to a brief review of the light tissue interaction mechanisms, optical processes involved in HSI, and useful diagnostic information provided by HSI. Light entering biological tissue undergoes multiple scattering and absorption events as it propagates across the tissue.23 Biological tissues are heterogeneous in composition with spatial variations in optical properties.24 Scattering occurs where there is a spatial variation in the refractive index.24 In cellular media, the important scatters are the subcellular organelles, with their size running from to 6 μm. For example, mitochondria are the dominant scatterers among the organelles. The structure of a lipid membrane and lipid folds running inside gives mitochondria a high optical contrast to the surrounding cytoplasm and produces the observed strong scattering effects. The shape and size of the cells vary among different tissue types with dimensions of a few microns and larger.24 The scattering properties of support tissues composed of cells and extracellular proteins (elastin and collagen, etc.) are caused by the small-scale inhomogeneities and the large-scale variations in the structures they form. The penetration depth of light into biological tissues depends on how strongly the tissue absorbs light. Most tissues are sufficiently weak absorbers to permit significant light penetration within the therapeutic window, ranging from 600 to 1300 nm.24 Within the therapeutic window, scattering is over absorption, so the propagating light becomes diffuse. Tissue absorption is a function of molecular composition. Molecules absorb photons when the photons’ energy matches an interval between internal energy states, and the transition between quantum states obeys the selection rules for the species. During absorption processing, transitions between two energy levels of a molecule that are well defined at specific wavelengths could serve as a spectral fingerprint of the molecule for diagnostic purposes.24,25 For example, absorption spectra characterize the concentration and oxygen saturation of hemoglobin, which reveals two hallmarks of cancer: angiogenesis and hypermetabolism.16 Tissue components absorbing light are called chromophores. Some of the most important chromophores for visible wavelengths are blood and melanin, of which the absorption coefficient decreases monotonically with the increasing wavelength. The primary absorbers for UV wavelengths are protein and amino acids, while the important absorbing chromophore for IR wavelengths is water.26 Light absorbed by tissue constituents is either converted to heat or radiated in the form of luminescence, including fluorescence and phosphorescence.18,24,27 Fluorescence that originates from endogenous fluorescent chromophores is also called autofluorescence. Incident light, typically in the UV or VIS region, excites the tissue molecules and induces fluorescence emission. The majority of the endogenous fluorophores are associated with the structural matrix of tissue or with various cellular metabolic pathways.24,28 The most common fluorophores in the structural matrix are collagen and elastin, while the predominant fluorophores involved in cellular metabolism are the nicotinamide adenine dinucleotide (NADH), flavin adenine dinucleotide (FAD), and lipopigments.29 These intrinsic fluorophores exhibit different strengths and cover spectral ranges in the UV and VIS regions. For example, fluorescence from collagen or elastin using excitation between 300 and 400 nm shows broad emission bands between 400 and 600 nm, which can be used to distinguish various types of tissues, e.g., epithelial and connective tissue.30 Cells in different disease states often have different structures or undergo different rates of metabolism, which result in different fluorescence emission spectra. Therefore, fluorescence imaging makes it possible to investigate tissues for diagnosis of diseases in real time without administrating exogenous fluorescent agents.24 Various exogenous fluorophores have also been created and studied for biological diagnostics using HSI,29 but this review will mainly discuss the intrinsic fluorescence. Incident light can be directly reflected on the surface of the tissue or be scattered due to random spatial variations in tissue density (membranes, nuclei, etc.) and then be remitted to the tissue surface.27 Light becomes randomized in direction due to multiple scattering, and this is known as diffuse reflectance, which provides information about scattering and absorbing components deep within the tissue.31 The measured reflectance signal represents light that has sampled a variety of sampling depths within the tissue and is, therefore, an average measure of the properties over a certain volume of tissue.31 Knowledge of the origin of the scattering and absorption signals would facilitate accurate modeling and interpretation of the reflectance data. The reflectance signal measured from epithelial tissue is determined by the structural and biochemical properties of the tissue; therefore, changes in optical properties can be used to noninvasively probe the tissue microenvironment.31 Alterations in tissue morphology, including hyperplasia, nuclear crowding, degradation of collagen in the extracellular matrix by matrix metalloproteinases, and increased nuclear/cytoplasmic ratio, which are associated with disease progression, can affect the scattering signals. As diseases progress, hemoglobin absorption may be affected by angiogenesis and tissue hypoxia, etc. Therefore, changes in the disease states should lead to corresponding changes in the patterns of light reflected from the tissue. Reflectance imaging can detect local changes in scattering and absorption properties of tissue, and fluorescence imaging can probe changes in the biochemical composition of tissue by revealing levels of endogenous fluorophores.32 Multimodal HSI combining reflectance and fluorescence has been investigated for cancer diagnosis.19,33 Furthermore, the HSI system can be adapted to other existing techniques, such as microscope and colposcope, to provide complementary information in a more accurate and reliable manner. Transmission HSI microscope is one example of these combinatory technologies and has been used in tissue pathology. 3.Hardware and SystemsHSI is a hybrid modality that combines imaging and spectroscopy. By collecting spectral information at each pixel of a two-dimensional (2-D) detector array, HSI generates a three-dimensional (3-D) dataset of spatial and spectral information, known as hypercube (shown in Fig. 1). With spatial information, the source of each spectrum on samples can be located, which makes it possible to probe more completely the light interactions with pathology. The spectral signature of each pixel in the images enables HSI to identify various pathological conditions. HSI generally covers a contiguous portion of the light spectrum with more spectral bands (up to a few hundreds) and higher spectral resolution than multispectral imaging (such as RGB color cameras). Therefore, HSI has the potential to capture the subtle spectral differences under different pathological conditions, while multispectral imaging may miss significant spectral information for diagnostics. The difference between a hypercube and an RGB color image is illustrated in Fig. 1. Among all the MHSI systems investigated in the literature, the majority of the systems are prototypes consisting of the off-the-shelf components, rather than commercialized systems. Fig. 1Comparison between hypercube and RGB image. Hypercube is three-dimensional dataset of a two-dimensional image on each wavelength. The lower left is the reflectance curve (spectral signature) of a pixel in the image. RGB color image only has three image bands on red, green, and blue wavelengths respectively. The lower right is the intensity curve of a pixel in the RGB image.  An HSI system is mainly composed of the light source, wavelength dispersion devices, and area detectors. To illustrate the mechanisms of the HSI system, the principle of a typical pushbroom HSI system is shown in Fig. 2 as an example. A tissue sample illuminated by the light source is projected through a front lens into an entrance slit, which only passes light from a narrow line. After collimation, a dispersive device (such as a prism, grating, etc.) splits the light into a series of narrow spectral bands that are then focused onto a detector array. Slit width controls the amount of light entering the spectrograph. In this way, for each pixel interval along the line defined by the slit, a corresponding spectrum is projected on a column of the detector array. Thus, each line of the targeted area on a tissue sample is projected as a 2-D image onto the detector, with one spatial dimension and one spectral dimension. By scanning over the tissue specimen or moving the camera across the tissue sample in a pushbroom or line-scanning fashion, an HSI camera collects 2-D images for adjacent lines, creating a hypercube with two spatial dimensions and one spectral dimension. 3.1.Medical Hyperspectral Imaging SystemsThere are many different ways of classifying HSI systems, such as by image acquisition mode, spectral ranges and spectral resolution, measurement mode, the type of dispersive devices, the type of detector arrays. These classification methods will be discussed in Secs. 3.1.1–3.1.5. Table 1 summarizes the representative HSI systems and their medical applications. Table 1Summary of representative hyperspectral imaging systems and their medical applications.
Note: ICCD, intensified charge-coupled device; Si CCD, silicon CCD; LCTF, liquid crystal tunable filter; FPA, focal plane array; AOTF, acousto-optical tunable filter; CGH, computer-generated hologram; PGP, prism-grating-prism. 3.1.1.Acquisition modeThe fundamental classification scheme of HSI systems is based on the acquisition mode, i.e., how spectral and spatial information is acquired.61 The conventional HSI system involves two scanning methods: spatial scanning and spectral scanning. Spatial scanning methods generate hyperspectral images by acquiring a complete spectrum for each pixel in the case of whiskbroom (point-scanning) instruments or line of pixels in pushbroom (line-scanning) instruments, and then spatially scanning through the scene. Spectral scanning methods, also called staring or area-scanning imaging, involves capturing the whole scene with 2-D detector arrays in a single exposure and then stepping through wavelengths to complete the data cube. Spectral scanning approaches usually store images in band-sequential format, which compromises performance between spatial and spectral information, while spatial scanning stores images either in the form of band interleaved by pixel or band interleaved by line, both of which perform well in spatial and spectral analysis. Whiskbroom and pushbroom HSI do not provide live display of spectral images, which is calculated from the spectra after the completion of the spatial scanning of the corresponding area. Staring HSI scanning through wavelength to build the hypercube has the advantage of displaying live spectral images, which is essential for aiming and focusing.17 Staring imaging is suitable for stationary applications, such as samples under hyperspectral microscope. Pushbroom and staring imaging modes are two of the most frequently used methods in the literature. Fourier transform infrared imaging (FTIR) is another type of HSI system combining a Fourier transform spectrometer and a focal plane array (FPA).62,63 FTIR collects a series of images as a function of interferometer optical path difference, and the spectral images are then transformed to frequency domain as the final hypercube by fast Fourier transform. In this way, FTIR spectra are recorded for every spatial location in the image plane in parallel.62 The formation of the signal and propagation of noise from detector array data collection to the final hyperspectral data cube is significantly different from whiskbroom and pushbroom HSI.63 In the literature, mid-wavelength infrared HSI used in medical domain are all FTIR.36,60,62–73 These serial acquisition systems can only collect a fraction of the full data cube at a single instant in time and must trade off critical imaging parameters, such as speed, image size, resolution, and/or signal-to-noise ratio.49 Therefore, various new HSI techniques have been developed to overcome these problems. Bernhardt utilized an HSI system with rotational spectrotomography to detect all available photons from an object while obtaining enough information to reconstruct the data cube.74 Johnson et al.44 used a computed tomographic imaging spectrometer (CTIS) to capture both spatial and spectral information in a single frame without moving parts or narrow-band (NB) filters, and with high optical throughput, which is well suited for human retina imaging with constantly moving eyes. Trade-off problems between imaging acquisition rate and signal throughput in scanning-based techniques also lead to the development of image mapping spectroscopy (IMS),49,75–77 which captures the whole data cube in a single snapshot without compromising image resolution, speed, optical throughput, or intensive postprocessing. The IMS is one of the first real-time, nonscanning techniques capable of meeting the needs of out-of-the-lab chemical imaging.77 3.1.2.Spectral range and spectral resolutionSpectral range refers to the wavelength regions covered by HSI systems. MHSI systems can cover UV, VIS, NIR, and mid-IR spectral ranges based on different medical applications. The most widely used spectral range in the literature falls in VIS and NIR regions. NIR spectral imaging relies on overtone and combination vibrational bands and low-energy electronic transitions in this region, while MIR imaging records the absorbance of light at the vibrational and rotational frequencies of the atoms within the molecule.22 The MIR absorbance spectrum contains rich information about the genomics, proteomics, and metabolomics of a cell. However, water absorbs mid-IR light strongly and masks vibrational absorption of other important molecules, such as proteins, lipids, amino acids, carbohydrates, and other molecules within the sample.78 Table 2 defines the spectral range from UV to mid-IR (200 to 25,000 nm).78 Visible light penetrates only 1 to 2 mm below the skin and thus obtains information from the subpapillary,79 while light in the NIR region penetrates deeper into the tissue than VIS or mid-IR radiation.21 NIR light is preferred for surgical guidance due to its deep penetration into the tissue, which can help the surgeon see through connective tissue for visualizing critical anatomical structures of interest that are not visible and detecting molecules with detectible spectra.46–80 By expanding light beyond the visual spectrum, additional information can be obtained to further characterize the cells of interest.81 Table 2Spectral range definitions.
Spectral resolution of an HSI system refers to the absolute limit of the ability of separating two adjacent monochromatic spectral features emitted by a point in the image.82 Spectral resolution measures the narrowest spectral feature that can be resolved by an HSI system. High spectral resolution allows accurate reconstruction of the true spectral profile of an emitting light from all points in the tested sample. Another important parameter of an HSI system is spectral bandwidth, which is defined as the full width at half maximum.82 HSI systems with higher spectral resolution and narrower bandwidth potentially provide more accurate spectral signature of the sample. 3.1.3.Measurement modeBased on the optical properties of biological tissue, HSI systems can work on reflectance, fluorescence, and transmission modes across the UV, VIS, and NIR regions of the electromagnetic spectrum. Majority of the HSI systems in the literature were implemented on the reflectance mode, which measures the reflectance spectral of samples. In reflection measurement, the detector and the light source are on the same side of the sample, which is assumed to be thick and incapable of transmission.22 In many cases, fluorescence and reflectance modes are employed together to identify biomolecular and morphologic indicators of various tumors.19,34,83 In transmission mode, light is transmitted through tissue samples from a light source placed below the sample holder and recorded by an imaging spectrograph placed above the sample. Transmission mode is usually used when hyperspectral systems are integrated with microscopes to measure light intensity transmitted through samples.35,41,59,84–86 3.1.4.Dispersive devicesDispersive devices are the core element of an HSI system, which are either located between the light source and the sample for excitation wavelength selection or between the sample and the detector arrays for emission wavelength dispersion. There are many types of optical and electro-optical dispersive devices, which can perform spectral dispersion or selection in HSI systems. The commonly used dispersive devices in the literature can be divided into three classes: (1) monochromators: prism and diffraction grating, (2) optical bandpass filters: either fixed filter or tunable filters, and (3) single-shot imagers. The mechanisms, advantages, and disadvantages of these dispersive devices are described below. MonochromatorMonochromators separate polychromatic or white light into its constituent spectrum of colors. There are two types of monochromators, i.e., prism and diffraction grating, which are the core components in pushbroom HSI systems. Prism disperses light because of the change of the refractive index of the prism material, which varies with the wavelength of incident light, and then causes the incident light of different wavelengths to leave the prism at different angles. A diffraction grating consists of reflecting or transmitting elements spaced at a distance comparable to the wavelength of the light under investigation. With lines or grooves ruled on the surface, grating is able to diffract incident light and modify the electric field amplitude or phase, or both, of the incident electromagnetic wave.87 Prism has very high light throughput and low scatter over the spectral range of VIS and NIR, and is free from overlapping spectral orders that cause complications in grating. However, optical designs based on prism tend to be more complex than grating because of the nonlinear scanning dispersion of the prism. Prism-grating-prism (PGP) is a direct vision dispersive component that allows small, low-cost HSI spectrographs for industry and research applications in the spectral range of 320 to 2700 nm. It consists of a specially designed, volume transmission grating cemented between two almost identical prisms, with short- and long-pass filters placed between the grating and prism to block unwanted wavelengths and avoid surface reflections.88 Khoobehi et al.89 used an HSI system incorporated with a PGP structure in the spectral range of 410 to 950 nm to measure retinal oxygen saturation. PGP covering VIS and NIR spectral regions have been integrated into a series of commercialized hyperspectral systems to provide high diffraction efficiency and good spectral linearity.90 PGP has been employed for numerous medical applications.47,48,85,91–96 Optical bandpass filterOptical bandpass filters are either fixed or tunable and are widely used in area-scanning HSI systems. Fixed bandpass filters, such as interference filters, are usually placed in a filter wheel that rotates either in front of detector arrays or in front of the light source to transmit the wavelength of interest while rejecting light out of the pass band. Filter wheels are usually incorporated in multispectral systems because they contain no more than 10 bandpass filters.14,55,97–100 Although filter wheels are convenient to use, they suffer from disadvantages of narrow spectral range, low resolution, slow speed of wavelength switching, mechanical vibration from moving parts, and image misregistration due to filter movement.82 Tunable filters are commonly used in the area-scanning HSI systems, which can be electronically controlled without moving parts and at high tuning speeds.101 Liquid crystal tunable filter (LCTF) and acousto-optical tunable filter (AOTF) are predominantly utilized in most MHSI systems because of their high image quality and rapid tuning speed over a broad spectral range. LCTFs are generally built by a stack of polarizers and tunable retardation liquid crystal plates.101 LCTFs work from the VIS to NIR region. AOTFs consist of a crystal in which radio frequency acoustic waves are used to separate a single wavelength from incident light.101 AOTFs operate at a broader wavelength range from UV to IR. AOTFs also have faster tuning speeds than LCTFs. However, the image quality of AOTF is relatively poor due to their acousto-optic operating principles. Single-shot imagerSingle shot imagers, such as a computer-generated hologram (CGH), are used to disperse light in snapshot HSI systems.44,76,102 CGH consists of cells of square pixels that are arrayed to form a 2-D grating. CGH enables CTIS to capture both spatial and spectral information in a single frame. 3.1.5.Detector arraysA detector array or detector FPA is an assemblage of individual detectors located at the focal plane of an imaging system.103 In HSI, FPA includes 2-D arrays that are designed to measure the intensity of light transmitted by dispersive devices by converting radiation energy into electrical signals. Detectors can work in a wide spectral range of electromagnetic spectrum based on their spectral responses and application requirements. Selection of a suitable FPA is one of the most important steps in the development of spectrometer.104 Many parameters that characterize the performance of detector arrays, such as signal-to-noise ratio, dynamic range, spectral quantum efficiency, linearity, and so on,103 need to be considered when choosing a suitable FPA because the performance of the detector arrays directly determines the image quality. Charge-coupled devicesThe most widely used detector arrays in the literature are charge-coupled devices (CCDs) because of their high quantum yield and very low dark current. CCDs consist of many photodiodes that are composed of light-sensitive materials, such as silicon (Si), indium gallium arsenide (InGaAs), indium antimonite, and mercury cadmium telluride (HgCdTe). Based on the spectral response of these materials, the working wavelength range of CCDs varies from UV to NIR. Cooling CCDs can lower the operating temperature of the detectors and, therefore, reduce dark-current noise. Two technologies currently available for cooling IR and VIS detectors are mechanical cryocoolers and thermoelectric coolers.103 Thermoelectrically cooled CCDs perform well in MHSI systems.98,105–107 Silicon CCDs are mostly used in the VIS and NIR regions in MHSI systems14,42,50,105–107 due to their high resolution, relatively inexpensive cost, and acceptable quantum efficiency in the spectral range. The InGaAs photodiodes made of indium arsenide (InAs) and gallium arsenide (GaAs) extend applications well into the short-wavelength infrared (SWIR, to 1100 nm) with high quantum efficiency across this region. Standard InGaAs (InAs 53% and GaAs 47%) detectors are sensitive in the 900 to 1700 wavelength region. InGaAs detectors are well suited for medical applications in NIR and SWIR regions.42,57,96 Te-cooled InGaAs photodiode arrays are utilized in order to minimize dark noise.57 HgCdTe detectors covering both MWIR have been employed in cancer diagnosis,71 lymph node imaging,68 and assessment of homogeneity distribution in oral pharmaceutical solid dosage forms.56 Intensified CCD and electron multiplying CCDWhile regular CCD arrays that require sufficient light and exposure to ensure high-quality images are suited for hyperspectral reflectance and transmittance imaging, high-performance detector arrays such as intensified CCD (ICCD) and electron multiplying CCD (EMCCD) are usually used to detect weak signals for low-light applications, such as fluorescence imaging and Raman imaging. Martin et al.83 developed a dual-modality HSI system, which utilized CCD color cameras for reflection detection and ICCD for fluorescence detection for medical diagnosis.108 Vo-Dinh et al.109 proposed a hyperspectral Raman imaging system that integrated ICCD with a spectrograph to detect Raman signals for biological imaging. Li et al.110 developed a 3-D multispectral fluorescence optical tomography imaging system that took fluorescence pictures by EMCCD. Photomultiplier tube arraysPhotomultiplier tube (PMT) arrays are another type of detector that generates an electric output after a photon strikes in photocathode in just a few nanoseconds. PMT arrays offer faster speed than CCD and complementary metal oxide semiconductor (CMOS); therefore, they have been employed to replace CCD in order to meet the fast scan-time requirement of the HSI systems.111 Complementary metal oxide semiconductorDespite the advantages of low cost and low power supply, CMOS detectors have higher dark current and noise than CCD detectors, which has limited their use in HSI systems. In the literature, one system designed for biomedical applications contains CMOS detectors working in the 550 to 1000 nm wavelength range.112 3.1.6.Combination with other techniquesAn HSI system has been combined with many other techniques, such as laparoscope,46 colposcope,34 fundus camera,76,113,114 and Raman scattering,115 in order to leverage the key benefits of each instrument individually and provide more useful information for disease diagnosis and treatment. The most common combination is with microscope35,38,85,116–121 or confocal microscope,122 which has been proved useful in the investigation of the spectral properties of tissue. Epifluorescence microscopes and imaging spectrometers are often coupled to form an HSI microscope. Tsurui et al.116 proposed an HSI system consisting of an epifluorescence microscope and an imaging spectrometer to capture and classify complete fluorescent emission spectra from multiple fluorophores simultaneously from typical biomolecular samples, identify the location of the emission, and build libraries to enable automatic analysis in subsequent acquisitions. Schultz et al.123 developed a prototype HSI microscope combining a standard epifluorescence microscope and an imaging spectrograph to capture and identify different spectral signatures present in an optical field during a single-pass evaluation. However, the major limitation with these systems is their small fields of view (FOVs), thus requiring image tiling for tissue-section imaging. In order to increase the FOV, Constantinou et al.124 integrated a confocal scanning macroscope with a prototype HSI mode called a hyperspectral macroscope (HSM), which allows imaging of entire microscope slides in a single FOV, avoiding the need to tile multiple images together. In confocal fluorescence microscopy, the scanning mechanism of HSM imaging must trade off between image signal-to-noise ratio and photobleaching. 4.Image AnalysisImage analysis enables the extraction of diagnostically useful information from a large medical hyperspectral dataset at the tissue, cellular, and molecular levels and is, therefore, critical for disease screening, diagnosis, and treatment. Hypercube with high spatial and spectral resolution may potentially contain more diagnostic information. However, high spatial and spectral dimensions also make it difficult to perform automatic analysis of hyperspectral data. In particular, it is complex in many aspects: (1) high data redundancy due to high correlation in the adjacent bands, (2) variability of hyperspectral signatures, and (3) curse of dimensionality.125 With abundant spatial and spectral information available, advanced image classification methods for hyperspectral datasets are required to extract, unmix, and classify relevant spectral information. The goal is not only to discriminate between different tissues (such as healthy and malignant tissue) and provide diagnostic maps, but also to decompose mixtures into the spectra of pure molecular constituents and correlate these molecular fingerprints (biomarkers) with disease states. Although hyperspectral image analysis methods have been intensively investigated in the remote sensing area, their development and application in medical domain lag far behind. The relationships between spectral features and underlying biomedical mechanisms are not well understood. The basic steps for hyperspectral image analysis generally involve preprocessing, feature extraction and feature selection, and classification or unmixing. 4.1.Data PreprocessingHSI preprocessing mainly involves data normalization and image registration. Gaussian filter was also used in the literature to smooth spectral signatures and reduce the noise effect.108 Data normalization converts or normalizes hyperspectral radiance observations to reflectance93–126 or absorbance127,128 values that describe the intrinsic properties of biological samples. Such normalization also reduces system noise and image artifacts arising from uneven surface illumination or large redundant information in the subbands of hyperspectral imagery, and better prepares data for further analysis. Two most commonly used normalization methods are as follows: 4.1.1.ReflectanceCCD arrays used in HSI systems generally have dark current even without light shining on it. Dark current is dependent on temperature and is proportional to integration time. So, to convert raw intensity into reflectance, reference and dark images are taken before acquiring sample images. The reference image is taken with a standard reflectance surface placed in the scene, and the dark current is measured by keeping the camera shutter closed. Currently, the widely used standard reflectance surface is the National Institute of Standards and Technology certified 99% Spectralon white diffuse reflectance target. The raw data were then corrected using the following equation:93,126 where is the calculated reflectance value, is the raw data radiance value of a given pixel, and and are the dark current and the white reference intensity of the given pixel, respectively.4.1.2.Optical density or absorbanceThe absorbance is usually calculated by taking the ratio of the sample images () with respect to a reference image ().127,128 The reference material provides a measure of the instrument response function, and therefore, the method effectively ratios out the instrument response function from the resultant optical density image set. Image registration finds a geometric transformation of multiple images of the same scene taken at different wavelengths. The correspondence between the images is maximized when an image pair is correctly aligned. To obtain accurate spectral information for each pixel, image registration may be necessary to spatially align all spectral band images within one hypercube or between different hypercubes. Kong et al.108 utilized mutual information (MI) as a metric for searching the offset of the band images along the horizontal axis, and an image pair with maximum MI shows the best match between a reference image and an input image. Each band image was spatially coregistered to eliminate the spectral offset caused during the image acquisition procedure. Panasyuk et al.45 performed image registration as a preprocessing step to account for slight motion during the imaging of anesthetized mice. Lange et al.129 developed an elastic image registration algorithm to match reflectance and fluorescence images to compensate for soft tissue movement during the acquisition of reflectance and fluorescence image cubes. A detailed description of image registration algorithms is beyond the scope of this paper. Interested readers may check relevant references to identify a suitable approach for a specific study. 4.2.Feature Extraction and SelectionThe goal of feature extraction and selection is to obtain the most relevant information from the original data and represent that information in a lower-dimensionality space. For hyperspectral datasets, a larger number of spectral bands may potentially make the discrimination between more detailed classes possible. But due to the curse of dimensionality, too many spectral bands used in classification may decrease the classification accuracy.125 Moreover, not all of the intensities measured at a given wavelength are important for understanding the underlying characteristics of biological tissue17 since the reflectance or fluorescence features of biological tissue is wavelength dependent. Therefore, it is important to perform feature extraction and selection to extract the most relevant diagnostic information and process the dataset more efficiently and accurately. In hyperspectral datasets, each pixel can be represented in the form of an -dimensional vector, where is the number of the spectral bands. Such pixel-based representation has been widely used for hyperspectral image processing tasks. This method treats hyperspectral data as unordered listings of spectral measurements without particular spatial arrangement,130 which may result in a salt-and-pepper look for the classification map. Therefore, feature extraction methods incorporating both spatial and spectral information have been investigated intensively in the remote sensing area to improve classification accuracy. Recent advances of spatial-spectral classification have been summarized in Ref. 131. To exploit the information in these datasets effectively, dimensionality reduction methods are required to extract the most useful information, reduce the dimensionality of the datasets, and handle highly correlated bands. Methods of dimensionality reduction can be divided into two categories: feature extraction and band selection. The most widely used dimensionality reduction method for medical hyperspectral dataset analysis is principle component analysis (PCA). PCA reduces redundant information in the bands of hyperspectral imagery while preserving as much of the variance in the high-dimensional space as possible. Assume a hypercube consists of spectral images, and each image has a dimension of ;; then each image has pixels, and the ’th pixel within an image can be represented as a spectra vector , . Therefore, each hypercube can be represented as an matrix, where . The steps to compute the PCA transform of the matrix are as follows:132
PCA of hyperspectral image data can highlight the relative distributions of different molecular component mixtures,46,133 identify key discriminative features,19,134 and estimate spectrum in the spectroscopic data.86 PCA is optimal in the sense of minimizing the mean square error. However, PCA transforms the original data to a subspace spanned by eigenvectors, which makes it difficult to interpret the biological meaning after transformation. Several PCA variants, such as minimum noise fraction (MNF) and independent component analysis (ICA) are also used for feature extraction and dimensionality reduction. MNF transform is essentially two cascaded PCA transformations for reducing the spectra dimensionality and separating noise from the image data.50 ICA is also a useful extension of PCA by making the spectral features as independent as possible. The key idea of the ICA assumes that data are linearly mixed by a set of separate independent sources and demix these signal sources according to their statistical independency measured by mutual information.135 4.3.ClassificationHyperspectral image classification methods applied in the medical area mainly include pixel and subpixel classification based on the type of pixel information used. Pixel-wise classification can be parametric or nonparametric. Parametric classifiers generally assume normal distribution for the data, which is often violated in practice.136 Nonparametric methods, such as support vector machines (SVMs) and artificial neural networks (ANN) are widely used in medical hyperspectral image processing. The subpixel method assumes the spectral value of each pixel to be a linear or nonlinear combination of pure components. Pixel- and subpixel-based methods can be supervised or unsupervised. Commonly used supervised classification methods include SVMs, ANN, spectral information divergence (SID), and spectral angle mapper (SAM). The following sections will discuss some of these methods in detail. 4.3.1.Support vector machinesSVM is a kernel-based machine learning technique that has been widely used in the classification of hyperspectral images.48,52,95,108,137–144 Due to its strong theoretical foundation, good generalization capability, low sensitivity to the curse of dimensionality,145 and ability to find global classification solutions, SVM is usually preferred by many researchers over other classification paradigms. Given training vectors , in two classes, and an indicator vector such that , C-support vector classification146,147 solves the following primal optimization problem: maps into a higher-dimensional space and is the regularization parameter. Due to the possible high dimensionality of the vector variable , usually we solve the following dual problem: is the vector of all ones, is an by positive semidefinite matrix, , and is the kernel function. After Eq. (4) is solved, using the primal-dual relationship, the optimal satisfies So, for a new test point x, the decision function is SVM has been proved to perform well for classifying hyperspectral data.137 In the processing of medical hyperspectral data, SVM has also been explored for various classification tasks. Melgani and Bruzzone137 investigated the effectiveness of SVMs in the classification of hyperspectral remote sensing data. It was found that SVMs were much more effective than radial-basis function (RBF) neural networks and the K-nearest neighbor classifier in terms of classification accuracy, computational time, and stability to parameter settings. Kong et al.108 chose Gaussian RBF kernel as the kernel function for SVM and learned the SVM parameters from 100 training samples chosen randomly from each of the normal and tumor classes. For testing, 2036 (normal) and 517 (tumor) samples were used. Experimental results showed that the spatial filtering enhanced the performance, which resulted in an overall accuracy of 86%, while the use of the original data had an accuracy of 83%. In our group, we used SVMs for various tissue classification tasks. In Ref. 52, Akbari et al. extracted and evaluated the spectral signatures of both cancerous and normal tissue and used least squares SVMs to classify prostate cancer tissue in tumor-bearing mice and on pathology slides. In Ref. 140, they created a library of spectral signatures for different tissues and discriminated between cancerous and noncancerous tissues in lymph nodes and lung tissues with SVMs. In Ref. 95, Akbari et al. constructed a library of spectral signatures from hyperspectral images of abdominal organs, arteries, and veins, and then differentiated between them using SVMs. In Ref. 48, they utilized least squares kernel SVMs to classify normal tissues and tumors based on their standard deviation and normalized difference index of spectral signature. 4.3.2.Artificial neural networksNeural network is another supervised classification method that has been adopted by many researchers,92,96,100,136 due to its nonparametric nature, arbitrary decision boundary, etc. Multilayer perceptron (MLP) is the most popular type of neural network in image classification.136 It is a feed-forward network trained by the backpropagation algorithm. Monteiro et al.93 implemented both single-layer perceptron (SLP) and MLP as supervised classifiers. The MLP notably generated the clearest visualization of the calendar’s number under the blood. Although the SLP was also able to learn a good visualization, the output presented more noise. 4.3.3.Spectral information divergenceSID models the spectrum of a hyperspectral image pixel as a probability distribution in order to measure the discrepancy of probable behaviors between two spectra. Guan et al.58 used the SID technique to segment pathological white blood cells (WBCs) into four components: nucleus, cytoplasm, erythrocytes, and background. The SID method could not only distinguish different parts with similar gray values, e.g., in the case of cytoplasm and erythrocyte, but also segment WBCs accurately in spite of their irregular shapes and sizes. 4.3.4.Spectral angle mapperSAM determines the spectral similarity by calculating the angle between the spectra and treating them as vectors in a space with dimensionality equal to the number of wavelengths. Martin et al.53 employed SAM algorithm to map the spectral similarity between image spectra and cluster spectra in order to perform supervised classification, and they found that SAM disregarded specific surface irregularities of the vocal cords that naturally led to inhomogeneous reflections in every patient. Li et al.59 used the SAM algorithm to identify the nerve fibers from the molecular hyperspectral images of nerve sections according to the difference of the spectral signatures of different parts. 4.3.5.Spectral unmixingOne of the confounding factors in analyzing hyperspectral images is that the spectra at many pixels are actually mixtures of the spectra of the pure constituents. Spectral unmixing is a subpixel analysis method, which decomposes a mixed pixel into a collection of distinct spectra or endmembers, and a set of fractional abundances that indicate the proportion of each endmember.148 Spectral unmixing algorithms can be supervised or unsupervised. Supervised spectral unmixing relies on the prior knowledge about the reflectance patterns of candidate surface materials, while unsupervised unmixing aims to identify the endmembers and mixtures directly from the data without any user interaction.149 Many unmixing algorithms that were commonly used in the remote sensing area have been explored in medical HSI. Berman et al.71 implemented an unmixing method, i.e., iterated constrained endmembers, for hyperspectral data of cervical tissue. They identified cellular and morphological features as a prelude to construct a library of biologically interpretable endmembers. In another study, Constantinou et al.124 applied linear unmixing to hyperspectral images in order to remove autofluorescent signal contribution. It was considered that hyperspectral spatial spectrum is a combination of autofluorescence spectrum and other fluorescence spectrum of object tissues such as tumors. By decompositing the acquired spectra into different ones, autofluorescent signals can be removed or reduced. Sorg et al.38 performed spectral mixture analysis by utilizing a spectral angle-mapping technique in order to classify pixels as expressing green fluorescent protein (GFP) or red fluorescent protein (RFP). 5.Medical ApplicationsHSI is able to deliver nearly real-time images of biomarker information, such as oxyhemoglobin and deoxyhemoglobin, and provide assessment of tissue pathophysiology based on the spectral characteristics of different tissue.45 Therefore, HSI is increasingly being used for medical diagnosis and image-guided surgery. For example, HSI has been applied to the diagnosis of hemorrhagic shock,40,150 the assessment of peripheral artery disease,151 early detection of dental caries,57 fast characterization of kidney stone types,96 detection of laryngeal disorders,53 and so on. In the following section, we focus on the applications of HSI to cancer, cardiac disease, retinal disease, diabetic foot, shock, tissue pathology, and image-guided surgery. 5.1.Disease DiagnosisHSI has tremendous potential in disease screening, detection, and diagnosis because it is able to detect biochemical changes due to disease development, such as cancer cell metabolism.19,34,152 In the literature, a variety of studies have used HSI techniques to augment existing diagnostic methods or to provide more efficient alternatives. In this section, diseases, such as different types of cancer, cardiac disease, ischemic tissue, skin burn, retinal disease, diabetes, kidney disease, and so on, are investigated by various HSI systems. 5.1.1.CancersThe rational for cancer detection by optical imaging lies in the fact that biochemical and morphological changes associated with lesions alter the absorption, scattering, and fluorescence properties; therefore, optical characteristics of tissue can in turn provide valuable diagnostic information. For example, optical absorption can reveal angiogenesis and increased metabolic activity by quantifying the concentration of hemoglobin and oxygen saturation.16 Kortum et al.153 used optical spectroscopy to detect neoplasia and reported that (1) the increased metabolic activity affects mitochondrial fluorophores and changes the fluorescence properties in precancerous tissue and (2) fluorescence and reflectance spectra contain complementary information that was useful for precancer detection. Compared to optical spectroscopy that measures tissue spectra point-by-point, HSI is able to capture images of a large area of tissue and has exhibited great potential in the diagnosis of cancer in the cervix,19,34,81,154 breast,45,155 colon,66,84,117,118,142,156–159 gastrointestine,160,161 skin,41,97 ovary,55 urothelial carcinoma,162 prostate,52 esophagea,163 trachea,164 oral tissue,20,32,165,166 tongue,126 lymph nodes,72 and brain.98 HSI cancer studies have been performed in the following major aspects: (1) recognizing protein biomarkers and genomic alterations on individual tumor cells in vitro,167 (2) analyzing the morphological and structural properties of cancer histological specimens to classify the cancer grades, (3) examining the tissue surface to identify precancerous and malignant lesions in vivo, and (4) measuring the tissue blood volume and blood oxygenation to quantify the tumor angiogenesis and tumor metabolism. The following section briefly summarizes the research works that have been performed for certain types of cancers without covering all the above-mentioned cancers. Cervical cancerCervical cancer was once one of the most common causes of cancer death in American women. Pap smear tests, the current screening method for cervical cancer, are based on optical techniques and offer an effective method for identifying precancerous and potentially precancerous changes in cervical cells and tissue.168 However, the Pap smear test has been reported to have a false positive rate of 15 to 40%. It has also been reported that in normal cervical tissue, collagen and crosslinks exhibit bright fluorescence in the stroma over a wide range of excitation wavelengths, while in cervical precancers, stromal fluorescence is strongly decreased.154 Studies also showed that both reflectance and fluorescence spectroscopy can detect increased angiogenesis, which accompanies precancer.169 In vivo study: A combination of fluorescence and reflectance imaging has been shown to be able to interrogate the cervix tissue in vivo. Ferris et al.19 performed a clinical study on a diverse population of women with varying disease and nondisease states with an MHSI system covering the UV and VIS regions, and measured tissue fluorescence and reflectance of the cervical epithelium on the ectocervix. This system employs both fluorescence and reflectance tissue excitation with a multichannel spectrograph capable of hyperspectral resolution of and spatial resolution of the ectocervix of . They showed that the system could discriminate high-grade cervical lesions from less-severe lesions and normal cervical tissue, and could detect cervical cancer precursors at a rate greater than that obtained by a simultaneously collected Pap smear. It was concluded that fluorescence and reflectance mapping of cervical neoplasia may have some value as a colposcopy adjunct. Later, multispectral digital colposcope (MDC) was built to incorporate multispectral imaging with colposcope by Benavides et al.34 in order to measure the autofluorescence and reflectance images of the cervix. It was concluded that MDC could provide significant diagnostic information for discrimination between cervical intraepithelial neoplasia lesions and normal cervical tissues, and that excitation wavelengths across the spectral range of 330 to 360 nm and 440 to 470 nm appeared important in cervical cancer diagnosis. Histology study: Besides the in vivo studies, HSI on cervical cancer histology slides also showed promising results. Siddiqi et al.81 successfully improved the overall efficiency and objectivity in Pap test diagnosis by utilizing an HSI system coupled with microscope. They identified normal, low-grade, and high-grade H&E-stained cervical cells on TriPath liquid-based Pap test slides, squamous cell carcinoma (SCC) cells, as well as atypical squamous cells based on their unique spectra profiles. It was found that cervical cells with varying degrees of dysplasia demonstrated different spectra, which could be due to the change in the quantity and organization of the chromatin. It was also found that H&E and Pap stain were designed only for visual spectrum and that the use of IR and UV spectral range may further enhance the efficacy of HSI. Wood et al.67 employed FTIR to collect spectra of glandular and squamous epithelium, and of the cervical transformation from the H&E-stained cervical samples. They performed multivariate statistical analysis of the FTIR spectra to distinguish different tissue types and found the amide I and II regions to be very important in correlating anatomical and histopathological features in tissue to spectral clusters. Breast cancerBreast cancer is the leading cause of cancer deaths among American women.170 An inadequate supply of oxygen in tumor cells leads to hypoxia, which has been shown to be of prognostic value in clinical trials involving radiation, chemotherapy, and surgery. In vivo study: Sorg et al.38 applied HSI to acquire serial spatial maps of blood oxygenation in terms of hemoglobin saturation at the microvascular level on the mouse mammary carcinoma in vivo. RFP was used to identify mouse mammary carcinoma cells, while hypoxia-driven GFP was used to identify the hypoxic fraction. Their studies may improve the treatment and protocols to address or exploit tumor behavior. Histology study: Boucheron et al.155 acquired multispectral images with 29 spectral bands, spaced 10 nm within the range of 420 to 700 nm, from 58 H&E-stained breast cancer biopsy samples and then classified the nuclei of breast cancer cells with the multispectral image bands, or the constructed RGB imagery, or single image bands. They found that multispectral imagery for routine H&E-stained histopathology provided minimal additional spectral information for the pixel-level nuclear classification task than standard RGB imagery did. However, their result was limited to the classification of nuclei in breast histology within the spectral range of 420 to 700 nm with small number of wavelength bands. Kumar et al.60 applied FTIR on histopathological specimens of breast cancer with different histological grades. FTIR spectral changes close to and far from carcinoma were reported. PCA was performed to analyze the data. Their preliminary study suggested that FTIR spectral features present in the 5882 to 6250 nm could be used as spectral markers for identification of cancer-induced modifications in collagen. Skin cancerTwo types of skin cancer have been investigated using MHSI: melanoma and Kaposi’s sarcoma (KS). Melanoma is the most life-threatening form of skin cancer, which is responsible for of skin cancer deaths in 2012.170 KS is a highly vascularized tumor that causes cutaneous lesions. In vivo human study: Hattery et al.97 built a six-band multispectral NIR imaging system to identify thermal signatures of blood volume on patients with KS and who were starting anti-angiogenesis therapy. Results showed that relative spatial tissue blood volume and blood oxygen saturation values could be used as indicators of tumor angiogenesis and tumor metabolism. Histology study: Dicker et al.41 searched for spectral differences between benign and malignant dermal tissue in the routine H&E-stained specimens. In their study, the spectral differences could be objectively identified provided that staining time and section thickness were controlled. Figure 3 shows a gray-scale image of a melanoma lesion and also interstitial areas. Fig. 3A gray-scale image of a melanoma lesion showing the transmission spectra in the nuclear and interstitial areas.41  Head and neck cancerHead and neck cancer (HNC) occurs in the head or neck region, including lip, oral cavity, nasal cavity, oropharynx, hypopharynx, larynx, etc. Most of the HNCs are SCC that originate from the epithelial region. Therefore, HSI with limited penetration depth is possible to detect the cancerous tissue. Clinical trial: Oral cancer is a subtype of HNC located in the oral cavity, which is commonly examined by visual inspection and palpation of the mouth. However, this visual screening method depends heavily on the experience and skills of the physicians. Roblyer et al.32,165 reported the use of a multispectral digital microscope (DMD) for the detection of oral neoplasia in a pilot clinical trial. The proposed DMD was a multimodal imaging method that combines the fluorescence, NB reflectance, and orthogonal polarized reflectance (OPR) modes. They observed decreased blue/green autofluorescence and increased red autofluorescence in the lesions and increased visibility of vasculature with NB and OPR imaging. Histology study: In our group, Akbari et al.140 imaged pathological slides using a hyperspectral camera and reported the detection of HNC metastasis with promising sensitivity and specificity. Liu et al.126 measured and analyzed the reflectance spectra of human tongue noninvasively. Colon cancerColon cancer, also known as colorectal cancer, is a malignant disease of the colon or rectum, or appendix, and is the third leading cause of cancer death for both men and women.170 Pathological analysis is the basis of cancer diagnosis and treatment. Malignant tumor leads to considerable variation in nuclei size and shape. Traditionally, pathologists examine the specimens under the microscopes and make judgments based on the deviations in the cell structures and changes in the distribution of the cells across the tissue under examination. However, this process is time-consuming, subjective, and inconsistent due to inter- and intraobserver variations.171 To overcome these problems, MHSI has been applied to discriminate different cell types and tissue patterns based on pathology slides. Histology study: Masood and colleagues explored a series of research problems for classification of hyperspectral colon biopsy images. First, they performed morphological analysis of gland nuclei cells and classified them into normal and malignant classes based on the shape, size, orientation, and other geometrical attributes of the cellular components. From this, they concluded that HSI has enough discriminatory power to distinguish normal and malignant biopsy tissues.117 Second, they selected a single band that was considered to contain sufficient textural information. Then they classified colon biopsy samples into benign and malignant classes based on the textural information extracted from the single band and achieved a reasonable classification result.142,158 Third, they compared the classification result of a single band with 3-D spectral/spatial analysis, and the former achieved comparable accuracy for SVM-based classification of 32 hyperspectral images of colon biopsy samples.118,159 While Masood mainly focused on classifying the colon biopsy tissue into benign and malignant types, Maggioni et al.84 provided evidence that with a hyperspectral microscope, the H&E-stained microarray sections of the colon tissue could be classified into normal, benign (adenoma), and malignant (carcinoma). Traditional microscope has a limited field of view; therefore, multiple images must be taken and tiled together to form a complete image of the entire tissue specimen, which is time-consuming and can introduce artifacts in the composite image. To address these issues, Constantinou et al.124 developed a confocal scanning macroscope integrated with a prototype HSI mode to detect fluorescently labeled antibodies and remove autofluorescence in paraffin-embedded, formalin-fixed tissues with linear unmixing method. The system was evaluated in the xenograft tissue of a mouse model with human colonic adenocarcinoma. The prototype MHSI had the ability to simultaneously image multiple fluorescently labeled tissue-specific markers in large biological samples in a time- and cost-efficient way. 5.1.2.Heart and circulatory pathologyHeart disease continues to be the leading cause of death for both men and women in the United States. Each year, one in every four deaths in the United States is caused by heart disease. HSI has been explored in heart and circulatory pathology both in vivo (animal and human studies) and in vitro. In vivo study. Peripheral arterial disease (PAD) involves the atherosclerotic occlusion of the arterial circulation to lower extremity,172 which may lead to rest pain, lower extremity ulceration, and even limb amputation.151 Effective diagnostic and prognostic technologies are necessary for earlier detection and treatment to avoid unnecessary complications and interventions. However, traditional methods, such as ankle-brachial index, Doppler waveform analysis, segmental limb pressure, etc., did not provide high specificity and sensitivity for the prediction of the healing of tissue loss in PAD patients.151 HSI has the capacity of noninvasively measuring oxyhemoglobin and deoxyhemoglobin concentrations to create an anatomic oxygenation map.173,174 Chin et al.151 scanned patients with and without PAD with a visible HSI system and acquired the concentration of oxyhemoglobin and deoxyhomoglobin. Experiments showed that HSI might be useful in detecting differences in oxygenation levels in the lower extremities of patients with and without PAD. Their data also suggested that HSI may be a useful tool for the diagnosis and evaluation of patients with PAD. In vitro study. Coronary artery disease is a leading cause of death and morbidity worldwide.175 It arises from atherosclerosis through a slowly progressing lesion formation and luminal narrowing of arteries. Upon plaque rupture and thrombosis, cardiovascular disease, such as acute coronary syndrome, myocardial infarction, or stroke, is likely to happen. Thorough knowledge of the properties of both the lesion and the adjacent vessel wall is required for the diagnosis of atherosclerosis and the determination of the right time for intervention, choice of treatment, and assessment of prognosis.50 The standard method for diagnosing and evaluating atherosclerosis is angiography, which is limited to the detection of stenotic plaques.50 Reflectance and fluorescence spectroscopies have been explored as diagnostic tools for atherosclerosis, such as distinguishing fibrous plaque from healthy arterial wall,176 identifying atherosclerotic regions in arteries,177 and superficial foam cells in coronary plaques prone to erosion in vivo.178 However, it was observed that most of the advanced lesions had a central region surrounded by an outer rim or shoulder-region of the plaque, which is considered a weak spot in vulnerable lesions.50 The spatial variation of plaque makes it difficult for conventional single-point spectroscopic measurements to classify a plaque correctly. HSI holds great promise for diagnosis of atherosclerosis by probing a large area of tissue under investigation and providing spectral information for each pixel in the area of interest. Larsen et al.50 collected hyperspectral reflectance and fluorescence data from excised aorta samples in vitro, using both white-light and UV illuminations. Plaque features, such as lipids and calcifications, could be identified from white-light reflectance and UV-excited fluorescence hyperspectral images, and HSI was shown to identify the complexity and large heterogeneity of such plaques as compared to the histology. 5.1.3.Retinal diseasesThe delicate nature of the eye usually precludes invasive biopsy or mechanical access to the retina. Therefore, current diagnosis of retinal disease relies strongly upon optical imaging methods.179 An HSI system is usually integrated with a fundus camera to enable optical imaging of the eyes. Early in 1999, Cohen et al.179 reported the use of HSI for mapping wavelength-resolved reflectivity across a 2-D scene in order to quantify retinal images and hence offer possibility for both early detection and monitoring of the effectiveness of therapy. Khoobehi et al.89 attached a fundus camera to an HSI for monitoring relative spatial changes in retinal oxygen saturation. The integrated system can be adapted to measure and map relative oxygen saturation in retinal structures and the optic nerve head in nonhuman primate eyes. Hirohara et al.113 measured the intensities of different wavelengths of light that were transmitted through the artery, vein, and the area surrounding these vessels and reflected out. A hyperspectral fundus imaging camera was used to capture and analyze the spectral absorptions of the vessels. Johnson et al.44 developed a snapshot HSI system with no moving parts or NB filters in order to perform functional mapping of the human retina. The hemoglobin spectral signatures provided both qualitative and quantitative oxygen saturation maps (see Fig. 4) for monitoring retinal ischemia from either systemic diseases, such as diabetes, or from localized retinal arterial and vascular occlusions, which are the leading causes of untreatable blindness. Figure 4 shows an image of the optic disk for two healthy volunteers. The results showed a clear distinction between veins, arteries, and the background. Regions within vessel capillaries agreed well with the 30 to 35% oxygen saturation difference expected for healthy veins and arteries. The saturation for most of the background spatial locations in between the capillary regions showed a tendency to be within the 90 to 100% regime. This was consistent with the subjects being healthy.44 This system is capable of acquiring a complete spatial-spectral image cube of 450 to 700 nm with 50 bands in and without motion artifacts or pixel misregistration. This approach is ideal for exploring the potential of retinal applications since the eye is constantly moving and often requires snapshot camera operation. Fig. 4Spatial oxygen saturation maps. (a) Oxygen saturation map of 29-year-old healthy male. Vascular separation from the background is seen as well as reasonable saturation values for veins versus arteries. (b) Zero-order color image. (c) Oxygen saturation map of 58-year-old healthy male. (d) Zero-order color images.44  Age-related macular-degeneration (AMD) is a major cause of blindness in the elderly, and the prevalence of the disease increases exponentially with every decade after age 50.180 Cell protein cytochrome-c has been identified as a key signaling molecule in the degeneration processes and apoptosis. Schweizer et al.121 developed an HSI system to collect spectroscopic data, which provided information about the oxidative state of cytochrome-c during oxidative stress for detection of AMD. Fawzi et al.76 applied CTIS to quantify the macular pigment (MP) in a group of healthy eyes in vivo. They successfully recovered the detailed spectral absorption curves for MP in vivo that correspond to physically realistic retinal distributions. 5.1.4.Diabetic footDiabetic foot ulceration is a major complication of diabetes, and diabetic patients have up to a 25% lifetime risk of developing a foot ulcer.181 If untreated, diabetic foot ulcers may become infected and require total or partial amputation of the affected limb. Changes in the large vessels and microcirculation of the diabetic foot are important in the development of diabetic foot ulceration and subsequent failure to heal existing ulcers. Greenman et al.37 used an MHSI system to investigate the hemoglobin saturation () in the forearm and foot. It was found that tissue was reduced in the skin of patients with diabetes. Khaodhiar et al.182 carried on a clinical study of 10 type 1 diabetic patients with 21 foot ulcer sites, 13 type 1 diabetic patients without ulcers, and 14 nondiabetic control subjects. MHSI predicted diabetic foot ulcer healing with a sensitivity of 93% and specificity of 86%. Tissue oxy- and deoxyhemoglobin on the upper and lower extremity distant from the ulcer were used to quantify the tissue in the study. Yudovsky et al.183 reviewed how HSI between 450 and 700 nm could be used to assess the risk of diabetic foot ulcer development and to predict the likelihood of healing noninvasively. Two methods were described to analyze the in vivo hyperspectral measurements. The first method was based on the modified Beer-Lambert law and produced a map of oxyhemoglobin and deoxyhemoglobin concentrations in the dermis of the foot. The second was based on a two-layer optical model of skin. It could retrieve not only oxyhemoglobin and deoxyhemoglobin concentrations, but also epidermal thickness and melanin concentration along with skin scattering properties. It could detect changes in the diabetic foot and help predict and understand ulceration mechanisms. In another study, the same group51 reported the use of a hyperspectral tissue oximetry in predicting the risk of diabetic foot ulcer formation with a sensitivity and specificity of 95 and 80%, respectively. A later study184 found that epidermal thickening and decrease in oxyhemoglobin concentration could also be detected prior to ulceration at preulcerative sites. 5.1.5.ShockAs the body’s largest and most accessible organ, the skin often manifested changes in the systemic circulation, which is important for the diagnosis of patients in shock. MHSI offers a new and exciting means of measuring both the spatial and temporal variations in skin hemodynamics. Gillies et al.128 evaluated the ability of MHSI to depict and quantify the cutaneous manifestations of shock using a porcine model. Shock was induced by chest trauma followed by hemorrhage. Quantitative and qualitative changes were observed in the level of skin oxygenation during shock and recovery. A mottled pattern of oxygen saturation was observed during hemorrhagic shock instead of during hypovolemic shock or following resuscitation. The study showed that noninvasive imaging of skin oxygen saturation could potentially be useful in monitoring the response of the microvasculature to shock and subsequent treatment. Variation in cutaneous blood flow distribution and hemoglobin saturation measured by MHSI may offer new insights into the pathophysiology and treatment of shock. Skin color changes and mottling are frequently described signs of hemorrhagic shock (HEM). Cancio et al.40 developed a noninvasive, noncontact HSI system to quantify and depict the surface tissue saturation of oxygen () for each pixel in a region of interest. A study of 17 female pigs showed linear decreases in both mean and oxyhemoglobin () values with blood loss, which were reversed by resuscitation. HSI is a promising noninvasive and noncontact tool for quantifying changes in skin oxygenation during HEM and resuscitation. 5.1.6.OthersBy recording the variations in the percentages of oxygen saturation of hemoglobin, optical methods are able to monitor the visible and near-IR spectral properties of the blood. Zuzak et al.105,106 measured the changes in the spatial distribution of regional tissue oxygenation during vascular occlusion and reperfusion. This method was able to noninvasively visualize and differentiate between normal and ischemic tissue. This approach may have a variety of applications in surgical and diagnostic procedures. In the same group, a visible-reflectance HSI system was introduced to quantify the percentage of as an index of skin tissue perfusion. The HSI system demonstrated (1) a significant decline in the percentage of in skin tissue when blood flow is reduced after inhibition of forearm nitride oxide synthesis and (2) restoration of toward basal values with improved blood flow during inhalation of nitride oxide.185 In a clinical study,107 the same group used a visible reflectance HSI system to examine a model of vascular dysfunction involving both ischemia and reactive hyperemia during tissue perfusion. The method was based on oxyhemoglobin and deoxyhemoglobin signals from spectral images in the 525- to 645-nm region. It was able to visualize the spatial distribution of percentages of oxyhemoglobin and deoxyhemoglobin in the specific skin tissue areas. Another important application of HSI in histopathological examination of tissue is a combination of hyperspectral instruments with other techniques, such as microscope, macroscope, micromachined angular filter array, or snapshot fiber bundle. Huebschman et al.186 took advantage of the continuous spectrum collected for each image pixel by a hyperspectral microscopy system to scan and analyze pathology tissue samples. Those samples were stained with four standard fluorochromes attached to specific antibodies, typically across the wavelength range of 420 to 785 nm, with the longest wavelength markers emitting in the spectral region where the human eye was not sensitive. Begin et al.115 presented a wavelength-swept approach to coherent anti-Stokes Raman scattering microscopy. The system was especially well suited for experiments on thick tissue, where scattering played an important role. It bridged an important gap between fundamental research microscopy tools and clinically useful instruments by combining the context of imaging with the richness of spectroscopic information. Vasefi et al.187 proposed an innovative MHSI technology called angular domain spectroscopic imaging that retained submillimeter spatial resolution as well as high spectral resolution through tissue specimens up to 3 mm thick (cross-section diagram of tissue sample is shown in Fig. 5). Khoobehi et al.188 developed an innovative snapshot HSI system that detected the whole spectrum of hemoglobin using the single light exposure capability of a fundus camera. It was able to record the hemoglobin signature of the retinal arteries, veins, and retina tissue. Sowa et al.127 revealed that differences in tissue reflectance correlates with the varying degrees of tissue perfusion immediately following surgical elevation of the reversed McFarlane skin flap. Fig. 5(a) Cross-section diagram of tissue sample for angular-domain spectroscopic imaging testing. (b) Color photographs of mouse tumor tissue sandwiched between two glass slides. The opening due to the black mask that was used for transmission imaging is marked by the yellow dashed line. The black line (left panel) indicates the location of bone embedded in the tissue. (c) Normalized spectra from regions of tumor and muscle tissue [as indicated in (b)]. (d) Correlation map of data cube based on reference spectral signature related to the muscle tissue. (e) Correlation map of data cube based on reference spectral signature related to the tumor tissue.187  5.2.Surgical GuidanceThe success of surgery highly depends on a surgeon’s ability to see, feel, and make judgments to identify the lesion and its margins.189 MHSI holds the potential to extend a surgeon’s vision at the molecular, cellular, and tissue levels. The ability of MHSI as an intraoperative visual aid tool has been explored in many surgeries. First, MHSI could help surgeons to visualize the surgical bed under the blood. Visual inspection is critical in microsurgery. However, the inevitable presence of blood spilling over the surgical field is a large visual obstacle to a successful surgery. Therefore, NIR HSI spectrograph was utilized to visualize tissues submerged in a blood layer that could not be seen with the naked eye.93,190 Second, MHSI could facilitate residual tumor detection.45 Surgery remains the foundation of cancer treatment, with the central objective of maximizing the removal of the tumor, without harming adjacent normal tissue. However, cancerous tissue is often indistinguishable from healthy tissue in the operating room, which leads to the high mortality rates from recurrent tumors. The rationale of residual tumor detection by MHSI lies in the fact that MHSI is able to distinguish the spectral difference of the normal and cancerous tissue in nearly real time during the procedure.45 Third, MHSI could monitor the tissue oxygen saturation during surgery. Tissue blood flow or oxygenation is a positive indicator of viable tissue, which might be otherwise sacrificed when removing tumor with little guidance. It has been shown in Ref. 191 that HSI could monitor the tissue at a rate of 3 frames per second and, thus, could detect dynamic changes in blood flow and capture unexpected events during surgery. Finally, MHSI could enable the visualization of the anatomy of vasculatures and organs during surgery. MHSI has the capacity of real-time imaging, which enables the surgeon to make or confirm diagnosis and evaluate surgical therapy in an ongoing fashion in the operation room.189 Overall, MHSI has been explored in surgeries, such as mastectomy,45 gall bladder surgery,192 cholecystectomy,54,133 nephrectomy,193,194 renal surgery,80,191,193,195,196 abdominal surgery,95 and intestinal surgery.91 The following section will introduce these researches in details. 5.2.1.MastectomyAlthough of patients with breast cancer undergo primary surgical treatment with mastectomy, the rates of complete resection remain surprisingly low and re-excision rates in breast lumpectomy have been reported to be as high as 40% in some studies.197 Residual tumors that were not apparent to the surgeon at the time of the procedure were often found at the margin of the resected specimen. Therefore, intraoperative assessment of residual tumor is critical for complete resection. Panasyuk et al.45 successfully detected residual tumors of 0.5 to 1.0 mm intentionally left in the operative bed (see Fig. 6) during an intraoperative experiment using MHSI in a rat breast-tumor model. The rat breast tumors were first exposed and imaged by MHSI, then partially resected, and imaged again with MHSI. They successfully identified and differentiated tumors, blood vessels, muscle, and connective tissue by MHSI. A sensitivity of 89% and a specificity of 94% for the detection of residual tumors, comparable to that of histopathological examination of the tumor bed, were reported. With the aid of MHSI, more extensive resection and more effective biopsy locations may be identified. The complete resection of tumor tissue and the conservation of normal tissue may improve surgery outcome, preservation of organ function, patient satisfaction, and quality of life. Fig. 6(a) Photomicroscopic and corresponding medical hyperspectral imaging image from breast tumor in situ () (upper left and upper middle panels). Resected tumor and surrounding tissue () was stained with hematoxylin and eosin and evaluated by histopathology after resection. Microscopic histological images with further resolution are displayed (right panels). (b) Representative examples of normal tissue (grade 0), benign tumor (grade 1), intraductal carcinomas (grade 2), papillary and cribriform carcinoma (grade 3), and carcinoma with invasion (grade 4) are represented.45 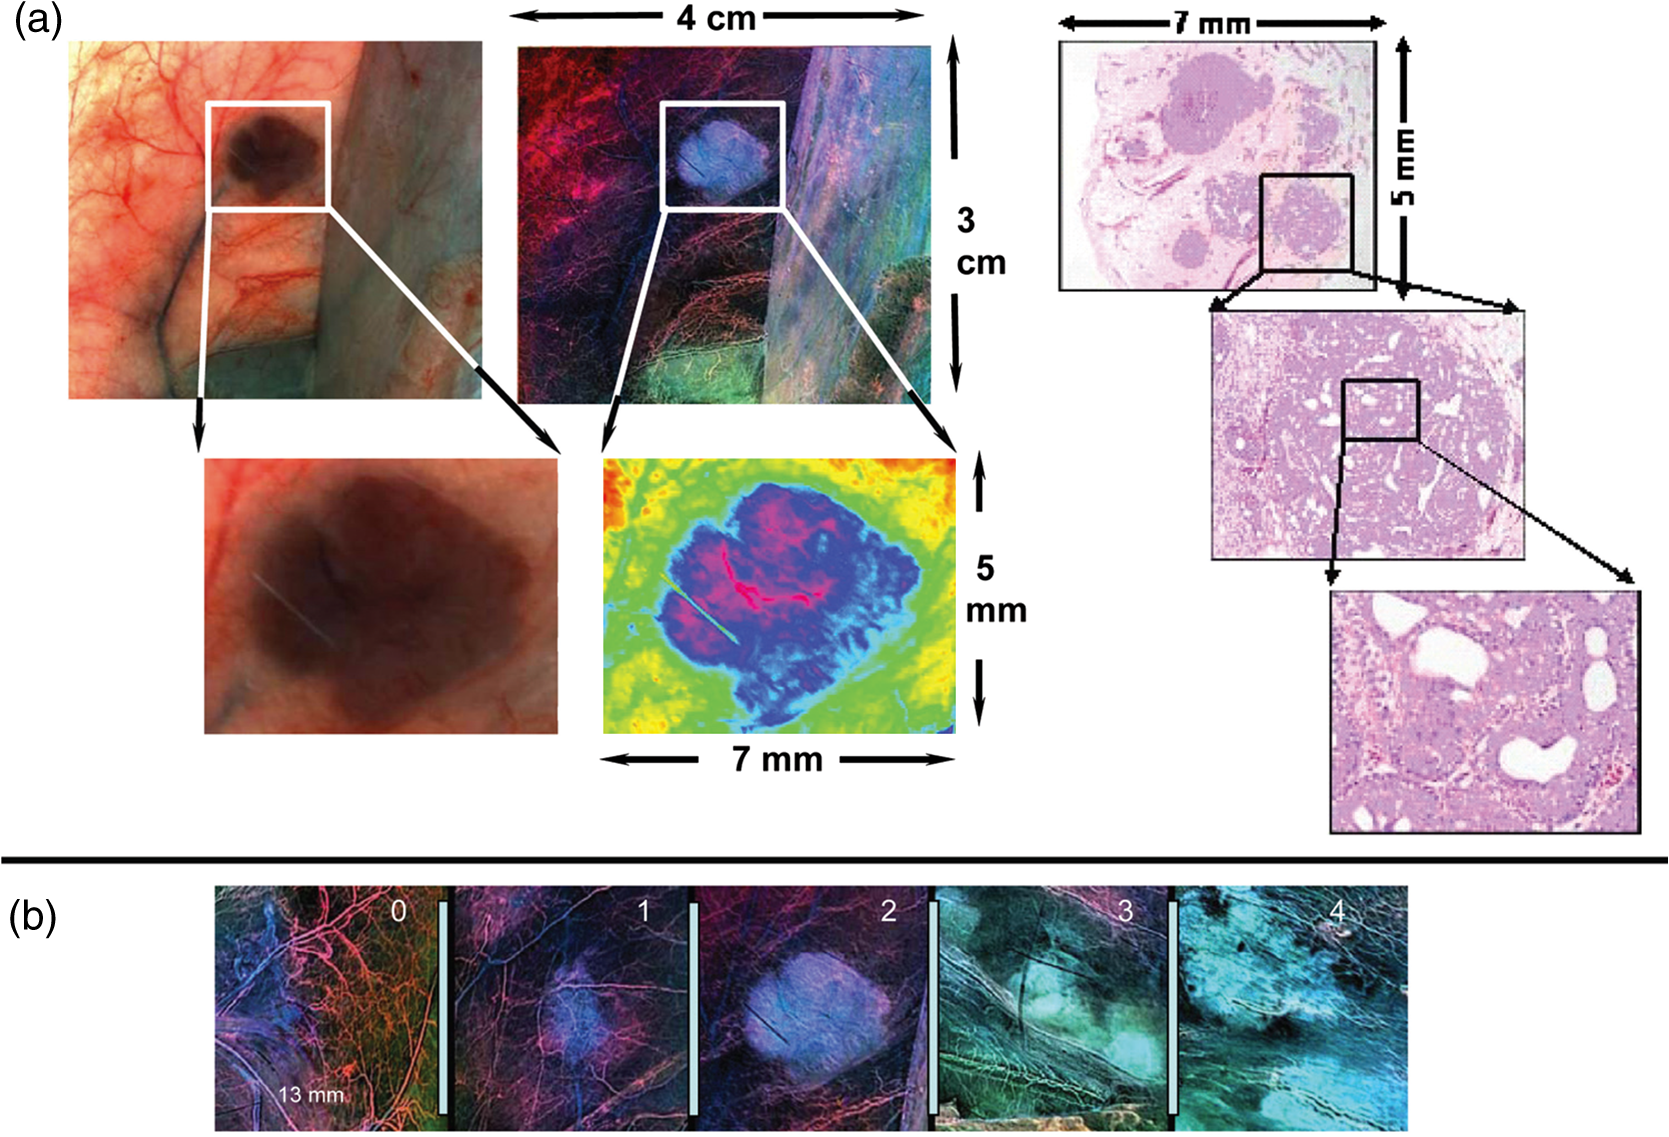 5.2.2.Gall bladder surgeryDiseases of the gall bladder, such as symptomatic gallstones and other gallbladder conditions, often require the surgical removal of the gall bladder, i.e., cholecystectomy, one of the most commonly performed surgeries in the United States. Standard surgical procedure is a closed laparoscopic cholecystectomy. The procedure involves several small incisions in the abdomen with diameters of 5 to 10 mm. Surgical instruments and a video camera are placed into the abdominal cavity. In this case, surgeons lost tactile feedback, and the conventional video camera through an endoscope to identify the biliary tree had limited image contrast. Therefore, Zuzak et al.46 developed an endoscope-based HSI system to identify the anatomy and molecular content of tissue during a laparoscopic surgery on swine. The study showed the utility of near-IR laparoscopic HSI for noninvasive interrogation and identification of tissues based on their chemical composition in a real-time intraoperative manner and without radioactive contrast agent. They found that lipids absorbing light at 930 nm could be used as an inherent biomarker for imaging the lipid-containing bile ducts connecting the gall bladder, the location of which the surgeon needs to identify before cutting during cholecystectomy. In order to help surgeons delineate the hepatoduodenal ligament anatomy to avoid causing serious harm to the biliary tree, they133 also built a laparoscopic-capable, near-IR, HSI system for intraoperative biliary imaging in a pig, which enabled surgeons to see through the hepatoduodenal ligament and visualize the anteriorly placed biliary system. They again confirmed the common duct-reflected spectra of porcine biliary structures to have a characteristic lipid shoulder at 930 nm and a strong water peak at 970 nm. Venous structures had absorption peaks at 760 nm (deoxyhemoglobin), 800 nm (oxyhemoglobin), and 970 nm (water). Arterial vessels had absorption peaks at 800 and 970 nm, which would be expected for oxyhemoglobin and water. Therefore, arterial vessels, venous structures, and bile ducts can be visualized through the hepatoduodenal ligament connective tissue during closed laparoscopic procedures. In an ex vivo tissue study, Mitra et al.54 used both reflectance and fluorescence imaging to scan the biliary structure and implemented advanced spectral analysis and image-processing algorithms to classify the tissue types and to identify the biliary anatomy. While fluorescence imaging provided dynamic information on movement and flow in the surgical region of interest, data from HSI allowed for identification of the bile duct (see Fig. 7) and safe exclusion of any contaminant fluorescence from tissue that was not part of the biliary anatomy. Fig. 7(a) Photographic image of the biliary tissue structure. (b) Classification of the biliary tissue types based on hyperspectral imaging, superimposed with the fluorescence image of the encapsulate indocyanine green-loaded microballoons. The dual-mode image clearly identifies the biliary anatomy and its relative location with respect to the surrounding tissue components.  5.2.3.Renal surgeryAlthough open partial nephrectomy (OPN) is considered the gold-standard treatment for small () renal cortical tumors,198 laparoscopic partial nephrectomy (LPN) is also reported to achieve long-term oncologic outcomes comparable to those for OPN. To minimize the renal injuries caused by ischemia during surgery, it is very important to monitor renal response to ischemia in real time. Holzer et al.193 reported the first experiment with a digital light processing (DLP)-based HSI system covering 520 to 645 nm for hemoglobin to noninvasively measure renal parenchymal saturation and to determine the kidney response to hilar occlusion during OPN. Olweny et al.194 recently conducted another clinical study in 18 patients utilizing a DLP-based HSI to characterize renal oxygenation during robotic-assisted LPN. The laparoscopic HSI system successfully characterized dynamic changes in renal oxygenation during LPN. Renal hypothermia is often induced to lower the metabolic rate and to protect renal function during OPN, while warm ischemia is used for LPN because there is no efficient and effective method for inducing renal hypothermia laparoscopically.199 Using a digital light projection HSI system, Tracy et al.200 demonstrated that renal artery-only occlusion had a preliminary benefit to the postoperative glomerular filtration rate after warm ischemia during LPN in a porcine model. To make HSI practical for real-time surgical use, Zuzak et al.80,191,195,196 proposed to use a DLP-based HSI system that successfully visualized chemical composition of in vivo tissues during renal surgical procedures noninvasively at near video rate. The DLP HSI system used a programmable digital micro-mirror device capable of generating three processed images per second and allowing the surgeon to visualize chemical changes within fractions of a second. This overcame the primary limitation of traditional wavelength-scanning methods that collected data on physiological changes in minutes. To compare the capacity of the DLP NIR HSI system with that of the existent LCTF NIR HSI, Zuzak et al.80 performed studies on a porcine kidney during renal artery occlusion. The major difference between the two systems was their light source. Broadband light was discriminated into individual wavelengths in the LCTF system, which was replaced by the DLP light source to illuminate the tissue using predetermined spectra. It turned out that these two systems captured nearly identical spectra for the surface of the kidney. In 2010, Zuzak et al.196 tested the robustness of DLP HSI during OPN and other surgeries. The study showed the potential of DLP HSI in surface disorders visible at or near the surface of the skin to in vivo tissue monitor during surgery. 5.2.4.Abdominal surgeryIntestinal ischemia refers to a diminished intestinal blood flow, which compromises the delivery of oxygen and leads to the accumulation of deoxygenated blood and waste products. These conditions result in cell death and necrosis, leading to inflammation and ulcers. Due to the anatomical variations and unpredictable nature of surgeries, visibility is critical to correctly diagnose these problems during surgery. MHSI was able to distinguish differences among different tissues and organs and, therefore, allow surgeons to visualize and examine a vast area less invasively without actually removing tissue. Akbari et al.47,91,92 reported the use of MHSI as a visual supporting tool to detect intestinal ischemia and anatomy of organs through abdominal surgery on pigs. They identified a key wavelength range of 765 to 830 nm, which provided the best differentiation between normal and ischemic intestine. Spleen, colon, small intestine, urinary bladder, and peritoneum were segmented based on their unique spectral signatures (see Fig. 8). It was demonstrated that MHSI could help surgeons visualize the anatomy of blood vasculature, and differentiate between the artery and vein during abdominal surgeries.95 6.DiscussionsOver the past 25 years, various studies have shown the exciting potential of HSI techniques in medical applications. Based on the technology by NASA for space exploration and Earth observation, HSI acquires datasets that consist of 2-D images of spatial information and one spectral dimension at each pixel. HSI images offer more wavelength channels than RGB images taken by the ordinary color camera; therefore they may carry more useful information than RGB images. Differences that appear subtle to the human eye could be significant when looking at the detailed spectra. In addition, wavelengths such as UV and SWIR, which are invisible to the human eye, can be captured and analyzed by HSI, and can potentially reveal information that cannot be seen by the naked eye. MHSI is a noninvasive, and nonionizing technology, which provides a quantitative way of solving medical problems, and it may change the medical world in many ways. With the application of MHSI in the exploration of anatomy, physiology, and pathology, human vision has been extended into IR and near-IR wavelength regions. Due to the noninvasive nature, MHSI can be used for optical biopsy, which involves in vivo diagnosis of tissue without the need for sample excision and processing.201 Blood volume is generally considered to increase during angiogenesis, and changes in blood oxygenation can be correlated with tumor metabolic activities.42 Therefore, MHSI can be employed to map the spatial and temporal relationship of the data and fully grasp the significance of blood oxygen delivery and hypoxia at microvascular levels during tumor growth and angiogenesis.76 MHSI is also able to visualize chemical contents of vessels and organs, and monitor tissue blood volume and oxygenation during surgery. The use of MHSI does not require introduction of agents, which is advantageous compared to imaging techniques that require contrast agents. Moreover, MHSI is able to provide us with real-time data interactively,189 which enables its usage during surgical procedures. However, the application of MHSI can be limited because it examines only areas of tissue near the surface. The optical penetration depth is defined as the tissue thickness that reduces the light intensity to 37% of the intensity at the surface. For a typical person, the optical penetration depth is 3.57 mm at 850 nm and 0.48 mm at 550 nm. While spectral signatures have little dependence on skin temperature over the NIR region, measured radiance in the thermal infrared (8 to 12 μm) has a strong dependence on skin temperature.202 MHSI can also be limited by the cost of HSI imaging systems and by the ability to extract relevant information from large datasets. HSI combines spectroscopy with imaging, capturing both the spectral and spatial information of biological samples under investigation and providing spatial mapping of parameters of interest in a noninvasive manner. Spectroscopy is a point-measurement method that measures only a limited number of points, so that the derived optical properties may be biased by local tissue inhomogeneities and important diagnostic information could be missed. Pressure caused by the contact probe may also affect the optical properties due to the altered local blood content, etc.203 Although spectroscopy has been explored extensively for probing molecular, cellular, and tissue properties204–206 and characterizing correlation of tissue parameters with disease state,207 such fundamental research has not been investigated vigorously in HSI. Therefore, fundamental research about the biological rationale of MHSI is necessary, and spectroscopy can be used to validate HSI systems. It was argued that cross-talk between spatial locations could occur when extending to HSI, and the information extracted from one location might be influenced by neighboring locations.208 Martin et al.83 compared the average hyperspectral fluorescence over an area with a value obtained for one point on the tissue surface obtained by spectroscopy. They found that the major peaks were consistent between the HSI data and spectroscopic data. HSI technology is an indirect strategy to extract a spatial map of optical properties within the tissue since it deduces the interaction coefficients from measurements of reflectance and transmittance.209 This is an ill-posed inverse problem with no unique solution.210 It is possible for two media of substantially different optical properties to yield very similar optical measurements, such as the diffuse reflectance and transmittance.209 In practice, it is difficult to eliminate the ambiguities of matching spectral profiles with biological samples, and therefore, the presence of the fundamental nonuniqueness is another limitation of HSI. HSI can measure significant amounts of spectral information from a large area of tissue. Most literature reported the feasibility of a certain MHSI application without in-depth analysis of the image data obtained. Some results may suffer from a lack of generality because the image datasets are usually constrained to a specific instrument. Therefore, accessible, accurate, and up-to-date spectral databases of tissues, cells, and molecules for various diseases are needed in order to offer a valuable tool for disease diagnosis and treatment. For example, each subtype of renal tumors, such as clear cell, chromophobe, oncocytoma, papillary, and angiomyolipoma, can have different morphological and molecular characteristics and thus lead to the differences in spectra signature. Therefore, a spectral library for renal tumors may be able to provide the reference spectra in order to aid the interpretation of hyperspectral images. Furthermore, advanced data-mining methods are to be investigated in order to fully utilize the abundant spectral and spatial information provided by MHSI. With the increasing integration with other techniques, such as microscope, colposcope, laparoscope, and fundus camera, MSHI is becoming an essential part of medical imaging techniques, which provides important information at the molecular, cellular, tissue, and organ levels for potential clinical use. 7.ConclusionHSI technology acquires a 3-D image cube with two spatial dimensions and one spectral dimension in a noninvasive manner and in real time. Each pixel in the hypercube can be characterized by a spectral curve, which can range from UV to IR region. Spatially resolved spectra obtained by HSI provide diagnostic information about the tissue physiology, morphology, and composition. Furthermore, HSI can be easily adapted to other conventional techniques, such as microscopy, fundus camera, colposcopy, etc. As an emerging imaging technology, MHSI has been explored in a variety of laboratory experiments and clinical trials, which strongly suggested that HSI has a great potential for improving accuracy and reliability in disease detection, diagnosis, monitoring, and image-guided surgeries. Three major challenges confront the development and applications of HSI technology. The first challenge is the acquisition of high-resolution HSI datasets in video rates. Real-time acquisition will facilitate intraoperative imaging of the organs, tissues, cells, and molecular biomarkers of interest. Higher spectral and spatial resolution and a larger database of tissue spectra will provide more spatial and spectral information and may potentially capture more subtle spectral and spatial variations of different tissue types. The second challenge involves the fast processing of the vast amount of datasets acquired by HSI, including the extraction of the high-quality diagnostic information, and generation of a quantitative map of different tissue types as well as disease-specific endogenous substances. Advanced classification algorithms will enable better differentiation between healthy, premalignant, and malignant tissue, and more precise delineation of cancer margins for image-guided biopsy and surgery. Advanced spectral unmixing algorithms offer insight into the correlation between intrinsic biomarkers and disease states, and facilitate the identification of biomarkers for early cancer detection by recovering subpixel compositional information. The third challenge lies in the establishment of a large spectra database for important molecular biomarkers and all types of tissue, including skin and subcutaneous tissue, ocular tissue, head/brain tissue, epithelial/mucous tissue, breast tissue, cartilage, liver, muscle, aorta, lung, myocardium, etc. Such a database will make it possible to distinguish not only between oxygenated and deoxygenated blood, but also between different tissue types, such as bile duct and the fatty tissue surrounding it.196 The identification of the molecular biomarkers can also benefit early cancer detection. During the past two decades, HSI technology has undergone fast development in terms of hardware and systems, and has found numerous applications in medical domain. However, most MHSI only explores the UV, VIS, and NIR regions of light. Exploration of HSI on disease detection, diagnosis, and monitoring in the mid-IR region may bring new insights into the medical field. Moreover, combination with other imaging modalities, such as preoperative positron emission tomography and intraoperative ultrasound, can leverage the key benefits of each technique individually, overcome the penetration limitation of HSI into biological tissue,211 and broaden the application fields of HSI. In clinical settings, HSI can be easily adapted to conventional diagnostic tools, such as endoscope, colposcope, etc., to meet demanding requirements by various medical applications. Multimodal imaging combining reflectance and fluorescence has the potential of revealing more information about tissue under investigation. The clinical applicability of MHSI is clearly still in its adolescence and requires much more validation before it can be used safely and effectively in clinics. With the advancement of hardware technologies, image analysis methods, and computational power, we expect that HSI will play an important role for noninvasive disease diagnosis and monitoring, identification and quantitative analysis of cancer biomarkers, image-guided minimum invasive surgery, targeted drug delivery and tracking, and pharmaceutical drug dosage assessment. AcknowledgmentsThis research is supported in part by National Institute of Health grants (R01CA156775 and R21CA176684), Georgia Research Alliance Distinguished Scientists Award, Emory SPORE in Head and Neck Cancer (NIH P50CA128613), and Emory Molecular and Translational Imaging Center (NIH P50CA128301). ReferencesW. L. Wolfe, Introduction to Imaging Spectrometers, SPIE Press, Bellingham, Washington
(1997). Google Scholar
A. F. H. Goetz,
“Three decades of hyperspectral remote sensing of the Earth: a personal view,”
Remote Sens. Environ., 113
(Suppl. 1), S5
–S16
(2009). http://dx.doi.org/10.1016/j.rse.2007.12.014 RSEEA7 0034-4257 Google Scholar
C. FischerI. Kakoulli,
“Multispectral and hyperspectral imaging technologies in conservation: current research and potential applications,”
Stud. Conserv., 7 3
–16
(2006). SCONAH 0039-3630 Google Scholar
H. Liang,
“Advances in multispectral and hyperspectral imaging for archaeology and art conservation,”
Appl. Phys. A, 106
(2), 309
–323
(2012). http://dx.doi.org/10.1007/s00339-011-6689-1 APAMFC 0947-8396 Google Scholar
M. GovenderK. ChettyH. Bulcock,
“A review of hyperspectral remote sensing and its application in vegetation and water resource studies,”
Water SA, 33
(2), 145
–151
(2007). WASADV 0378-4738 Google Scholar
E. AdamO. MutangaD. Rugege,
“Multispectral and hyperspectral remote sensing for identification and mapping of wetland vegetation: a review,”
Wetlands Ecol. Manage., 18
(3), 281
–296
(2010). http://dx.doi.org/10.1007/s11273-009-9169-z WEMAEU 0923-4861 Google Scholar
A. A. Gowenet al.,
“Hyperspectral imaging—an emerging process analytical tool for food quality and safety control,”
Trends Food Sci. Technol., 18
(12), 590
–598
(2007). http://dx.doi.org/10.1016/j.tifs.2007.06.001 TFTEEH 0924-2244 Google Scholar
Y. Z. FengD. W. Sun,
“Application of hyperspectral imaging in food safety inspection and control: a review,”
Crit. Rev. Food Sci. Nutr., 52
(11), 1039
–1058
(2012). http://dx.doi.org/10.1080/10408398.2011.651542 CRFND6 0099-0248 Google Scholar
G. J. Edelmanet al.,
“Hyperspectral imaging for non-contact analysis of forensic traces,”
Forensic Sci. Int., 223
(1–3), 28
–39
(2012). http://dx.doi.org/10.1016/j.forsciint.2012.09.012 FSINDR 0379-0738 Google Scholar
D. B. MalkoffW. R. Oliver,
“Hyperspectral imaging applied to forensic medicine,”
Proc. SPIE, 3920 108
–116
(2000). http://dx.doi.org/10.1117/12.379589 PSISDG 0277-786X Google Scholar
J. Kuulaet al.,
“Using VIS/NIR and IR spectral cameras for detecting and separating crime scene details,”
Proc. SPIE, 8359 83590P
(2012). http://dx.doi.org/10.1117/12.918555 PSISDG 0277-786X Google Scholar
R. L. SchulerP. E. KishC. A. Plese,
“Preliminary observations on the ability of hyperspectral imaging to provide detection and visualization of bloodstain patterns on black fabrics,”
J. Forensic Sci., 57
(6), 1562
–1569
(2012). http://dx.doi.org/10.1111/j.1556-4029.2012.02171.x JFSCAS 0022-1198 Google Scholar
O. Carrascoet al.,
“Hyperspectral imaging applied to medical diagnoses and food safety,”
Proc. SPIE, 5097 215
–221
(2003). http://dx.doi.org/10.1117/12.502589 PSISDG 0277-786X Google Scholar
M. A. Afromowitzet al.,
“Multispectral imaging of burn wounds: a new clinical instrument for evaluating burn depth,”
IEEE Trans. Biomed. Eng., 35
(10), 842
–850
(1988). http://dx.doi.org/10.1109/10.7291 IEBEAX 0018-9294 Google Scholar
G. Zonioset al.,
“Diffuse reflectance spectroscopy of human adenomatous colon polyps in vivo,”
Appl. Opt., 38
(31), 6628
–6637
(1999). http://dx.doi.org/10.1364/AO.38.006628 APOPAI 0003-6935 Google Scholar
L. V. WangH.-I. Wu,
“Introduction,”
Biomedical Optics, 1
–15 John Wiley & Sons Inc., Hoboken, New Jersey
(2009). Google Scholar
B. CostasP. ChristosE. George,
“Multi/hyper-spectral imaging,”
Handbook of Biomedical Optics, 131
–164 CRC Press(2011). Google Scholar
V. V. TuchinV. Tuchin, Tissue Optics: Light Scattering Methods and Instruments for Medical Diagnosis, SPIE Press, Bellingham
(2007). Google Scholar
D. G. Ferriset al.,
“Multimodal hyperspectral imaging for the noninvasive diagnosis of cervical neoplasia,”
J. Low. Genit. Tract Dis., 5
(2), 65
–72
(2001). 1089-2591 Google Scholar
M. C. Pierceet al.,
“Accuracy of in vivo multimodal optical imaging for detection of oral neoplasia,”
Cancer Prev. Res., 5
(6), 801
–809
(2012). http://dx.doi.org/10.1158/1940-6207.CAPR-11-0555 CPRACC 1940-6207 Google Scholar
R. Salzeret al.,
“Infrared and Raman imaging of biological and biomimetic samples,”
Fresenius J. Anal. Chem., 366
(6–7), 712
–726
(2000). http://dx.doi.org/10.1007/s002160051565 FJACES 0937-0633 Google Scholar
C. GendrinY. RoggoC. Collet,
“Pharmaceutical applications of vibrational chemical imaging and chemometrics: a review,”
J. Pharm. Biomed. Anal., 48
(3), 533
–553
(2008). http://dx.doi.org/10.1016/j.jpba.2008.08.014 JPBADA 0731-7085 Google Scholar
M. PattersonB. WilsonD. Wyman,
“The propagation of optical radiation in tissue I. Models of radiation transport and their application,”
Lasers Med. Sci., 6
(2), 155
–168
(1991). http://dx.doi.org/10.1007/BF02032543 LMSCEZ 1435-604X Google Scholar
M. JoelV.-D. Tuan,
“Optical properties of tissue,”
Biomedical Photonics Handbook, 1
–76 CRC Press, Boca Raton, Florida
(2003). Google Scholar
Y. Zhanget al.,
“Visible and near-infrared spectroscopy for distinguishing malignant tumor tissue from benign tumor and normal breast tissues in vitro,”
J. Biomed. Opt., 18
(7), 077003
(2013). http://dx.doi.org/10.1117/1.JBO.18.7.077003 JBOPFO 1083-3668 Google Scholar
A. WelchM. C. GemertW. Star,
“Definitions and overview of tissue optics,”
Optical-Thermal Response of Laser-Irradiated Tissue, 27
–64 Springer, Netherlands
(2011). Google Scholar
A. Rogganet al.,
“The optical properties of biological tissue in the near infrared wavelength range: review and measurements,”
in Laser-Induced Interstitial Thermotherapy Workshop,
10
–44
(1995). Google Scholar
J. A. Freeberget al.,
“The performance of fluorescence and reflectance spectroscopy for the in vivo diagnosis of cervical neoplasia; point probe versus multispectral approaches,”
Gynecol. Oncol., 107
(1), S248
–S255
(2007). http://dx.doi.org/10.1016/j.ygyno.2007.07.008 GYNOA3 0090-8258 Google Scholar
V.-D. TuanM. C. Brian,
“Fluorescence spectroscopy for biomedical diagnostics,”
Biomedical Photonics Handbook, 1
–51 CRC Press, Boca Raton, Florida
(2003). Google Scholar
V. T. Valery,
“Light-tissue interactions,”
Biomedical Photonics Handbook, 1
–27 CRC Press, Boca Raton, Florida
(2003). Google Scholar
M. SashaM. JelenaF. Michael,
“Reflectance spectroscopy,”
Handbook of Biomedical Optics, 103
–130 CRC Press(2011). Google Scholar
D. Roblyeret al.,
“Multispectral optical imaging device for in vivo detection of oral neoplasia,”
J. Biomed. Opt., 13
(2), 024019
(2008). http://dx.doi.org/10.1117/1.2904658 JBOPFO 1083-3668 Google Scholar
K. R. Kohet al.,
“Visible and near infrared autofluorescence and hyperspectral imaging spectroscopy for the investigation of colorectal lesions and detection of exogenous fluorophores,”
Proc. SPIE, 7169 71691E
(2009). http://dx.doi.org/10.1117/12.809313 PSISDG 0277-786X Google Scholar
J. M. Benavideset al.,
“Multispectral digital colposcopy for in vivo detection of cervical cancer,”
Opt. Express, 11
(10), 1223
–1236
(2003). http://dx.doi.org/10.1364/OE.11.001223 OPEXFF 1094-4087 Google Scholar
S. Shahet al.,
“Cutaneous wound analysis using hyperspectral imaging,”
Biotechniques, 34
(2), 408
–413
(2003). BTNQDO 0736-6205 Google Scholar
K. R. Bamberyet al.,
“Fourier transform infrared imaging and unsupervised hierarchical clustering applied to cervical biopsies,”
Aust. J. Chem., 57
(12), 1139
–1143
(2004). http://dx.doi.org/10.1071/CH04137 AJCHAS 0004-9425 Google Scholar
R. L. Greenmanet al.,
“Early changes in the skin microcirculation and muscle metabolism of the diabetic foot,”
Lancet, 366
(9498), 1711
–1717
(2005). http://dx.doi.org/10.1016/S0140-6736(05)67696-9 LANCAO 0140-6736 Google Scholar
B. S. Sorget al.,
“Hyperspectral imaging of hemoglobin saturation in tumor microvasculature and tumor hypoxia development,”
J. Biomed. Opt., 10
(4), 44004
(2005). http://dx.doi.org/10.1117/1.2003369 JBOPFO 1083-3668 Google Scholar
S. G. KongM. E. MartinT. Vo-Dinh,
“Hyperspectral fluorescence imaging for mouse skin tumor detection,”
Anglais, 28
(6), 770
–776
(2006). http://dx.doi.org/10.4218/etrij.06.0106.0061 1225-6463 Google Scholar
L. C. Cancioet al.,
“Hyperspectral imaging: a new approach to the diagnosis of hemorrhagic shock,”
J. Trauma Acute Care Surg., 60
(5), 1087
–1095
(2006). http://dx.doi.org/10.1097/01.ta.0000217357.10617.3d JTACA2 2163-0755 Google Scholar
D. T. Dickeret al.,
“Differentiation of normal skin and melanoma using high resolution hyperspectral imaging,”
Cancer Biol. Ther., 5
(8), 1033
–1038
(2006). http://dx.doi.org/10.4161/cbt CBTAAO 1538-4047 Google Scholar
L. L. Randeberget al.,
“Hyperspectral imaging of bruised skin,”
Proc. SPIE, 6078 60780O
(2006). http://dx.doi.org/10.1117/12.646557 PSISDG 0277-786X Google Scholar
L. L. RandebergJ. Hernandez-Palacios,
“Hyperspectral imaging of bruises in the SWIR spectral region,”
Proc. SPIE, 8207 82070N
(2012). http://dx.doi.org/10.1117/12.909137 PSISDG 0277-786X Google Scholar
W. R. Johnsonet al.,
“Snapshot hyperspectral imaging in ophthalmology,”
J. Biomed. Opt., 12
(1), 014036
(2007). http://dx.doi.org/10.1117/1.2434950 JBOPFO 1083-3668 Google Scholar
S. V. Panasyuket al.,
“Medical hyperspectral imaging to facilitate residual tumor identification during surgery,”
Cancer Biol. Ther., 6
(3), 439
–446
(2007). http://dx.doi.org/10.4161/cbt CBTAAO 1538-4047 Google Scholar
K. J. Zuzaket al.,
“Characterization of a near-infrared laparoscopic hyperspectral imaging system for minimally invasive surgery,”
Anal. Chem., 79
(12), 4709
–4715
(2007). http://dx.doi.org/10.1021/ac070367n ANCHAM 0003-2700 Google Scholar
H. Akbariet al.,
“Detection and analysis of the intestinal ischemia using visible and invisible hyperspectral imaging,”
IEEE Trans. Biomed. Eng., 57
(8), 2011
–2017
(2010). http://dx.doi.org/10.1109/TBME.2010.2049110 IEBEAX 0018-9294 Google Scholar
H. Akbariet al.,
“Cancer detection using infrared hyperspectral imaging,”
Cancer Sci., 102
(4), 852
–857
(2011). http://dx.doi.org/10.1111/cas.2011.102.issue-4 CSACCM 1349-7006 Google Scholar
R. T. Kesteret al.,
“Real-time snapshot hyperspectral imaging endoscope,”
J. Biomed. Opt., 16
(5), 056005
(2011). http://dx.doi.org/10.1117/1.3574756 JBOPFO 1083-3668 Google Scholar
E. L. P. Larsenet al.,
“Hyperspectral imaging of atherosclerotic plaques in vitro,”
J. Biomed. Opt., 16
(2), 026011
(2011). http://dx.doi.org/10.1117/1.3540657 JBOPFO 1083-3668 Google Scholar
D. Yudovskyet al.,
“Assessing diabetic foot ulcer development risk with hyperspectral tissue oximetry,”
J. Biomed. Opt., 16
(2), 026009
(2011). http://dx.doi.org/10.1117/1.3535592 JBOPFO 1083-3668 Google Scholar
H. Akbariet al.,
“Hyperspectral imaging and quantitative analysis for prostate cancer detection,”
J. Biomed. Opt., 17
(7), 076005
(2012). http://dx.doi.org/10.1117/1.JBO.17.7.076005 JBOPFO 1083-3668 Google Scholar
R. MartinB. ThiesA. Gerstner,
“Hyperspectral hybrid method classification for detecting altered mucosa of the human larynx,”
Int. J. Health Geogr., 11
(1), 21
(2012). http://dx.doi.org/10.1186/1476-072X-11-21 1476-072X Google Scholar
K. Mitraet al.,
“Indocyanine-green-loaded microballoons for biliary imaging in cholecystectomy,”
J. Biomed. Opt., 17
(11), 116025
(2012). http://dx.doi.org/10.1117/1.JBO.17.11.116025 JBOPFO 1083-3668 Google Scholar
T. E. RenkoskiK. D. HatchU. Utzinger,
“Wide-field spectral imaging of human ovary autofluorescence and oncologic diagnosis via previously collected probe data,”
J. Biomed. Opt., 17
(3), 036003
(2012). http://dx.doi.org/10.1117/1.JBO.17.3.036003 JBOPFO 1083-3668 Google Scholar
J. G. RosasM. Blanco,
“A criterion for assessing homogeneity distribution in hyperspectral images. Part 2: application of homogeneity indices to solid pharmaceutical dosage forms,”
J. Pharm. Biomed. Anal., 70
(0), 691
–699
(2012). http://dx.doi.org/10.1016/j.jpba.2012.06.037 JPBADA 0731-7085 Google Scholar
P. Useniket al.,
“Evaluation of cross-polarized near infrared hyperspectral imaging for early detection of dental caries,”
Proc. SPIE, 8208 82080G
(2012). http://dx.doi.org/10.1117/12.908763 PSISDG 0277-786X Google Scholar
Y. Guanet al.,
“Pathological leucocyte segmentation algorithm based on hyperspectral imaging technique,”
Opt. Eng., 51
(5), 053202
(2012). http://dx.doi.org/10.1117/1.OE.51.5.053202 OPEGAR 0091-3286 Google Scholar
Q. Liet al.,
“Nerve fibers identification based on molecular hyperspectral imaging technology,”
in IEEE Int. Conf. on Computer Science and Automation Engineering,
15
–17
(2012). Google Scholar
S. Kumaret al.,
“Change in the microenvironment of breast cancer studied by FTIR imaging,”
Analyst, 138
(14), 4058
–4065
(2013). http://dx.doi.org/10.1039/c3an00241a ANLYAG 0365-4885 Google Scholar
R. G. SellarG. D. Boreman,
“Classification of imaging spectrometers for remote sensing applications,”
Opt. Eng., 44
(1), 013602
(2005). http://dx.doi.org/10.1117/1.1813441 OPEGAR 0091-3286 Google Scholar
P. Colarussoet al.,
“Infrared spectroscopic imaging: from planetary to cellular systems,”
Appl. Spectrosc., 52
(3), 106A
–120A
(1998). http://dx.doi.org/10.1366/0003702981943545 APSPA4 0003-7028 Google Scholar
L. W. SchumannT. S. Lomheim,
“Infrared hyperspectral imaging Fourier transform and dispersive spectrometers: comparison of signal-to-noise-based performance,”
Proc. SPIE, 4480 1
–14
(2002). http://dx.doi.org/10.1117/12.453326 PSISDG 0277-786X Google Scholar
P. LaschD. Naumann,
“FT-IR microspectroscopic imaging of human carcinoma thin sections based on pattern recognition techniques,”
Cell. Mol. Biol. (Noisy-le-Grand), 44
(1), 189
–202
(1998). Google Scholar
K. Yanoet al.,
“Direct measurement of human lung cancerous and noncancerous tissues by Fourier transform infrared microscopy: can an infrared microscope be used as a clinical tool?,”
Anal. Biochem., 287
(2), 218
–225
(2000). http://dx.doi.org/10.1006/abio.2000.4872 ANBCA2 0003-2697 Google Scholar
S. Argovet al.,
“Diagnostic potential of Fourier-transform infrared microspectroscopy and advanced computational methods in colon cancer patients,”
J. Biomed. Opt., 7
(2), 248
–254
(2002). http://dx.doi.org/10.1117/1.1463051 JBOPFO 1083-3668 Google Scholar
B. R. Woodet al.,
“Fourier transform infrared (FTIR) spectral mapping of the cervical transformation zone, and dysplastic squamous epithelium,”
Gynecol. Oncol., 93
(1), 59
–68
(2004). http://dx.doi.org/10.1016/j.ygyno.2003.12.028 GYNOA3 0090-8258 Google Scholar
M. J. RomeoM. Diem,
“Infrared spectral imaging of lymph nodes: strategies for analysis and artifact reduction,”
Vib. Spectrosc., 38
(1–2), 115
–119
(2005). http://dx.doi.org/10.1016/j.vibspec.2005.03.009 VISPEK 0924-2031 Google Scholar
H. Fenniriet al.,
“Classification of spectroscopically encoded resins by Raman mapping and infrared hyperspectral imaging,”
J. Comb. Chem., 8
(2), 192
–198
(2006). http://dx.doi.org/10.1021/cc050128i JCCHFF 1520-4766 Google Scholar
A. BoskeyN. P. Camacho,
“FT-IR imaging of native and tissue-engineered bone and cartilage,”
Biomaterials, 28
(15), 2465
–2478
(2007). http://dx.doi.org/10.1016/j.biomaterials.2006.11.043 BIMADU 0142-9612 Google Scholar
M. Bermanet al.,
“ICE: a new method for the multivariate curve resolution of hyperspectral images,”
J. Chemom., 23
(2), 101
–116
(2009). http://dx.doi.org/10.1002/cem.v23:2 JOCHEU 0886-9383 Google Scholar
M. IsabelleK. RogersN. Stone,
“Correlation mapping: rapid method for identification of histological features and pathological classification in mid infrared spectroscopic images of lymph nodes,”
J. Biomed. Opt., 15
(2), 026030
(2010). http://dx.doi.org/10.1117/1.3386061 JBOPFO 1083-3668 Google Scholar
M. Verdoncket al.,
“Breast cancer and melanoma cell line identification by FTIR imaging after formalin-fixation and paraffin-embedding,”
Analyst, 138
(14), 4083
–4091
(2013). http://dx.doi.org/10.1039/c3an00246b ANLYAG 0365-4885 Google Scholar
P. A. Bernhardt,
“Direct reconstruction methods for hyperspectral imaging with rotational spectrotomography,”
Opt. Soc. Am., 12
(9), 1884
–1901
(1995). http://dx.doi.org/10.1364/JOSAA.12.001884 JOAOD6 1084-7529 Google Scholar
A. D. Elliottet al.,
“Real-time hyperspectral fluorescence imaging of pancreatic beta-cell dynamics with the image mapping spectrometer,”
J. Cell Sci., 125
(20), 4833
–4840
(2012). http://dx.doi.org/10.1242/jcs.108258 JNCSAI 0021-9533 Google Scholar
A. A. Fawziet al.,
“Recovery of macular pigment spectrum in vivo using hyperspectral image analysis,”
J. Biomed. Opt., 16
(10), 106008
(2011). http://dx.doi.org/10.1117/1.3640813 JBOPFO 1083-3668 Google Scholar
R. T. KesterN. BedardT. S. Tkaczyk,
“Image mapping spectrometry: a novel hyperspectral platform for rapid snapshot imaging,”
Proc. SPIE, 8048 80480J
(2011). http://dx.doi.org/10.1117/12.884627 PSISDG 0277-786X Google Scholar
G. BellisolaC. Sorio,
“Infrared spectroscopy and microscopy in cancer research and diagnosis,”
Am. J. Cancer Res., 2
(1), 1
–21
(2012). AJCRFT 2156-6976 Google Scholar
A. Nouvonget al.,
“Evaluation of diabetic foot ulcer healing with hyperspectral imaging of oxyhemoglobin and deoxyhemoglobin,”
Diabetes Care, 32
(11), 2056
–2061
(2009). http://dx.doi.org/10.2337/dc08-2246 DICAD2 0149-5992 Google Scholar
K. J. Zuzaket al.,
“Hyperspectral imaging utilizing LCTF and DLP technology for surgical and clinical applications,”
Proc. SPIE, 7170 71700C
(2009). http://dx.doi.org/10.1117/12.816279 PSISDG 0277-786X Google Scholar
A. M. Siddiqiet al.,
“Use of hyperspectral imaging to distinguish normal, precancerous, and cancerous cells,”
Cancer Cytopathol., 114
(1), 13
–21
(2008). CCAYB9 1934-662X Google Scholar
D.-W. Sun, Hyperspectral Imaging for Food Quality Analysis and Control, Academic Press Inc., London, UK
(2010). Google Scholar
M. E. Martinet al.,
“An AOTF-based dual-modality hyperspectral imaging system (DMHSI) capable of simultaneous fluorescence and reflectance imaging,”
Med. Eng. Phys., 28
(2), 149
–155
(2006). http://dx.doi.org/10.1016/j.medengphy.2005.04.022 MEPHEO 1350-4533 Google Scholar
M. Maggioniet al.,
“Hyperspectral microscopic analysis of normal, benign and carcinoma microarray tissue sections,”
Proc. SPIE, 6091 60910I
(2006). http://dx.doi.org/10.1117/12.646078 PSISDG 0277-786X Google Scholar
Q. Liet al.,
“Study on microscope hyperspectral medical imaging method for biomedical quantitative analysis,”
Chin. Sci. Bull., 53
(9), 1431
–1434
(2008). http://dx.doi.org/10.1007/s11434-008-0199-3 CSBUEF 1001-6538 Google Scholar
P. A. BautistaY. Yagi,
“Digital simulation of staining in histopathology multispectral images: enhancement and linear transformation of spectral transmittance,”
J. Biomed. Opt., 17
(5), 056013
(2012). http://dx.doi.org/10.1117/1.JBO.17.5.056013 JBOPFO 1083-3668 Google Scholar
BauschLomb, Diffraction Grating Handbook, Bausch & Lomb Analytical Systems Division, Rochester, New York
(1970). Google Scholar
M. Aikio,
“Hyperspectral prism-grating-prism imaging spectrograph,”
Technical Research Centre of Finland,
(2001). Google Scholar
B. KhoobehiJ. M. BeachH. Kawano,
“Hyperspectral imaging for measurement of oxygen saturation in the optic nerve head,”
Invest. Ophthalmol. Vis. Sci., 45
(5), 1464
–1472
(2004). http://dx.doi.org/10.1167/iovs.03-1069 IOVSDA 0146-0404 Google Scholar
T. VaaralaM. AikioH. Keraenen,
“An advanced prism-grating-prism imaging spectrograph in on-line industrial applications,”
Proc. SPIE, 3101 322
–330
(1997). http://dx.doi.org/10.1117/12.281293 Google Scholar
H. Akbariet al.,
“Hyperspectral imaging and diagnosis of intestinal ischemia,”
in 30th Annual Int. Conf. of the IEEE Engineering in Medicine and Biology Society,
1238
–1241
(2008). Google Scholar
H. Akbariet al.,
“Wavelet-based compression and segmentation of hyperspectral images in surgery,”
Medical Imaging and Augmented Reality, 142
–149 Springer Berlin Heidelberg(2008). Google Scholar
S. T. Monteiroet al.,
“Towards applying hyperspectral imagery as an intraoperative visual aid tool,”
in Proc. 4th Int. Conf. on Visualization, Imaging and Image Processing,
483
–488
(2004). Google Scholar
M. Ishiharaet al.,
“Modification of measurement methods for evaluation of tissue-engineered cartilage function and biochemical properties using nanosecond pulsed laser,”
Proc. SPIE, 6858 685805
(2008). http://dx.doi.org/10.1117/12.762481 PSISDG 0277-786X Google Scholar
H. Akbariet al.,
“Blood vessel detection and artery-vein differentiation using hyperspectral imaging,”
in Annual Int. Conf. of the IEEE Engineering in Medicine and Biology Society,
1461
–1464
(2009). Google Scholar
F. Blancoet al.,
“Hyperspectral imaging based method for fast characterization of kidney stone types,”
J. Biomed. Opt., 17
(7), 076027
(2012). http://dx.doi.org/10.1117/1.JBO.17.7.076027 JBOPFO 1083-3668 Google Scholar
D. Hatteryet al.,
“Hyperspectral imaging of Kaposi’s sarcoma for disease assessment and treatment monitoring,”
in Proc. 31st Applied Imagery Pattern Recognition Workshop,
124
–130
(2002). Google Scholar
A. J. Chaudhariet al.,
“Hyperspectral and multispectral bioluminescence optical tomography for small animal imaging,”
Phys. Med. Biol., 50
(23), 5421
–5441
(2005). http://dx.doi.org/10.1088/0031-9155/50/23/001 PHMBA7 0031-9155 Google Scholar
M. H. Chenet al.,
“Development of a thermal and hyperspectral imaging system for wound characterization and metabolic correlation,”
Johns Hopkins APL Technical Digest, 26
(1), 67
–74
(2005). JHADDQ 0270-5214 Google Scholar
R. JolivotP. VabresF. Marzani,
“Reconstruction of hyperspectral cutaneous data from an artificial neural network-based multispectral imaging system,”
Comput. Med. Imaging Graph., 35
(2), 85
–88
(2011). http://dx.doi.org/10.1016/j.compmedimag.2010.07.001 CMIGEY 0895-6111 Google Scholar
N. Gat,
“Imaging spectroscopy using tunable filters: a review,”
Proc. SPIE, 4056 50
–64
(2000). http://dx.doi.org/10.1117/12.381686 PSISDG 0277-786X Google Scholar
J. HartkeE. L. Dereniak,
“Snapshot dual-band visible hyperspectral imaging spectrometer,”
Opt. Eng., 46
(1), 013201
(2007). http://dx.doi.org/10.1117/1.2434348 OPEGAR 0091-3286 Google Scholar
A. Rogalski,
“Progress in focal plane array technologies,”
Prog. Quantum Electron., 36
(2–3), 342
–473
(2012). http://dx.doi.org/10.1016/j.pquantelec.2012.07.001 PQUEAH 0079-6727 Google Scholar
V.-D. Tuan,
“Basic instrumentation in photonics,”
Biomedical Photonics Handbook, 1
–30 CRC Press, Boca Raton, Florida
(2003). Google Scholar
K. J. Zuzaket al.,
“Visible and infrared hyperspectral visualization of normal and ischemic tissue,”
in [Engineering in Medicine and Biology, 1999. 21st Annual Conference and the 1999 Annual Fall Meeting of the Biomedical Engineering Society] BMES/EMBS Conference, 1999. Proceedings of the First Joint,
1118
(1999). Google Scholar
K. J. Zuzaket al.,
“Visible spectroscopic imaging studies of normal and ischemic dermal tissue,”
Proc. SPIE, 3918 17
–26
(2000). http://dx.doi.org/10.1117/12.384958 PSISDG 0277-786X Google Scholar
K. J. Zuzaket al.,
“Visible reflectance hyperspectral imaging: characterization of a noninvasive, in vivo system for determining tissue perfusion,”
Anal. Chem., 74
(9), 2021
–2028
(2002). http://dx.doi.org/10.1021/ac011275f ANCHAM 0003-2700 Google Scholar
S. G. Konget al.,
“Hyperspectral fluorescence image analysis for use in medical diagnostics,”
in Advanced Biomedical and Clinical Diagnostic Systems III,
21
–28
(2005). Google Scholar
T. Vo-DinhF. YanM. B. Wabuyele,
“Surface-enhanced Raman scattering for medical diagnostics and biological imaging,”
J. Raman Spectrosc., 36
(6–7), 640
–647
(2005). http://dx.doi.org/10.1002/(ISSN)1097-4555 JRSPAF 0377-0486 Google Scholar
C. Liet al.,
“A three-dimensional multispectral fluorescence optical tomography imaging system for small animals based on a conical mirror design,”
Opt. Express, 17
(9), 7571
(2009). http://dx.doi.org/10.1364/OE.17.007571 OPEXFF 1094-4087 Google Scholar
P. Constantinouet al.,
“A high-resolution MACROscope with differential phase contrast, transmitted light, confocal fluorescence, and hyperspectral capabilities for large-area tissue imaging,”
IEEE J. Sel. Topics Quantum Electron., 11
(4), 766
–777
(2005). http://dx.doi.org/10.1109/JSTQE.2005.857708 IJSQEN 1077-260X Google Scholar
J. KatrašnikF. PernušB. Likar,
“Illumination system characterization for hyperspectral imaging,”
Proc. SPIE, 7891 78910T
(2011). http://dx.doi.org/10.1117/12.873868 PSISDG 0277-786X Google Scholar
Y. Hiroharaet al.,
“Validity of retinal oxygen saturation analysis: hyperspectral imaging in visible wavelength with fundus camera and liquid crystal wavelength tunable filter,”
Opt. Rev., 14
(3), 151
–158
(2007). http://dx.doi.org/10.1007/BF02919416 1340-6000 Google Scholar
X. LiuD. A. RiceB. Khoobehi,
“Spectral reflectance of the ocular fundus as a diagnostic marker for cerebral malaria,”
Proc. SPIE, 8229 82290H
(2012). http://dx.doi.org/10.1117/12.905763 PSISDG 0277-786X Google Scholar
S. Beginet al.,
“Coherent anti-Stokes Raman scattering hyperspectral tissue imaging with a wavelength-swept system,”
Biomed. Opt. Express, 2
(5), 1296
–1306
(2011). http://dx.doi.org/10.1364/BOE.2.001296 BOEICL 2156-7085 Google Scholar
H. Tsuruiet al.,
“Hyperspectral imaging of pathology samples,”
Proc. SPIE, 3605 273
–281
(1999). http://dx.doi.org/10.1117/12.347573 PSISDG 0277-786X Google Scholar
K. Masoodet al.,
“Hyperspectral colon tissue classification using morphological analysis,”
in Int. Conf. on Emerging Technologies,
735
–741
(2006). Google Scholar
K. MasoodN. Rajpoot,
“Spatial analysis for colon biopsy classification from hyperspectral imagery,”
Ann. BMVA, 2008
(4), 1
–16
(2008). Google Scholar
L. L. RandebergE. L. P. LarsenL. O. Svaasand,
“Hyperspectral imaging of blood perfusion and chromophore distribution in skin,”
Proc. SPIE, 7161 71610C
(2009). http://dx.doi.org/10.1117/12.810027 PSISDG 0277-786X Google Scholar
G. M. Palmeret al.,
“Optical imaging of tumor hypoxia dynamics,”
J. Biomed. Opt., 15
(6), 066021
(2010). http://dx.doi.org/10.1117/1.3523363 JBOPFO 1083-3668 Google Scholar
J. Schweizeret al.,
“Hyperspectral imaging—a new modality for eye diagnostics,”
Biomed. Tech., 57
(Suppl 1), 293
–296
(2012). Google Scholar
U. Maederet al.,
“Evaluation and quantification of spectral information in tissue by confocal microscopy,”
J. Biomed. Opt., 17
(10), 106011
(2012). http://dx.doi.org/10.1117/1.JBO.17.10.106011 JBOPFO 1083-3668 Google Scholar
R. A. Schultzet al.,
“Hyperspectral imaging: a novel approach for microscopic analysis,”
Cytometry, 43
(4), 239
–247
(2001). http://dx.doi.org/10.1002/(ISSN)1097-0320 CYTODQ 0196-4763 Google Scholar
P. ConstantinouR. S. DacostaB. C. Wilson,
“Extending immunofluorescence detection limits in whole paraffin-embedded formalin fixed tissues using hyperspectral confocal fluorescence imaging,”
J. Microsc., 234
(2), 137
–146
(2009). http://dx.doi.org/10.1111/jmi.2009.234.issue-2 JMICAR 0022-2720 Google Scholar
D. Landgrebe,
“Hyperspectral image data analysis,”
IEEE Signal Process. Mag., 19
(1), 17
–28
(2002). http://dx.doi.org/10.1109/79.974718 ISPRE6 1053-5888 Google Scholar
Z. LiuH. J. WangQ. L. Li,
“Tongue tumor detection in medical hyperspectral images,”
Sensors, 12
(1), 162
–174
(2012). SNSRES 0746-9462 Google Scholar
M. G. Sowaet al.,
“Visible-near infrared multispectral imaging of the rat dorsal skin flap,”
J. Biomed. Opt., 4
(4), 474
–481
(1999). http://dx.doi.org/10.1117/1.429957 JBOPFO 1083-3668 Google Scholar
R. Gillieset al.,
“Systemic effects of shock and resuscitation monitored by visible hyperspectral imaging,”
Diabetes Technol. Ther., 5
(5), 847
–855
(2003). http://dx.doi.org/10.1089/152091503322527058 DTTHFH 1520-9156 Google Scholar
H. Langeet al.,
“Reflectance and fluorescence hyperspectral elastic image registration,”
Proc. SPIE, 5370 335
–345
(2004). http://dx.doi.org/10.1117/12.535720 PSISDG 0277-786X Google Scholar
A. Plazaet al.,
“Recent advances in techniques for hyperspectral image processing,”
Remote Sens. Environ., 113
(Suppl. 1), S110
–S122
(2009). http://dx.doi.org/10.1016/j.rse.2007.07.028 RSEEA7 0034-4257 Google Scholar
M. Fauvelet al.,
“Advances in spectral–spatial classification of hyperspectral images,”
Proc. IEEE, 101
(3), 652
–675
(2013). http://dx.doi.org/10.1109/JPROC.2012.2197589 IEEPAD 0018-9219 Google Scholar
C. RodarmelJ. Shan,
“Principal component analysis for hyperspectral image classification,”
Survey. Land Inform. Syst., 62
(2), 115
–122
(2002). SLISEZ 1052-2905 Google Scholar
K. J. Zuzaket al.,
“Intraoperative bile duct visualization using near-infrared hyperspectral video imaging,”
Am. J. Surg., 195
(4), 491
–497
(2008). http://dx.doi.org/10.1016/j.amjsurg.2007.05.044 AJOOA7 0096-6347 Google Scholar
A. O. H. Gerstneret al.,
“Hyperspectral imaging of mucosal surfaces in patients,”
J. Biophotonics, 5
(3), 255
–262
(2012). http://dx.doi.org/10.1002/jbio.201100081 JBOIBX 1864-063X Google Scholar
X. ZhangC. H. Chen,
“New independent component analysis method using higher order statistics with application to remote sensing images,”
Opt. Eng., 41
(7), 1717
–1728
(2002). http://dx.doi.org/10.1117/1.1482722 OPEGAR 0091-3286 Google Scholar
D. LuQ. Weng,
“A survey of image classification methods and techniques for improving classification performance,”
Int. J. Remote Sens., 28
(5), 823
–870
(2007). http://dx.doi.org/10.1080/01431160600746456 IJSEDK 0143-1161 Google Scholar
F. MelganiL. Bruzzone,
“Classification of hyperspectral remote sensing images with support vector machines,”
IEEE Trans. Geosci. Remote Sens., 42
(8), 1778
–1790
(2004). http://dx.doi.org/10.1109/TGRS.2004.831865 IGRSD2 0196-2892 Google Scholar
Z. Liuet al.,
“Automated tongue segmentation in hyperspectral images for medicine,”
Appl. Opt., 46
(34), 8328
–8334
(2007). http://dx.doi.org/10.1364/AO.46.008328 APOPAI 0003-6935 Google Scholar
Z. Liuet al.,
“Classification of hyperspectral medical tongue images for tongue diagnosis,”
Comput. Med. Imaging Graph., 31
(8), 672
–678
(2007). http://dx.doi.org/10.1016/j.compmedimag.2007.07.008 CMIGEY 0895-6111 Google Scholar
H. Akbariet al.,
“Detection of cancer metastasis using a novel macroscopic hyperspectral method,”
Proc. SPIE, 8317 831711
(2012). http://dx.doi.org/10.1117/12.912026 PSISDG 0277-786X Google Scholar
S. KongL.-J. Park,
“Hyperspectral image analysis for skin tumor detection,”
Augmented Vision Perception in Infrared, 155
–171 Springer, London
(2009). Google Scholar
K. MasoodN. Rajpoot,
“Texture based classification of hyperspectral colon biopsy samples using CLBP,”
in IEEE Int. Symp. on Biomedical Imaging: From Nano to Macro,
1011
–1014
(2009). Google Scholar
K. RajpootN. Rajpoot,
“SVM optimization for hyperspectral colon tissue cell classification,”
Lec. Notes Comput. Sci., 3217 829
–837
(2004). http://dx.doi.org/10.1007/b100270 LNCSD9 0302-9743 Google Scholar
M. Fauvelet al.,
“Spectral and spatial classification of hyperspectral data using SVMs and morphological profiles,”
IEEE Trans. Geosci. Remote Sens., 46
(11), 3804
–3814
(2008). http://dx.doi.org/10.1109/TGRS.2008.922034 IGRSD2 0196-2892 Google Scholar
G. Hughes,
“On the mean accuracy of statistical pattern recognizers,”
IEEE Trans. Inf. Theory, 14
(1), 55
–63
(1968). http://dx.doi.org/10.1109/TIT.1968.1054102 IETTAW 0018-9448 Google Scholar
C. CortesV. Vapnik,
“Support vector machine,”
Mach. Learn., 20
(3), 273
–297
(1995). MALEEZ 0885-6125 Google Scholar
C.-C. ChangC.-J. Lin,
“LIBSVM: a library for support vector machines,”
ACM Trans. Intell. Syst. Technol., 2
(3), 1
–27
(2011). http://dx.doi.org/10.1145/1961189 2157-6904 Google Scholar
N. KeshavaJ. F. Mustard,
“Spectral unmixing,”
IEEE Signal Process. Mag., 19
(1), 44
–57
(2002). http://dx.doi.org/10.1109/79.974727 ISPRE6 1053-5888 Google Scholar
L. C. Parraet al.,
“Unmixing hyperspectral data,”
942
–948 1999). Google Scholar
L. C. Cancio,
“Application of novel hyperspectral imaging technologies in combat casualty care,”
Proc. SPIE, 7596 759605
(2010). http://dx.doi.org/10.1117/12.846331 PSISDG 0277-786X Google Scholar
J. A. ChinE. C. WangM. R. Kibbe,
“Evaluation of hyperspectral technology for assessing the presence and severity of peripheral artery disease,”
J. Vasc. Surg., 54
(6), 1679
–1688
(2011). http://dx.doi.org/10.1016/j.jvs.2011.06.022 0741-5214 Google Scholar
A. O. N. Joseph,
“Hyperspectral optical imaging for detection, diagnosis and staging of cancer,”
University of Southern California,
(2012). Google Scholar
K. SokolovM. FollenR. Richards-Kortum,
“Optical spectroscopy for detection of neoplasia,”
Curr. Opin. Chem. Biol., 6
(5), 651
–658
(2002). http://dx.doi.org/10.1016/S1367-5931(02)00381-2 COCBF4 1367-5931 Google Scholar
I. Pavlovaet al.,
“Microanatomical and biochemical origins of normal and precancerous cervical autofluorescence using laser-scanning fluorescence confocal microscopy,”
Photochem. Photobiol., 77
(5), 550
–555
(2003). http://dx.doi.org/10.1562/0031-8655(2003)077<0550:MABOON>2.0.CO;2 PHCBAP 0031-8655 Google Scholar
L. Boucheronet al.,
“Utility of multispectral imaging for nuclear classification of routine clinical histopathology imagery,”
BMC Cell Biol., 8
(Suppl. 1), S8
(2007). http://dx.doi.org/10.1186/1471-2121-8-S1-S8 BCBMAY 1471-2121 Google Scholar
K. M. RajpootN. M. Rajpoot,
“Wavelet based segmentation of hyperspectral colon tissue imagery,”
in 7th Int. Multi Topic Conf. INMIC 2003,
38
–43
(2003). Google Scholar
K. RajpootN. Rajpoot,
“SVM optimization for hyperspectral colon tissue cell classification,”
Medical Image Computing and Computer-Assisted Intervention—MICCAI 2004, 829
–837 Springer Berlin Heidelberg(2004). Google Scholar
K. MasoodN. M. Rajpoot,
“Classification of colon biopsy samples by spatial analysis of a single spectral band from its hyperspectral cube,”
in Proceedings Medical Image Understanding and Analysis (MIUA),
42
–48
(2007). Google Scholar
K. Masood,
“Hyperspectral imaging with wavelet transform for classification of colon tissue biopsy samples,”
Proc. SPIE, 7073 707319
(2008). http://dx.doi.org/10.1117/12.797667 PSISDG 0277-786X Google Scholar
M. Hohmannet al.,
“Preliminary results for hyperspectral videoendoscopy diagnostics on the phantoms of normal and abnormal tissues: towards gastrointestinal diagnostics,”
Proc. SPIE, 8087 80872N
(2011). http://dx.doi.org/10.1117/12.889829 PSISDG 0277-786X Google Scholar
S. Kiyotokiet al.,
“New method for detection of gastric cancer by hyperspectral imaging: a pilot study,”
J. Biomed. Opt., 18
(2), 026010
(2013). http://dx.doi.org/10.1117/1.JBO.18.2.026010 JBOPFO 1083-3668 Google Scholar
C. Angelettiet al.,
“Detection of malignancy in cytology specimens using spectral–spatial analysis,”
Lab. Invest., 85
(12), 1555
–1564
(2005). LAINAW 0023-6837 Google Scholar
M. E. Martinet al.,
“Hyperspectral fluorescence imaging system for biomedical diagnostics,”
Proc. SPIE, 6080 60800Q
(2006). http://dx.doi.org/10.1117/12.664113 PSISDG 0277-786X Google Scholar
M. E. Martinet al.,
“Development of an advanced hyperspectral imaging (HSI) system with application for cancer detection,”
Ann. Biomed. Eng., 34
(6), 1061
–1068
(2006). http://dx.doi.org/10.1007/s10439-006-9121-9 ABMECF 0090-6964 Google Scholar
D. Roblyeret al.,
“In vivo fluorescence hyperspectral imaging of oral neoplasia,”
Proc. SPIE, 7169 71690J
(2009). http://dx.doi.org/10.1117/12.807226 PSISDG 0277-786X Google Scholar
D. Roblyeret al.,
“Objective detection and delineation of oral neoplasia using autofluorescence imaging,”
Cancer Prev. Res., 2
(5), 423
–431
(2009). http://dx.doi.org/10.1158/1940-6207.CAPR-08-0229 CPRACC 1940-6207 Google Scholar
J. W. Uhret al.,
“Molecular profiling of individual tumor cells by hyperspectral microscopic imaging,”
Transl. Res., 159
(5), 366
–375
(2012). http://dx.doi.org/10.1016/j.trsl.2011.08.003 TRRECL 1878-1810 Google Scholar
L. G. Koss,
“The Papanicolaou test for cervical cancer detection. a triumph and a tragedy,”
JAMA, 261
(5), 737
–743
(1989). http://dx.doi.org/10.1001/jama.1989.03420050087046 JAMAAP 0098-7484 Google Scholar
N. Ramanujam,
“Fluorescence spectroscopy of neoplastic and non-neoplastic tissues,”
Neoplasia, 2
(1–2), 89
–117
(2000). http://dx.doi.org/10.1038/sj.neo.7900077 1522-8002 Google Scholar
R. SiegelD. NaishadhamA. Jemal,
“Cancer statistics, 2012,”
CA Cancer J. Clin., 62
(1), 10
–29
(2012). http://dx.doi.org/10.3322/caac.20138 CAMCAM 0007-9235 Google Scholar
S. M. Ismailet al.,
“Observer variation in histopathological diagnosis and grading of cervical intraepithelial neoplasia,”
Br. Med. J., 298
(6675), 707
(1989). http://dx.doi.org/10.1136/bmj.298.6675.707 BMJOAE 0007-1447 Google Scholar
W. R. HiattM. R. Nehler,
“Peripheral arterial disease,”
561
–571 New York
(2007). Google Scholar
K. J. Zuzaket al.,
“Imaging hemoglobin oxygen saturation in sickle cell disease patients using noninvasive visible reflectance hyperspectral techniques: effects of nitric oxide,”
Am. J. Physiol. Heart Circ. Physiol., 285
(3), H1183
–H1189
(2003). 0363-6135 Google Scholar
R. NevilleS. Gupta,
“Establishment of normative perfusion values using hyperspectral tissue oxygenation mapping technology,”
Vasc. Dis. Manage., 6
(6), 156
–161
(2009). Google Scholar
C. WeberH. Noels,
“Atherosclerosis: current pathogenesis and therapeutic options,”
Nat. Med., 17
(11), 1410
–1422
(2011). http://dx.doi.org/10.1038/nm.2538 1078-8956 Google Scholar
C. Kittrellet al.,
“Diagnosis of fibrous arterial atherosclerosis using fluorescence,”
Appl. Opt., 24
(15), 2280
–2281
(1985). http://dx.doi.org/10.1364/AO.24.002280 APOPAI 0003-6935 Google Scholar
S. Andersson-Engelset al.,
“Malignant tumor and atherosclerotic plaque diagnosis using laser-induced fluorescence,”
IEEE J. Quantum Electron., 26
(12), 2207
–2217
(1990). http://dx.doi.org/10.1109/3.64357 IEJQA7 0018-9197 Google Scholar
G. O. Angheloiuet al.,
“Intrinsic fluorescence and diffuse reflectance spectroscopy identify superficial foam cells in coronary plaques prone to erosion,”
Arterioscler. Thromb. Vasc. Biol., 26
(7), 1594
–1600
(2006). http://dx.doi.org/10.1161/01.ATV.0000225699.36212.23 ATVBFA 1079-5642 Google Scholar
D. Cohenet al.,
“The use of spectral imaging for the diagnosis of retinal disease,”
in LEOS '99. IEEE Lasers and Electro-Optics Society 1999 12th Annual Meeting,
220
–221
(1999). Google Scholar
L. K. CheungA. Eaton,
“Age-related macular degeneration,”
Pharmacotherapy, 33
(8), 838
–855
(2013). http://dx.doi.org/10.1002/phar.2013.33.issue-8 PHPYDQ 0277-0008 Google Scholar
N. SinghD. G. ArmstrongB. A. Lipsky,
“Preventing foot ulcers in patients with diabetes,”
JAMA, 293
(2), 217
–228
(2005). http://dx.doi.org/10.1001/jama.293.2.217 JAMAAP 0098-7484 Google Scholar
L. Khaodhiaret al.,
“The use of medical hyperspectral technology to evaluate microcirculatory changes in diabetic foot ulcers and predict clinical outcomes,”
Diabetes Care, 30
(4), 903
–910
(2007). http://dx.doi.org/10.2337/dc06-2209 DICAD2 0149-5992 Google Scholar
D. YudovskyA. NouvongL. Pilon,
“Hyperspectral imaging in diabetic foot wound care,”
J. Diabetes Sci. Technol., 4
(5), 1099
–1113
(2010). Google Scholar
D. Yudovskyet al.,
“Monitoring temporal development and healing of diabetic foot ulceration using hyperspectral imaging,”
J. Biophotonics, 4
(7–8), 565
–576
(2011). http://dx.doi.org/10.1002/jbio.v4.7/8 JBOIBX 1864-063X Google Scholar
K. J. Zuzaket al.,
“Noninvasive determination of spatially resolved and time-resolved tissue perfusion in humans during nitric oxide inhibition and inhalation by use of a visible-reflectance hyperspectral imaging technique,”
Circulation, 104
(24), 2905
–2910
(2001). http://dx.doi.org/10.1161/hc4901.100525 CIRCAZ 0009-7322 Google Scholar
M. L. HuebschmanK. P. RosenblattH. R. Garner,
“Hyperspectral microscopy imaging to analyze pathology samples with multicolors reduces time and cost,”
Proc. SPIE, 7182 71821F
(2009). http://dx.doi.org/10.1117/12.809277 PSISDG 0277-786X Google Scholar
F. Vasefiet al.,
“Transillumination hyperspectral imaging for histopathological examination of excised tissue,”
J. Biomed. Opt., 16
(8), 086014
(2011). http://dx.doi.org/10.1117/1.3623410 JBOPFO 1083-3668 Google Scholar
B. KhoobehiA. KhoobehiP. Fournier,
“Snapshot hyperspectral imaging to measure oxygen saturation in the retina using fiber bundle and multi-slit spectrometer,”
Proc. SPIE, 8229 82291E
(2012). http://dx.doi.org/10.1117/12.910056 PSISDG 0277-786X Google Scholar
J. Freemanet al.,
“Multispectral and hyperspectral imaging: applications for medical and surgical diagnostics,”
in Proc. of the 19th Annual Int. Conf. of the IEEE Engineering in Medicine and Biology Society,
700
–701
(1997). Google Scholar
S. T. Monteiroet al.,
“Towards a surgical tool using hyperspectral imagery as visual aid,”
in Augmented environments for Medical Imaging including augmented reality in computer-aided surgery (AMI-ARCS’04),
97
–103
(2004). Google Scholar
K. J. Zuzaket al.,
“Active DLP hyperspectral illumination: a noninvasive, in vivo, system characterization visualizing tissue oxygenation at near video rates,”
Anal. Chem., 83
(19), 7424
–7430
(2011). http://dx.doi.org/10.1021/ac201467v ANCHAM 0003-2700 Google Scholar
E. Wehneret al.,
“NIR DLPà ® hyperspectral imaging system for medical applications,”
Proc. SPIE, 7932 793204
(2011). http://dx.doi.org/10.1117/12.875802 PSISDG 0277-786X Google Scholar
M. S. Holzeret al.,
“Assessment of renal oxygenation during partial nephrectomy using hyperspectral imaging,”
J. Urol., 186
(2), 400
–404
(2011). http://dx.doi.org/10.1016/j.juro.2011.03.162 JOURDD 0248-0018 Google Scholar
E. O. Olwenyet al.,
“Renal oxygenation during robotic-assisted laparoscopic partial nephrectomy: characterization using laparoscopic digital light processing hyperspectral imaging,”
J. Endourol., 27
(3), 265
–269
(2013). http://dx.doi.org/10.1089/end.2012.0207 0892-7790 Google Scholar
K. J. Zuzaket al.,
“DLP hyperspectral imaging for surgical and clinical utility,”
Proc. SPIE, 7210 721006
(2009). http://dx.doi.org/10.1117/12.810068 PSISDG 0277-786X Google Scholar
K. J. Zuzaket al.,
“The robustness of DLP hyperspectral imaging for clinical and surgical utility,”
Proc. SPIE, 7596 759604
(2010). http://dx.doi.org/10.1117/12.845564 PSISDG 0277-786X Google Scholar
B. Fisheret al.,
“Twenty-year follow-up of a randomized trial comparing total mastectomy, lumpectomy, and lumpectomy plus irradiation for the treatment of invasive breast cancer,”
N. Engl. J. Med., 347
(16), 1233
–1241
(2002). http://dx.doi.org/10.1056/NEJMoa022152 NEJMAG 0028-4793 Google Scholar
S. C. Campbellet al.,
“Guideline for management of the clinical T1 renal mass,”
J. Urol., 182
(4), 1271
(2009). http://dx.doi.org/10.1016/j.juro.2009.07.004 JOURDD 0248-0018 Google Scholar
B. A. Lavenet al.,
“A pilot study of ice-slurry application for inducing laparoscopic renal hypothermia,”
BJU Int., 99
(1), 166
–170
(2007). http://dx.doi.org/10.1111/bju.2007.99.issue-1 BJINFO 1464-410X Google Scholar
C. R. Tracyet al.,
“Characterization of renal ischemia using DLP hyperspectral imaging: a pilot study comparing artery-only occlusion versus artery and vein occlusion,”
J. Endourol., 24
(3), 321
–325
(2010). http://dx.doi.org/10.1089/end.2009.0184 0892-7790 Google Scholar
V.-D. Tuan,
“A hyperspectral imaging system for in vivo optical diagnostics,”
IEEE Eng. Med. Biol. Mag., 23
(5), 40
–49
(2004). http://dx.doi.org/10.1109/MEMB.2004.1360407 IEMBDE 0739-5175 Google Scholar
P. Zhihonget al.,
“Face recognition in hyperspectral images,”
IEEE Trans. Pattern Anal. Mach. Intell., 25
(12), 1552
–1560
(2003). http://dx.doi.org/10.1109/TPAMI.2003.1251148 ITPIDJ 0162-8828 Google Scholar
A. Kienleet al.,
“Spatially resolved absolute diffuse reflectance measurements for noninvasive determination of the optical scattering and absorption coefficients of biological tissue,”
Appl. Opt., 35
(13), 2304
–2314
(1996). http://dx.doi.org/10.1364/AO.35.002304 APOPAI 0003-6935 Google Scholar
I. Georgakoudiet al.,
“Fluorescence, reflectance, and light-scattering spectroscopy for evaluating dysplasia in patients with Barrett’s esophagus,”
Gastroenterology, 120
(7), 1620
–1629
(2001). http://dx.doi.org/10.1053/gast.2001.24842 GASTAB 0016-5085 Google Scholar
I. J. BigioJ. R. Mourant,
“Ultraviolet and visible spectroscopies for tissue diagnostics: fluorescence spectroscopy and elastic-scattering spectroscopy,”
Phys. Med. Biol., 42
(5), 803
(1997). http://dx.doi.org/10.1088/0031-9155/42/5/005 PHMBA7 0031-9155 Google Scholar
R. Doornboset al.,
“The determination of in vivo human tissue optical properties and absolute chromophore concentrations using spatially resolved steady-state diffuse reflectance spectroscopy,”
Phys. Med. Biol., 44
(4), 967
(1999). http://dx.doi.org/10.1088/0031-9155/44/4/012 PHMBA7 0031-9155 Google Scholar
M. G. Mülleret al.,
“Spectroscopic detection and evaluation of morphologic and biochemical changes in early human oral carcinoma,”
Cancer, 97
(7), 1681
–1692
(2003). http://dx.doi.org/10.1002/(ISSN)1097-0142 60IXAH 0008-543X Google Scholar
C.-C. Yuet al.,
“Quantitative spectroscopic imaging for non-invasive early cancer detection,”
Opt. Soc. Am., 16
(20), 16227
–16239
(2008). JOAOD6 1084-7529 Google Scholar
M. PattersonB. WilsonD. Wyman,
“The propagation of optical radiation in tissue. II: optical properties of tissues and resulting fluence distributions,”
Lasers Med. Sci., 6
(4), 379
–390
(1991). http://dx.doi.org/10.1007/BF02042460 LMSCEZ 1435-604X Google Scholar
A. KimB. Wilson,
“Measurement of ex vivo and in vivo tissue optical properties: methods and theories,”
Optical-Thermal Response of Laser-Irradiated Tissue, 267
–319 Springer, Netherlands
(2011). Google Scholar
A. L. Vahrmeijeret al.,
“Image-guided cancer surgery using near-infrared fluorescence,”
Nat. Rev. Clin. Oncol., 10
(9), 507
–518
(2013). http://dx.doi.org/10.1038/nrclinonc.2013.123 NRCOAA 1759-4774 Google Scholar
BiographyGuolan Lu is a PhD student in the Department of Biomedical Engineering at Emory University and Georgia Institute of Technology, Atlanta, Georgia. Baowei Fei is associate professor in the Department of Radiology and Imaging Sciences at Emory University and in the Department of Biomedical Engineering at Emory University and Georgia Institute of Technology. He received his MS and PhD degrees from Case Western Reserve University, Cleveland, Ohio. He is a Georgia Cancer Coalition Distinguished Scholar and Director of the Quantitative BioImaging Laboratory (www.feilab.org) at Emory University School of Medicine. |