|
|
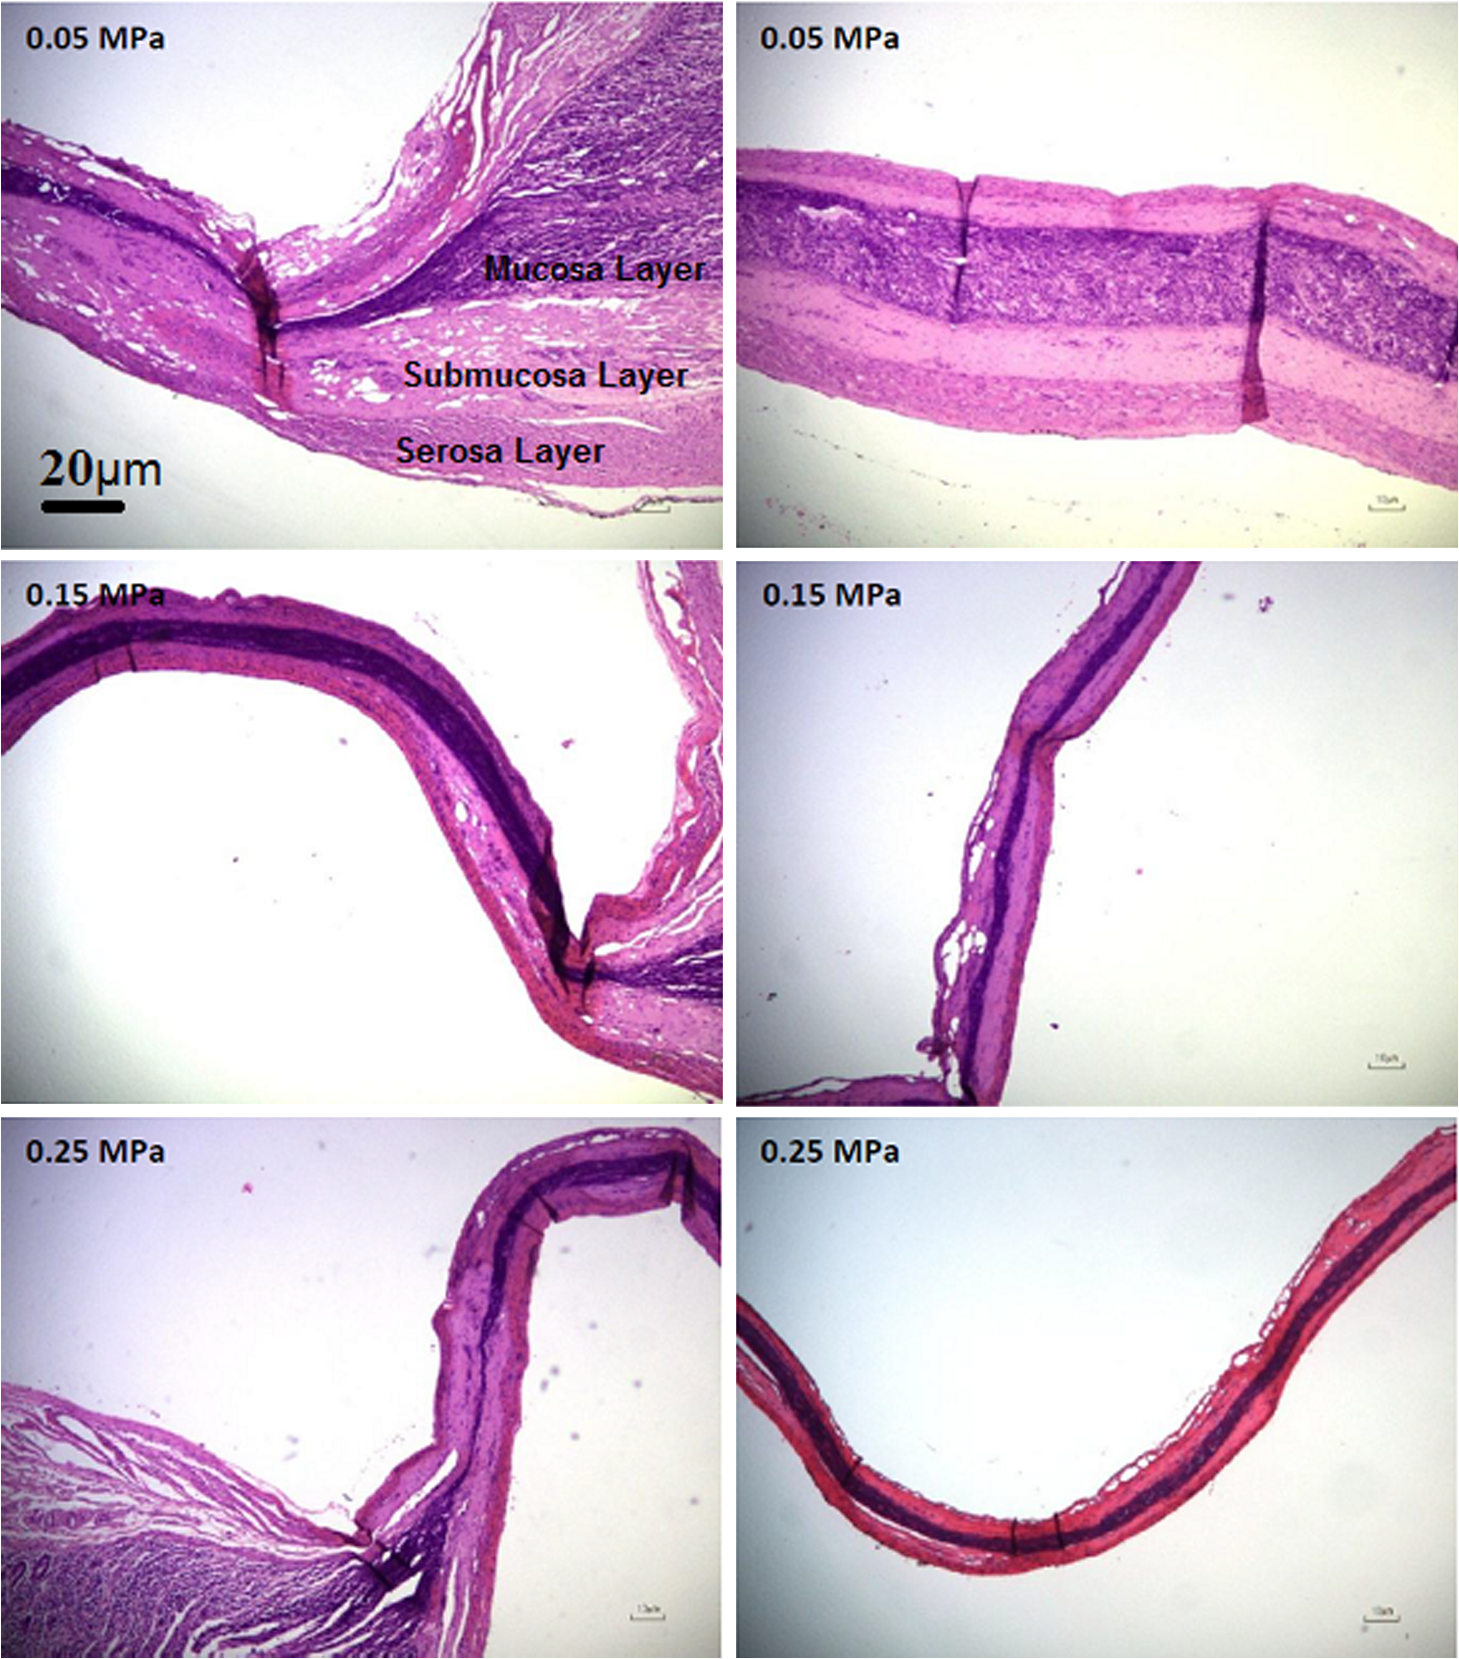
1.IntroductionThe use of heat for tissue sealing or approximation has attracted much attention in many modern surgical fields. For example, heat-induced vessel sealing by energy-based devices has been experimentally studied and clinically implemented for some time.1 Different energy sources have been used for tissue heating and fusion including ultrasound, radiofrequency (RF), and laser energy. Of these, ultrasonic dissectors (e.g., CUSA, Integra, New Jersey; Selector, Surgical Technical Group, Hampshire, GB; Autosonix Autosuture, Norwalk, Connecticut; Ultracision, Ethicon Endo-Surgery, Norderstedt, Germany) and an RF bipolar vessel sealer (e.g., LigaSure, Covidien, Boulder) are commercially available and clinically used as common practice in the operating theatre. As a result of the enormous success of energy-based devices in vessel sealing, a new research direction is currently being investigated to transfer such technologies to other tissue types (e.g., small bowel) during surgical procedures, such as bowel anastomosis, to replace traditional hand suturing or stapling.2,3 Bowel anastomosis is a routine procedure in modern surgery to restore bowel continuity after surgical resection due to intestinal malignancy, inflammation, or obstruction. There are approximately 2.5 million bowel anastomoses performed annually worldwide. The existing tissue anastomosis techniques of suturing and stapling may have limitations and problems such as bleeding and leakage from suturing sites. These complications may result in trauma, infection, and retained foreign materials, leading to a significant increase in morbidity, mortality, and additional cost in treatment. Energy-based anastomosis devices hold the promise of replacing hand suturing and stapling in surgery to become the next-generation anastomosis technology. Such a technology exploits the heat-induced anastomosis of native tissues. High-quality tissue sealing as a result of simultaneously applied heat and compressive pressure (CP) can be achieved without using any foreign materials and, thus, is expected to greatly reduce morbidity, mortality, and additional treatment cost. There are two main challenges that need to be addressed in this field. First, although the mechanism for heat-induced tissue fusion, particularly for blood vessel sealing, has been studied,1,4 such a process is not fully understood on a molecular level. Second, existing thermotherapy procedures mainly rely on predetermined dosimetry such as heating power or applied voltage. In bowel anastomosis, however, due to the complex and variable nature of bowel tissue, instead of predetermined dosimetry, a monitoring or feedback control strategy should be implemented in real time. Among others, parameters such as temperature, thermal spread, optical transmittance, or impedance have been suggested. It is not yet known how these parameters are able to provide insights into molecular structural changes. Laser-induced fluorescence (LIF) from endogenous fluorophores provides an attractive method for noninvasive tissues characterization.5 The variation in LIF properties is often due to changes in fluorophore concentration, fluorophore spatial distribution, metabolic state, biochemical/biophysical microenvironment, tissue architecture, and attenuation arising from chromophores and scatterers.6 The endogenous fluorophores in tissues consist of collagen cross-links (excitation: 360 nm; maximum emission: 450 nm),7–11 elastin (325 nm; 400 nm),5 NAD(P)H (351 nm; 460 nm),12 FAD (450 nm; 535 nm),12 bile (380 nm; 425 nm),13 and lipopigments (broad excitation and emission).5,14 The LIF spectrum mainly arises from the superposition of the fluorescence from all these fluorophores. While most of the LIF studies have focused on differentiating malignant and normal tissues in disease diagnosis,15 there are existing studies on the variation of tissue fluorescence due to temperature and other thermo-transformations. For instance, Lin et al.16 studied the use of fluorescence measurements to monitor thermal damage induced on canine liver samples, which were subjected to isothermal baths at different temperatures and for different incremental durations. Theodossiou et al.17 studied irreversible thermally induced changes in collagen through LIF. Lin et al.18 observed that LIF did not suffer a clear decrease in intensity even above denaturation temperature and hypothesized that cross-links were less susceptible to the heating process than hydrogen bonds in the triple helix, and furthermore, that fluorescence could still be detected when collagen fibrous structures were replaced by an amorphous arrangement (occurring at around 75°C). Intestinal tissues share many compositional similarities with other tissue types including the fluorophore content such as collagen and elastin. The gastrointestinal tract consists of four distinct layers (mucosa, submucosa, muscularis, and serosa) that possess different fluorescence characteristics due to the variations in fluorophore composition and arrangement.19–21 The submucosa is by far the most fluorescent layer for ultraviolet (UV) excitation due to its high collagen content, and this can be used as the basis of characterization of intestinal tissues subjected to heat using LIF. Particularly, we expect to see the fluorescence emission from collagen cross-links, which are an important indicator for fusion mechanical strength. Furthermore, fluorescence spectroscopy can be fast, noninvasive, and quantitative.12 The fact that only a few points need be probed and that certain discrete spectral features can be used to create a diagnostic indicator makes it a relatively cheap and accessible modality to implement and use.22 In this study, we performed heat-induced porcine small bowel fusion by using RF energy, and, for the first time to the best of our knowledge, we demonstrated the use of LIF to characterize fusion in vitro. Histopathology analysis was conducted to gain direct knowledge into the fused-tissue architectural changes. Fused-tissue mechanical strength was assessed by a burst pressure (BP) testing system. We measured the tissue fluorescence spectra with two excitation lasers at 375 and 405 nm and investigated the difference in the fluorescence spectra in relation to the quality of fusion. Using LIF to determine the fusion quality is also discussed. 2.Materials and Methods2.1.Animal Tissue PreparationFresh porcine small bowels were obtained from a local abattoir, cut into 20- to 30-cm long segments, moistened with physiological saline, and refrigerated at 4°C for up to 30 h (from the time of slaughter) until needed for fusion experiments. Prior to the fusion experiment, a segment of small bowel was selected and immediately dissected into 5-cm-long pieces for tissue-fusion experiment. Prepared 5 cm samples were kept hydrated in sealed plastic sample bags with saline and used within 30 min. 2.2.RF Tissue FusionThe RF tissue fusion setup is shown in Fig. 1. The RF generator is an energy research tool prototype (developed by Covidien, Boulder, Colorado) capable of delivering a programmable sinusoidal current from 0 to 7 A and a power from 0 to 350 W. An operating RF frequency of 472 kHz was chosen to avoid neuromuscular stimulation and electrocution. A bipolar anastomosis prototype was used as the tissue-sealing device in this experiment with jaws to clamp on the tissue sample, with RF energy supplied by the embedded electrodes in the jaws during the application of CP provided by an air compressor connected to the jaws. Prewritten RF energy control algorithms were loaded into the tissue fusion software written in LabVIEW [National Instruments (NI), Austin, Texas] in the PC to control the entire procedure. The algorithm was configured to control RF energy delivery to ensure a predetermined variation in tissue impedance profile,2,3 i.e., to first raise the tissue impedance rapidly to a starting threshold and then to maintain a slowly rising impedance until the impedance finally reaches the preset end impedance. Fig. 1(a) Radiofrequency (RF) tissue fusion setup and (b) a typical tissue temperature profile during fusion. 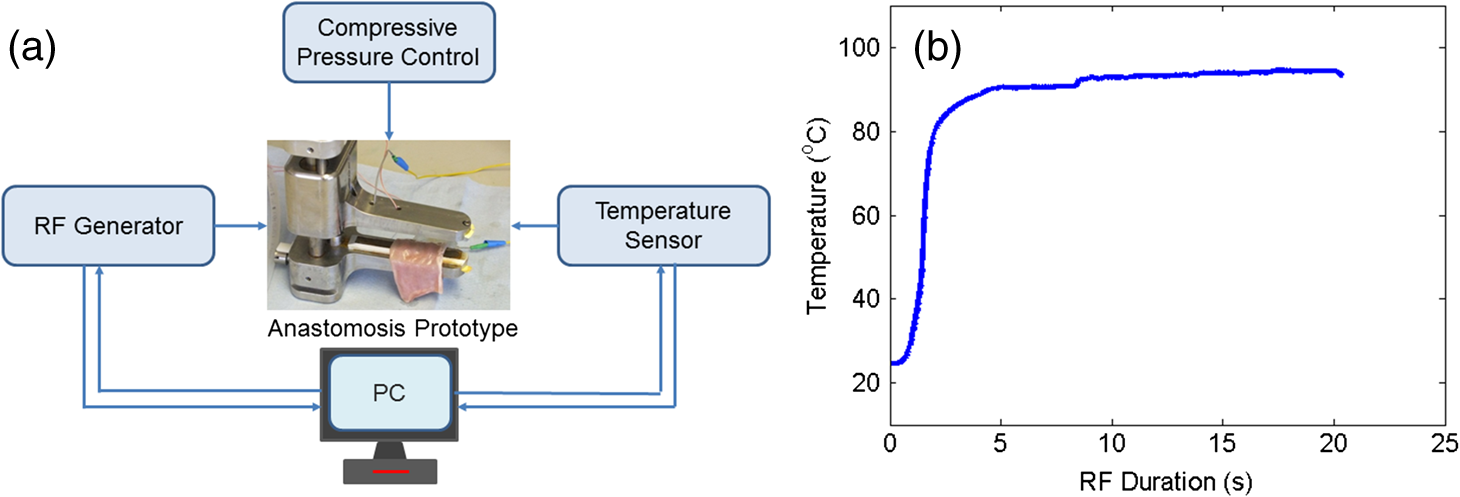 During RF fusion, a piece of porcine small bowel sample was clamped between the fusion device jaws. The RF generator supplied the RF energy and also continuously monitored both the voltage and the current delivered to the tissue. The varying tissue impedance was then obtained by using the real-time voltage and current readouts. The air compressor was capable of supplying a variable CP from 0 to 0.5 MPa via a pneumatic system integrated with the anastomosis prototype device. 2.3.Temperature MeasurementTissue temperature was measured using a fine-tip (0.005 in.) Teflon-insulated J-type thermocouple (5TC-TT-J-36-36, Omega Engineering, Bridgeport, New Jersey). The thermocouple was inserted through slits made on the sealing device jaws and glued in place at the top of the slit, so that its tip emerged 0.25 mm above the electrode surface. In this way, the thermocouple was in contact with the tissue surface without piercing it and was insulated from the electrodes. The communication between the thermocouple and the computer was achieved through an NI PXI-6289 DAQ board and an NI SCC-68 terminal block. The latter hosted four NI SCC-TC02 Thermocouple Signal Conditioning Modules. Each SCC-TC02 could drive one thermocouple and had individual signal conditioning modules with a 2-Hz low-pass filter, which filtered out the RF signal and eliminated the RF interference from the thermocouple readout. 2.4.Laser-Induced Tissue Fluorescence MeasurementThe LIF system is described briefly in this section. The UV-laser fluorescence system employed two excitation laser diodes emitting at 375 and 405 nm. The rationale for the excitation-wavelength selection is given as follows. In existing large bowel ex vivo studies,19,20,22 both 375- and 405-nm excitations were used. Furthermore, in one of the few small bowel studies,14 excitation wavelengths such as 760 and 820 nm were used for two-photon excitation. These correspond to 380- and 410-nm excitations in conventional fluorescence studies. In addition, as suggested by Zonios et al.,19 due to hemoglobin absorption, the collagen peak appears at 460 nm (red shift) instead for bowel tissues, and this collagen peak falls within our excitation and detection bands. A custom-made fiber-optic probe (Romack, Inc., Williamsburg, Virginia) formed a two-way laser delivery and fluorescence collection device, consisting of six hexagonally packed collection fibers surrounding an excitation fiber (Fig. 2). The diameter and numerical aperture of the fibers were 200 μm and 0.22, respectively, and the fiber material was chosen to have low autofluorescence and attenuation in the UV spectral region of interest. The probe distal tip was covered by a glass window, and the fibers and window were housed in a stainless steel tube with an external diameter of 2 mm. This could enable it to be inserted into small slits made on the sealing device jaws for future real-time analysis. The proximal end was divided into two arms: the first one contained the excitation fiber and was coupled to the laser optics using an SubMiniature version A (SMA) connector; the second arm included the six emission fibers arranged in a linear array inside another SMA connector. During LIF, the proximal end was made perpendicular to the sample plane in gentle contact with the sample without inducing any pressure. The laser outputs were collimated by 4.6-mm focal length lenses, and the beams were coupled into the excitation fiber using an 8-mm achromatic focusing lens. Two steering mirrors were used to optimize the alignment and to maximize the coupling efficiency. Two program-controlled beam shutters were placed in front of laser diodes to switch laser exposure on and off as well as to control the exposure durations. The output optical power at the distal end of the probe was 3.5 mW. The fluorescence emission from the six collection fibers was focused onto the 80-μm-wide input slit of an imaging spectrograph (Specim Ltd.) using an achromatic lens doublet (60 and 30 mm). A 430-nm long-pass filter was inserted between these two lenses to block the excitation laser reflections from the sample. The light dispersed by the prism-grating-prism element of the spectrograph was then acquired with a sensitive-cooled CCD camera (Retiga EXI, QImaging, Surrey, Canada, ). All optical components were assembled using a cage system and a breadboard so that the system was robust and portable. A LabVIEW program controlled the exposure time and beam shutters and enabled acquisition of fluorescent signals from the laser diode with an adjustable number of measurements. 2.5.BP MeasurementThe mechanical strength of the fused tissue was evaluated by a BP testing system custom built in the lab. This system consisted of a syringe pump, a pressure gauge, a sample injection needle, and a surgical clamp to close the small bowel tissue. The main arm of a Y-splitter tubing system was connected to a water-filled syringe controlled by the syringe pump. The other two split arms were connected to the pressure gauge and the sample injection needle, respectively. The surgical clamp sealed the other end of the piece of fused small bowel to make it a “tissue balloon.” The sample injection needle was used to pierce the small bowel tissue to allow water to be infused into the sealed bowel without damaging the seal. As the amount of water inside the tissue was increased at a rate of using the syringe pump, the pressure also increased until the fused tissue leaked or burst at the fusion line, and the highest value of water pressure recorded by the pressure gauge was the BP. 2.6.Histopathology AnalysisTo assess how the structural changes influence the tissue qualitatively, histological examination of RF-fused tissue was carried out. Samples of porcine small bowel were fused, and histological sections were taken before and after fusion. The samples were dissected and conserved in formaldehyde, stained with hematoxylin and eosin (H&E), sliced transversal to the seal, and were prepared on microscope slides. 3.Results3.1.Tissue Temperature Evolution during FusionThe tissue temperature variation was a result of the variation in RF energy supplied to the tissue as determined by the specific impedance-control algorithm used. The embedded thermocouple showed that the tissue temperature evolution during fusion had two stages [a typical tissue temperature profile during fusion is shown in Fig. 1(b)]: first the tissue temperature rose rapidly from the initial tissue temperature to a higher value usually within a few seconds and then the tissue temperature became relatively stable, where the tissue temperature variation was within the range of 60 to 90°C. Such temperatures ensure the necessary collagen denaturation1,4 and are believed to be essential for a strong fusion. Temperatures that are too low () may not cause denaturation of collagen, and temperatures that are too high should be avoided in practice because it may lead to permanent damage of the tissue or necrosis. 3.2.Tissue Fusion and BP TestsTissue samples from the same animal were used in the fusion experiment. Fusions were carried out by controlling the RF energy in order to achieve a predetermined tissue impedance variation with a rising slope of to an end impedance of 200 Ω. Fifteen samples were fused with five each being fused at the following CPs: 0.05, 0.15, and 0.25 MPa. After fluorescence spectroscopy, the fusion strength of these samples was tested using the BP measurement device, and the results appear in Fig. 3. The BP results obtained were in line with the previous RF fusion strength study reported elsewhere.23 Fusions made at higher CPs (0.15 and 0.25 MPa) had a higher mean BP of . Samples fused at 0.05 MPa of CP displayed an average BP of . The histopathology and fluorescence spectroscopy results from these samples are given in the following sections to understand the difference in the fusion strength. 3.3.HistologyAn additional six samples were selected from the same batch of tissues and fused (two for each CP: 0.05, 0.15, and 0.25 MPa). These samples were analyzed using fluorescence spectroscopy followed by histology. The fluorescence spectra for these samples are not shown here, because we note that they exhibit the same spectral characteristics and similar statistical and classification results as those presented in Fig. 5. The histology characteristics should remain the same for all these samples as they are from the same batch, as proven in another study.23 Histological images for fused samples are shown in Fig. 4. At 0.05 MPa, some degree of thermal damage, as well as tissue compression, can be seen. Residual muscle can still be identified, and clear demarcation among tissue layers can be observed. A higher CP at 0.15 MPa resulted in a much thinner and homogeneous fused region with the disappearance of structural features. Serosal and muscle layers were highly compressed, the submucosa and mucosa were merged into one homogeneous layer, and a higher thermal damage could be seen. Finally, the observable features of fusions at 0.25 MPa CP is similar to that of 0.15 MPa fusions, although some degree of cracking can also be seen, which might be due to the formation of steam vacuoles during RF fusion. Samples fused at 0.05 MPa of CP were clearly underfused. Samples fused at 0.15 and 0.25 MPa of CP displayed similar architecture and features, being closer to a well-fused state. These histology results are consistent and reproducible among samples fused with equal fusion parameters. 3.4.Fluorescence SpectroscopyIn total, 804 fluorescence spectrum acquisitions were made on the 15 fused tissue samples with half made at each excitation wavelength (375 and 405 nm). Of these, 240 were “control” acquisitions on unfused tissue, 192 were “poorly fused” acquisitions at 0.05 MPa CP, and 372 were “well-fused” acquisitions at 0.15 and 0.25 MPa CPs. Figure 5 shows the mean fluorescence spectra and associated standard deviation error bars. For each excitation wavelength, both normalized (a.u., arbitrary units) and non-normalized (counts) spectra are displayed in order to show changes incurred to both waveform and overall intensity of the spectra. Fig. 5Mean emission spectra (440 to 700 nm) with standard deviation for “well-fused” versus “poorly fused” versus “control” samples: (a) 375-nm excitation and normalized to unit area, (b) 375-nm excitation and non-normalized, (c) 405-nm excitation and normalized to unit area, and (d) 405-nm excitation and non-normalized. The integration time used for collecting these spectra is 6 s.  The 375-nm laser excited mean fluorescence spectra displayed a main emission peak close to 455 nm, a slight shoulder around 500 to 515 nm, a secondary peak around 590 nm, and a narrow peak at 680 nm. The 405-nm laser excitation spectra showed a main peak in the 470- to 500-nm region and a secondary peak around 590 nm. In the normalized spectra, the steepness of the 375-nm excitation spectra seemed to increase in the 460- to 550-nm region from the “control” to “poorly fused” and then to “well-fused” samples. In the control cases, a shoulder was visible around 500 to 510 nm, which became less apparent for the increased fusion cases. For the normalized 405-nm excitation spectra, a slight blue shifting seemed to occur around 475 nm, and this primary peak had greater intensity. In the non-normalized spectra, overall intensity appeared to increase with fusion for both 375- and 405-nm excited spectra in the 440- to 470-nm and 470- to 490-nm bands, respectively. Additionally, not only did the average intensity increase with improved fusion, but also there was a greater variability in the magnitude of this intensity among the acquired spectra. 3.5.Data AnalysisKruskal–Wallis nonparametric testing was applied to the fluorescence spectra, and based on the features of the mean fluorescence spectra, two spectral parameters were chosen: (1) the ratio of normalized fluorescence emission intensity at two distinct wavelengths: for 375-nm excitation and for 405-nm excitation; (2) the average intensity between 440 and 470 nm for 375-nm excitation and between 470 and 490 nm for 405-nm excitation, symbolized as and , respectively. Note that these two ratios were selected based on the direct observation of the prominent features in the mean fluorescence spectra in Fig. 5. Figure 6 shows the associated box plots for Kruskal–Wallis testing results. With the significant level , obtained -values shows that the means for these two parameters are significantly different among the different classes. Fig. 6Box plots for the Kruskal–Wallis test data: (a) for 375-nm excitation, (b) for 405-nm excitation, (c) for 375-nm excitation, and (d) for 405-nm excitation. values for (a–d) are , , , and , respectively.  Sparse multinomial logistic regression (SMLR) was applied to the spectral dataset with the purpose of resorting to the most relevant spectral features, enabling classification of data into three classes: control, poorly fused, and well fused. Four hundred two input samples were used, where each one consisted of a concatenation of the normalized 375- and 405-nm excited spectra of a given acquisition, associated to its appropriate quality of fusion label. The fluorescence emission values in the 435- and 650-nm range were used as features in the SMLR test. To assess SMLR classification, a -fold cross-validation strategy was adopted, where each subset contained the six nonindependent acquisitions made during each probing, yielding . The general accuracy in classifying the test data was 94.3%. For well-fused tissue (as defined by BP testing), it could be differentiated from poorly fused and control tissues via SMLR with 95.2% sensitivity, 95.4% specificity, 94.7% positive predictive value (PPV), and 95.8% negative predictive value (NPV). Poorly fused tissue could be distinguished from other tissue states with 89.5% sensitivity, 97.1% specificity, 90.5% PPV, and 96.7% NPV. Control tissue could be distinguished from any fused state with 100% sensitivity, 100% specificity, 100% PPV, and 100% NPV. 4.DiscussionThe histological results in Fig. 4 show that the higher CP during fusion led to significant changes to the tissue structures with a homogeneous amalgam formed along the fusion line and the boundary between the upper and lower mucosa layers completely removed. The BP tests also confirmed that fusions where an amalgam was formed are stronger. The formation of the amalgam can be understood as a result of the combination of CP and heating. When RF energy was applied to the tissue sample, the biological impedance of the tissue converted energy into heat, which led to an increase in the local tissue temperature. At temperatures higher than 60°C, collagen fibers start to be denatured,1,4 whereby the chains of collagen became untied and formed more cross-links among each other. The application of CP compressed the elastin, and as a result reduced the space between collagen fibers, which may have enabled and accelerated the formation of collagen cross-links. Therefore, we speculate that the amalgam along the fusion line consists of increased collagen cross-linking, which consequently leads to strong fusions. The laser-induced tissue fluorescence spectra were believed to contain the additional information on collagen cross-linking, which are unavailable with the existing tissue-fusion characterization modalities. There are a few studies on small bowel autofluorescence in the literature. From the bowel spectroscopic measurements reported in this article, spectral results seem to be consistent with existing large bowel ex vivo studies at both 375 nm19,20 and 405 nm.20,22 The main fluorescence peak we observed could be the combinations of fluorescence from collagen type I, NADH, FAD. Additionally, there could be contributions from bile and cholesterol too. Specifically, the 375-nm excited shoulder in the 500-nm region can be attributed to FAD, and the 590-nm secondary peak might be related to lipopigments14,24 or to increased hemoglobin absorption in the 540- to 580-nm region.25 The variable appearance of a peak at 680 nm for some of the acquisitions is thought to be correlated to the fluid bowel contents still existent in the luminal area of some samples. Bowel contents are rich in lipids, lipopigments (e.g., lipofuscin), and bile acids,26 all of which emit fluorescence above 600 nm for our excitation wavelengths.13,14 This would also explain why the 680-nm peak appears more often for control (Fig. 5), since in fused samples the fluid contents would have been expelled sideways. In the previous studies coupling thermo-transformations to tissue fluorescence, Tang et al.27 and Buttemere et al.25 noticed decrease in intensity, whereas our results show increases in intensity in the 440- to 500-nm range. This contradiction is understandable because the previous works studied the sole effect of laser damage on the tissue, or tissue necrosis, which is different from the process in RF fusion that aims to seal the tissue instead of causing damage. Changes in NADH and FAD fluorescence probably arise due to the fact that thermal damage leads to the destruction of cellular organelles, namely mitochondria, which might in turn alter NADH and FAD metabolic states or even destroy the molecules as a whole.25 Increase in fluorescence emission intensity, especially in the 440- to 500-nm range, may arise from both collagen cross-linking and tissue architectural changes. On one hand, the heat produced by RF energy on tissue leads to the breaking of existing collagen bonds, and then new collagen cross-links form as a result of applied RF energy and compression. On the other hand, the significant increases in fluorescence intensity are considered to be related to the general tissue architectural changes due to the joint action of RF energy and pressure. First, as seen in the H&E sections and from the previous experiments, the thickness of the well-fused bowel ranges from 25 to 50 μm, as opposed to native bowel that might have a two-walled thickness on the order of millimeters.28 Since the laser-light penetration depth is only a few hundred micrometers,14,19 for fused samples, excitation and fluorescence collection are possible throughout the entire sample depth. Second, the fact that bowel layers are compressed means that there is a higher concentration of fluorophores per unit volume in fused samples compared with normal tissues. A third factor is the compaction, which means that the probe is in closer contact with the most fluorescent layer, the submucosa. 5.ConclusionsWe have proposed and demonstrated for the first time the use of LIF to characterize fused tissues in heat-induced tissue fusion. The fluorescence results were correlated to both BP and histological results to provide further insights into the mechanism for heat-induced tissue fusion. The fluorescence spectra and statistical analysis clearly show that different tissue fusion classes have distinct fluorescence spectral features. This paves the way for using LIF as an advanced feedback control method to understand as well as to control the fusion. The existing parameters in tissue-fusion feedback control are mainly tissue temperature and impedance. Unfortunately, these two parameters do not provide the most reliable indication of the quality of the tissue seal. By using fluorescence as an additional parameter, the formation of the collagen cross-link-based amalgam can be directly monitored, which further reveals the fusion strength. In addition to parameters studied previously such as temperature, thermal damage spread, impedance, ultrasonography, or optical transmission, fluorescence spectroscopy potentially offers an attractive solution in monitoring and optimizing RF tissue fusion. AcknowledgmentsThis report is independent research funded by the Department of Health under the Health Technology Devices program (HTD240). The views expressed in this publication are those of the authors and not necessarily those of the NHS or the Department of Health. LS, SA, and GBH receive funding from the UK Department of Health and Covidien™ under the Health Technology Devices program (HTD240). ReferencesB. SigelM. R. Dunn,
“Mechanism of blood vessel closure by high frequency electrocoagulation,”
Surg. Gynecol. Obstet., 121
(4), 823
–831
(1965). SGOBA9 0039-6087 Google Scholar
T. Floumeet al.,
“Real-time optical monitoring of radio-frequency tissue fusion by continuous wave transmission spectroscopy,”
J. Biomed. Opt., 13
(6), 064006
(2008). http://dx.doi.org/10.1117/1.3006062 JBOPFO 1083-3668 Google Scholar
T. Floumeet al.,
“Optical, thermal, and electrical monitoring of radio-frequency tissue modification,”
J. Biomed. Opt., 15
(1), 018003
(2010). http://dx.doi.org/10.1117/1.3323089 JBOPFO 1083-3668 Google Scholar
D. Foschiet al.,
“The mechanisms of blood vessel closure in humans by the application of ultrasonic energy,”
Surg. Endosc., 16
(5), 814
–819
(2002). http://dx.doi.org/10.1007/s00464-001-9074-x SUREEX 1432-2218 Google Scholar
R. Richards-KortumE. Sevick-Muraca,
“Quantitative optical spectroscopy for tissue diagnosis,”
Annu. Rev. Phys. Chem., 47 555
–606
(1996). http://dx.doi.org/10.1146/annurev.physchem.47.1.555 ARPLAP 0066-426X Google Scholar
G. A. WagnieresW. M. StarB. C. Wilson,
“In vivo fluorescence spectroscopy and imaging for oncological applications,”
Photochem. Photobiol., 68
(5), 603
–632
(1998). PHCBAP 0031-8655 Google Scholar
R. A. Banket al.,
“Sensitive fluorimetric quantitation of pyridinium and pentosidine crosslinks in biological samples in a single high-performance liquid chromatographic run,”
J. Chromatogr. B, 703
(1–2), 37
–44
(1997). http://dx.doi.org/10.1016/S0378-4347(97)00391-5 JCBBEP 0378-4347 Google Scholar
M. Saitoet al.,
“Single-column high-performance liquid chromatographic fluorescence detection of immature, mature, and senescent cross-links of collagen,”
Anal. Biochem., 253
(1), 26
–32
(1997). http://dx.doi.org/10.1006/abio.1997.2350 ANBCA2 0003-2697 Google Scholar
D. R. EyreM. A. PazP. M. Gallop,
“Cross-linking in collagen and elastin,”
Annu. Rev. Biochem., 53 717
–748
(1984). http://dx.doi.org/10.1146/annurev.bi.53.070184.003441 ARBOAW 0066-4154 Google Scholar
N. D. Kirkpatricket al.,
“In vitro model for endogenous optical signatures of collagen,”
J. Biomed. Opt., 11
(5), 054021
(2006). http://dx.doi.org/10.1117/1.2360516 JBOPFO 1083-3668 Google Scholar
K. Sokolovet al.,
“Realistic three-dimensional epithelial tissue phantoms for biomedical optics,”
J. Biomed. Opt., 7
(1), 148
–156
(2002). http://dx.doi.org/10.1117/1.1427052 JBOPFO 1083-3668 Google Scholar
N. Ramanujam,
“Fluorescence spectroscopy in vivo,”
Encyclopedia of Analytical Chemistry, 20
–56 John Wiley & Sons, Chichester
(2000). Google Scholar
R. S. DaCostaH. AnderssonB. C. Wilson,
“Molecular fluorescence excitation-emission matrices relevant to tissue spectroscopy,”
Photochem. Photobiol., 78
(4), 384
–392
(2003). http://dx.doi.org/10.1562/0031-8655(2003)078<0384:MFEMRT>2.0.CO;2 PHCBAP 0031-8655 Google Scholar
R. Orzekowsky-Schroederet al.,
“In vivo spectral imaging of different cell types in the small intestine by two-photon excited autofluorescence,”
J. Biomed. Opt., 16
(11), 116025
(2011). http://dx.doi.org/10.1117/1.3655587 JBOPFO 1083-3668 Google Scholar
V. R. Sauvageet al.,
“Multi-excitation fluorescence spectroscopy for analysis of non-alcoholic fatty liver disease,”
Lasers Surg. Med., 43
(5), 392
–400
(2011). http://dx.doi.org/10.1002/lsm.v43.5 LSMEDI 0196-8092 Google Scholar
W. C. LinC. ButtemereA. Mahadevan-Jansen,
“Effect of thermal damage on the in vitro optical and fluorescence characteristics of liver tissue’s,”
IEEE J. Sel. Top. Quant. Electron., 9
(2), 162
–170
(2003). http://dx.doi.org/10.1109/JSTQE.2003.811288 IJSQEN 1077-260X Google Scholar
T. Theodossiouet al.,
“Thermally induced irreversible conformational changes in collagen probed by optical second harmonic generation and laser-induced fluorescence,”
Lasers Med. Sci., 17
(1), 34
–41
(2002). http://dx.doi.org/10.1007/s10103-002-8264-7 LMSCEZ 1435-604X Google Scholar
M. G. Linet al.,
“Evaluation of dermal thermal damage by multiphoton autofluorescence and second-harmonic-generation microscopy,”
J. Biomed. Opt., 11
(6), 064006
(2006). http://dx.doi.org/10.1117/1.2405347 JBOPFO 1083-3668 Google Scholar
G. I. Zonioset al.,
“Morphological model of human colon tissue fluorescence,”
IEEE Trans. Biomed. Eng., 43
(2), 113
–122
(1996). http://dx.doi.org/10.1109/10.481980 IEBEAX 0018-9294 Google Scholar
G. Bottiroliet al.,
“Natural fluorescence of normal and neoplastic human colon—a comprehensive ex-vivo study,”
Lasers Surg. Med., 16
(1), 48
–60
(1995). http://dx.doi.org/10.1002/(ISSN)1096-9101 LSMEDI 0196-8092 Google Scholar
Z. W. Huanget al.,
“Laser-induced autofluorescence microscopy of normal and tumor human colonic tissue,”
Int. J. Oncol., 24
(1), 59
–63
(2004). IJONES 1019-6439 Google Scholar
C. Ekeret al.,
“Clinical spectral characterisation of colonic mucosal lesions using autofluorescence and delta aminolevulinic acid sensitisation,”
Gut, 44
(4), 511
–518
(1999). http://dx.doi.org/10.1136/gut.44.4.511 GUTTAK 0017-5749 Google Scholar
S. Aryaet al.,
“Radiofrequency-induced small bowel thermofusion: an ex vivo study of intestinal seal adequacy using mechanical and imaging modalities,”
Surg. Endosc., 27 3485
–3496
(2013). http://dx.doi.org/10.1007/s00464-013-2935-2 SUREEX 1432-2218 Google Scholar
F. C. DeloriC. K. Dorey,
“In vivo technique for autofluorescent lipopigments,”
Methods Mol. Biol., 108 229
–243 1998). Google Scholar
C. R. Buttemereet al.,
“In vivo assessment of thermal damage in the liver using optical spectroscopy,”
J. Biomed. Opt., 9
(5), 1018
–1027
(2004). http://dx.doi.org/10.1117/1.1779627 JBOPFO 1083-3668 Google Scholar
R. A. BowenL. AustgenM. Rouge,
“Pathophysiology of the Digestive System,”
(2006) https://doi.org/http://www.vivo.colostate.edu/hbooks/pathphys/digestion/smallgut/absorb_lipids.html May ). 2006). Google Scholar
J. Tanget al.,
“Fluorescence spectroscopic imaging to detect changes in collagen and elastin following laser tissue welding,”
J. Clin. Laser Med. Surg., 18
(1), 3
–8
(2000). Google Scholar
T. L. Zillinget al.,
“Sutureless small bowel anastomoses: experimental study in pigs,”
Eur. J. Surg., 165
(1), 61
–68
(1999). http://dx.doi.org/10.1080/(ISSN)1741-9271 EUJSEH 1102-4151 Google Scholar
BiographyLei Su is a lecturer in electrical engineering & electronics at the University of Liverpool. He received both his bachelor’s (1999) and master’s (2002) degrees in electrical engineering from Xi’an Jiaotong University, and his PhD (2006) in fiber optics from Nanyang Technological University. He undertook his postdoctoral training on optical sensors and spectroscopy at the Cambridge University (2006 to 2011) and Imperial College London (2011 to 2012). His current research is concerned with optical sensing, spectroscopy, and microscopy systems. Martina B. Fonseca received her BSc degree in engineering science from Instituto Superior Tecnico (IST), University of Lisbon, Portugal, in 2011, and her MSc degree in biomedical engineering from Imperial College, UK, in 2012. She is currently pursuing her postgraduate education at IST, researching in the field of biological image processing of fluorescence microscopy data. Shobhit Arya received his medical degree at Imperial College London, in 2007. After graduation, he completed his basic surgical training in the Oxford and East of England regions. He is currently reading for a PhD in surgical sciences at St. Mary’s Hospital, Imperial College London, investigating the effects of bipolar radiofrequency tissue fusion as applied to bowel anastomosis. Hiromi Kudo studied protein engineering and biochemistry in the Department of Biotechnology, University of Tokyo, and received an MSc degree. She continued her career as a research assistant at Taisho Phermaceutical Co., Ltd (Saitama, Japan) and Research Institute of Molecular Pathology (Vienna, Austria). Since 2008, she has been working as a senior research technician in the Prof. Goldin group at Imperial College London, St Mary’s Hospital. Robert Goldin is a histopathologist specialising in gastrointestinal and liver pathology and is actively involved in both clinical work and research in all these areas. George B. Hanna is a consultant general and a minimal access surgeon at St. Mary’s Hospital, London, with a specialist interest in diseases of upper gastrointestinal tract. In addition to his clinical responsibilities, he is the head of the Division of Surgery at Imperial College London. His research interests focus on the development of new energy-based surgical devices, ergonomics during minimally invasive surgery, innovative design for patient safety, and early diagnosis and prediction of chemotherapy response in esophago-gastric cancer. Daniel S. Elson is a reader in Surgical Imaging in the Hamlyn Centre for Robotic Surgery, Institute of Global Health Innovation and Department of Surgery and Cancer at Imperial College London, St. Mary’s Hospital. His research interests are based around the development and application of photonics technology to medical imaging including multispectral endoscopy, ultrasound-mediated optical tomography, endoscopic-structured lighting, light sources in endoscopy, and polarized endoscopic imaging. |