|
|
1.IntroductionNear-infrared spectroscopy (NIRS) is a tool to evaluate tissue oxygenation noninvasively. As reported previously,1–3 there are several instruments commercially available which use different techniques to measure tissue oxygenation, e.g., in the brain. The NIRS quantifies the interaction of near-infrared photons with biological tissue, which can be described by two different properties: the absorption and reduced scattering coefficient ( and ).4,5 Deoxygenated hemoglobin (HHb) and oxygenated hemoglobin () are the most relevant chromophores absorbing light of the near-infrared spectrum and their concentrations can be calculated using the modified law of Lambert and Beer if the optical path length and geometrical factors are known.6 Unfortunately, standard NIRS devices currently are unable to measure path length, which is a function of the degree of scattering and absorption.3,5 Hence, standard NIRS devices can only be used to assess changes in the concentrations rather than absolute concentrations of HHb and . In contrast, frequency-domain NIRS (FD-NIRS) allows determining path length by measuring the phase shift of intensity modulated light after penetration of the tissues and hence enables one to measure the absorption coefficient () and the reduced scattering coefficient () based on the assumptions of homogeneity and semi-infinity.4,5 Consequently, the FD-NIRS enables quantitative measurements of absolute concentrations of HHb, , total hemoglobin () and tissue oxygen saturation (). If the medium under investigation is not homogenous, then these absolute values may not be correct. For example, when measuring the neonatal head, the tissue is not homogenous, but has a layered structure of skin, bone, cerebrospinal fluid (CSF), and brain. This issue has been addressed in several studies using simulation, phantoms, and in vivo experiments. In simulations, it was shown for the neonatal head that a single light bundle is affected to between 8% and 23% by superficial tissue.7 This result depends strongly on the assumptions made concerning the geometry of the neonatal head, such as the source-detector distances8 and the shape and thickness of these layers.7 An additional difficulty is that data on the thickness of the skull, skin, and CSF are not available for preterm infants. For the term neonates, we only found data on skin thickness.9 For future simulations, it would be important to create reliable data on the thickness of these superficial tissues. In phantom studies, it was shown that by measuring at several different source detector distances (multidistance geometry), the effect of superficial tissue can be excluded mathematically.10 In vivo, studies in adult subjects indicated that values can be influenced by superficial tissues.11,12 Again, no such studies are available in neonates yet, but according to the simulations, we expect that the influence of superficial tissue on the value is much smaller in neonates or preterm infants compared to adults. We aimed to measure the skin, bone, and CSF layer thickness in preterm infants and term neonates. The second aim was to investigate whether tissue thickness has an impact on absorption-() or reduced scattering coefficient () measured by multidistance FD-NIRS, to assess whether it should be taken into account whenever path length cannot be measured. 2.Subjects and MethodsThe study was approved by the institutional ethics committee and written informed parental consent was obtained. 2.1.PatientsTerm infants (11) and preterm infants (37) were studied at the neonatal intensive and high dependency care units of University Children’s Hospital Tuebingen. Patient characteristics are shown in Table 1. Only infants who were hemodynamically stable, i.e., those with normal blood pressure and normal peripheral perfusion without circulatory support were included. Those with chromosomal or syndrome abnormalities were excluded. Table 1Demographic characteristics of infants studied.
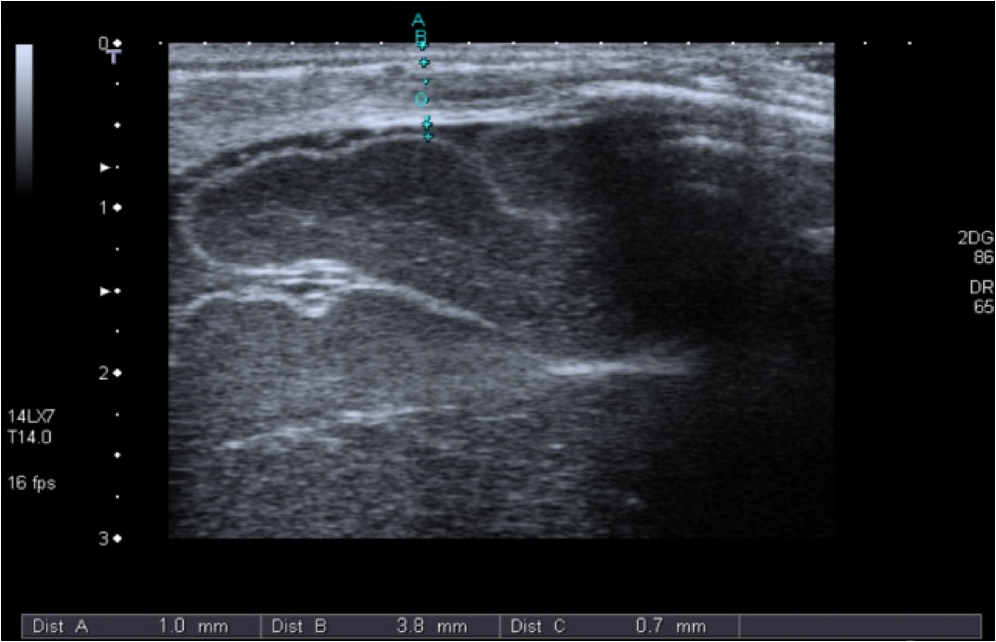
2.2.NIRS MeasurementsAll measurements were performed while the infants slept in a supine position with their heads slightly elevated and turned to the side by . The probe was positioned at the right temporo-parietal-region accurately in the middle between the tragus and the sagittal suture to avoid the sagittal sinus and the Sylvian fissure. For each measurement, three separate recordings, each lasting at least 2 min, were performed with a sampling rate of 1 Hz. The optode was applied to the infant’s skull with gentle pressure from the hand of the examiner. The optode was removed and repositioned for each recording. 2.2.1.NIRS deviceIn this study, we used the ISS OxiplexTS (ISS Inc., Champaign, Illinois), an FD-NIRS. Each channel is equipped with eight infrared light sources at two different wavelengths (four emitting at 692 nm and four at 834 nm) each with four emitter–detector distances of 1.5, 2, 2.5, and 3 cm, resulting in penetration of biological tissues to 2 to 3 cm in depth (according to the manufacturer). To enable assessment of the path length by the phase-shift, the light intensity is modulated at a frequency of 110 MHz. 2.2.2.Calculation of absorption coefficients () and reduced scattering coefficient ()Light intensity and phase shift were recorded for each emitter–optode distance using the proprietary software package OxiTS, and and calculated based on the slope of the respective regression lines at each wavelength using the diffusion equation for homogeneous, semi-infinite media as previously described.4 2.3.Cranial UltrasoundThe thickness of the skin, bone, and CSF layers was determined using cranial ultrasound (Aplio, Toshiba Medical Systems, Japan) applying a 7- to 14-MHz longitudinal transducer to exactly the same position of the head as the NIRS probe. The “most representative” thickness was determined for each tissue layer by best clinical estimate Fig. 4. 3.Data AnalysesFirst, the median and for every 2 min NIRS recording was determined. Thereafter, the median of the medians of all three 2 min recordings was calculated for each measurement. Furthermore, for arterial oxygen saturation the minimum value of all minimum measurements in each patient and the maximum of the corresponding maximums are reported. To describe the intra-subject (i.e., spatial or probe-placement dependent) variability of and of the three separate NIRS recordings in comparison to the inter-subject variability, the coefficients of variation (in %) for and at both wave lengths were calculated as the ratio of the standard deviation divided by the arithmetic mean (1) of the three separate NIRS recordings within each subject, and (2) of the individual median values of all 48 subjects introduced into the correlation analyses. To describe their variability, layer thicknesses were determined 8 mm to the right and 8 mm to the left of the “most representative” measurement, and the coefficient of variation was calculated for all three measurements in an individual patient. Because of limited quality of the ultrasound slides at larger distances to either side of the “most representative” measurement (due to the application of a linear ultrasound probe to the curved skull), it was not possible to systematically assess the variability of layer thicknesses over the maximum emitter–optode distance (30 mm) applied herein. Coefficients and were plotted against layer thicknesses for each wave length. Linear regressions and the nonparametric Spearman rank regression coefficients were calculated to describe correlations of skin, bone, and CSF layer thicknesses with and . values, indicating the probability for refusing the null hypothesis (that the Spearman rank correlation coefficients, , is not different from 0) by mistake, of were considered to indicate “significant” correlations. SPSS 15 (for Windows, Chicago IL, USA) was used for data analysis. 4.ResultsThe measured thicknesses of skin, bone, and CSF are shown in Table 2, and absorption coefficients and reduced scattering coefficients at the two wave lengths are depicted in Table 3 along with intra- and inter-individual coefficients of variation. In Figs. 1(a)–1(h) and 2(a)–2(h), absorption coefficients and reduced scattering coefficients are plotted against thickness of skin, bone, CSF and combined thickness of all layers, respectively. Table 4 summarizes the Spearman coefficients of correlation. Table 2Skin, bone, and cerebrospinal fluid (CSF) thickness.
Note: Q1=lower quartile; Q3=upper quartile; CV=intra-subject coefficients of variation of three measurements of each layer thickness (a “most representative” measurement by clinical judgment, and two further measurements, each 8-mm right and left of the “most representative” one) determined in 41 (of 48) subjects and presented in (%) and as median and range. Table 3Coefficients of absorption (μa) and reduced coefficients of scattering (μs′) at 692 and 834 nm.
Fig. 1Dot plots of absorption coefficients at 692 nm (a to d) and 834 nm (e to h) versus skin-, bone-, CSF-, and combined layer thickness. Color symbols show patients according to postmenstrual age at time of measurement: to 35 weeks; to 37 weeks; to 41 weeks.  Fig. 2Dot plots of reduced scattering coefficients at 692 nm (a to d) and 834 nm (e to h) versus skin-, bone-, CSF-, and combined layer thickness. Color symbols show patients according to postmenstrual age at time of measurement: to 35 weeks; to 37 weeks; to 41 weeks.  Table 4Correlation between coefficients of absorption (μa) as well as reduced coefficients of scattering (μs′) and thickness of skin, bone, and CSF, and combined thickness of all three layers.
There was no obvious relation between the thickness of these layers and or at either wavelength in this patient population. We performed similar analyses for the subgroups of term infants, preterm infants measured during their first 2 days of life, and older preterm infants—but again no consistent pattern of correlation was detected (data not shown). Thickness of skin, bone, CSF and combined thickness of all three layers is plotted against postmenstrual age at the time of measurement in Figs. 3(a)–3(d). Furthermore, total hemoglobin content and regional cerebral oxygen saturation in the study population are plotted against postmenstrual age in Figs. 3(e) and 3(f). Fig. 3Thickness of skin (a), bone (b), CSF (c), and combined layer thickness (d) for postmenstrual age at time of measurement are depicted. Total hemoglobin content (THC) (e) and regional cerebral oxygen saturation (f) in the study population according to postmenstrual age reflecting the previously described increase of regional cerebral oxygen saturation and THC with increasing postmenstrual age.  Arterial oxygen saturation was stable and in all infants throughout the measurements: 97 (91 to 99)%. 5.DiscussionThe NIRS is increasingly used in neonatal intensive care. Instruments suitable and approved for continuous monitoring in this age group give readings on a measure of cerebral oxygenation based on several assumptions that may not hold true in a given infant—and hence displayed values of cerebral oxygenation may not be appropriate in certain individuals. Our study addressed the question whether the effects of the thickness of the layers skin, bone, and CSF consistently influences absolute or based on the diffusion equation for homogeneous, semi-infinite media as measured by multidistance FD-NIRS in a mixed neonatal population. We hoped that integrating these layer thicknesses into algorithms that transform measured attenuation of near infrared light into measures of cerebral oxygenation would help to improve reliability of these readings. However, no such relationship was detected—apart from apparently “significant” correlations for at 692 nm with bone thickness and at 834 nm with skin thickness, which we cautiously interpreted as chance findings given that (a) we performed 16 statistical tests without correction for multiple testing, (b) visual analyses of scatter plots did not support the findings of relevant correlations, and (c) no correlation was observed for at 692 nm with skin thickness although the reduced scattering coefficients at the two wavelengths should be highly correlated themselves. Therefore, measures of cerebral oxygenation may not be consistently influenced by differences in these layer thicknesses within the range encountered in the described population at least if using multidistance FD-NIRS. Our findings are in agreement with a previous report suggesting that, in a pig model, scalp, and skull thickness should have little impact on and .13 Furthermore, these results of in vivo measurements are in agreement with the in vitro study by Franceschini et al.,10 showing that thin homogeneous layers above a semi-infinite block do not change and , at least as long as the layer is thick. We expected that at least the thickness of the CSF should have a consistent impact on and because of potential “tunneling” of light in a clear fluid, but this could also not be detected in our population. There may be several explanations for not finding a major effect of CSF thickness on and : (1) Obviously, studying the thickness of the CSF as a single distance is a rather crude measure because this does not take into account that the “CSF space” anatomically consists of the cranial meninges of dura mater, arachnoid mater, and pia mater as well as CSF. It is not possible to discriminate those “sublayers” in detail by transcranial ultrasound, so that we accepted them as just one unit of measurement. This may be acceptable because Custo14 demonstrated that the absorption of light by these meningeal membranes is very small. (2) Due to the gyri and sulci of the brain, CSF thickness is almost certainly variable over the four emitter–detector distances, whereas we only estimated a single value for CSF thickness in each patient. (3) Based on the work of Okada and Deply15 it may be assumed that CSF (including arachnoid trabeculae) is a low scattering layer rather than a clear liquid. (4) Finally, other yet unknown and unmeasured covariables may have affected the measurements. Hair follicles and hair, as well as skin color can absorb light at the wavelengths of interest for NIRS. Studies using a phantom showed that thick black hair, on its own, enhances absorption by up to 20%,16 but no infant in our group had such hair or relevant skin pigmentation (all being of Caucasian origin), so that it is unlikely that these interfered with the measurements. Furthermore, care was taken to comb any existing newborn hair apart before placing the optode. Similarly, van der Zee17 demonstrated that white matter is more scattering than gray matter due to the high refractive index of myelin, but we were unable to take such influence into account because myelination is hardly developed in newborn infants and assessment of gray matter thickness by ultrasound did not seem feasible. We chose a mixed neonatal population, comprising term and preterm infants along with early and later postnatal measurements in the preterm population, to enable a good range of layer thicknesses, because the thickness of the layers is subject to developmental changes. Doing so meant that minor developmental changes in skin and brain water content were accepted, i.e., not taken into account for the analyses herein. It is noteworthy however, that even if the groups of term infants, preterm infants measured during their first 2 days of life, and older preterm infants were evaluated separately (to avoid variability introduced by different developmental stages), there was no consistent pattern of correlation between the optical parameters and extra-cerebral tissue layer thicknesses. The position of the optode was chosen to enable measurements of layer thickness as depicted in Fig. 4 and to avoid that the falx cerebri or the sagittal sinus may influence NIRS readings,18,19 given our relatively wide maximum emitter–optode distance of 30 mm. The observed thicknesses of skin, bone, and CSF reported herein may be helpful for the creation of new head models to facilitate studies on NIRS in preterm and term infants. Although layer thicknesses were variable, intra-subject coefficients of variation of three measurements were for all layers in the majority of individuals at least over a distance of 16 mm. It is a limitation that, due to the geometry of the ultrasound probe, we can neither provide data on layer thickness variability over the complete emitter–optode distance range of 30 mm, nor quantify exactly the layer thicknesses at the specific positions of emitters and optodes. The lack of correlation between extra-cerebral layer thicknesses and the optical parameters and may indicate that these layer thicknesses do not have a relevant impact on and and consequently on measures of cerebral oxygenation. This conclusion is based on the assumption, that the inter-subject variability of and resulting from variability of structural or physiological parameters was not large enough to overcome an existing underlying correlation between and and extra-cerebral tissue thicknesses. If this assumption was incorrect, our conclusion would be invalid. As outlined above in support of our conclusion, we can specifically rule out major variability form clinically relevant anemia, hemodynamic disturbance, and diminished arterial oxygen saturation (hence pathologically high or low cerebral concentrations of and HHb), ethnicity (hence relevant differences in skin and hair color and texture), and relevant white matter myelination (hence major variability in scattering properties of cerebral tissue) in our study population. 6.ConclusionSkin-, bone-, and CSF-thickness within the range studied here did not correlate with and hence do not seem to have an effect on the absolute coefficients and in term and preterm infants and may therefore be disregarded when calculating values for oxygenated and deoxygenated hemoglobin and measures of cerebral oxygenation, at least if measured by multidistance FD-NIRS. AcknowledgmentsWe would like to thank the infants and their families for participating in this research project. This study was supported by AKF-Grant E.03.27025.1 from the Faculty of Medicine Tuebingen, Germany. The funding agent did not have any involvement in (1) the study design; (2) the collection, analysis, and interpretation of data; (3) the writing of the report; and (4) the decision to submit the paper for publication. ReferencesG. GreisenT. LeungM. Wolf,
“Has the time come to use near-infrared spectroscopy as a routine clinical tool in preterm infants undergoing intensive care?,”
Philos. Trans. A. Math. Phys. Eng. Sci., 369
(1955), 4440
–4451
(2011). http://dx.doi.org/10.1098/rsta.2011.0261 PTRMAD 1364-503X Google Scholar
M. WolfG. Greisen,
“Advances in near-infrared spectroscopy to study the brain of the preterm and term neonate,”
Clin. Perinatol., 36
(4), 807
–834
(2009). http://dx.doi.org/10.1016/j.clp.2009.07.007 CLPEDL 0095-5108 Google Scholar
M. Wolfet al.,
“A review of near infrared spectroscopy for term and preterm newborns,”
J. Near Infrared Spectrosc., 20 43
–55
(2012). http://dx.doi.org/10.1255/jnirs.972 JNISEI 0967-0335 Google Scholar
S. FantiniM. A. FranceschiniE. Gratton,
“Semi-infinite-geometry boundary-problem for light migration in highly scattering media—a frequency-domain study in the diffusion-approximation,”
J. Opt. Soc. Am. B, 11
(10), 2128
–2138
(1994). http://dx.doi.org/10.1364/JOSAB.11.002128 JOBPDE 0740-3224 Google Scholar
S. Fantiniet al.,
“Non-invasive optical monitoring of the newborn piglet brain using continuous-wave and frequency-domain spectroscopy,”
Phys. Med. Biol., 44
(6), 1543
–1563
(1999). http://dx.doi.org/10.1088/0031-9155/44/6/308 PHMBA7 0031-9155 Google Scholar
S. J. Matcheret al.,
“Performance comparison of several published tissue near-infrared spectroscopy algorithms,”
Anal. Biochem., 227
(1), 54
–68
(1995). http://dx.doi.org/10.1006/abio.1995.1252 ANBCA2 0003-2697 Google Scholar
E. OkadaD. T. Delpy,
“The effect of overlying tissue on NIR light propagation in neonatal brain,”
OSA TOPS on Adv. Opt. Imaging Photon Migr., 2 338
–343
(1996). Google Scholar
Y. FukuiY. AjichiE. Okada,
“Monte Carlo prediction of near-infrared light propagation in realistic adult and neonatal head models,”
Appl. Opt., 42
(16), 2881
–2887
(2003). http://dx.doi.org/10.1364/AO.42.002881 APOPAI 0003-6935 Google Scholar
B. A. Larssonet al.,
“Regional variations in skin perfusion and skin thickness may contribute to varying efficacy of topical, local anaesthetics in neonates,”
Paediatr. Anaesth., 6
(2), 107
–110
(1996). Google Scholar
M. A. Franceschiniet al.,
“Influence of a superficial layer in the quantitative spectroscopic study of strongly scattering media,”
Appl. Opt., 37
(31), 7447
–7458
(1998). http://dx.doi.org/10.1364/AO.37.007447 APOPAI 0003-6935 Google Scholar
K. Yoshitaniet al.,
“Effects of hemoglobin concentration, skull thickness, and the area of the cerebrospinal fluid layer on near-infrared spectroscopy measurements,”
Anesthesiology, 106
(3), 458
–462
(2007). http://dx.doi.org/10.1097/00000542-200703000-00009 ANESAV 0003-3022 Google Scholar
S. N. DavieH. P. Grocott,
“Impact of extracranial contamination on regional cerebral oxygen saturation a comparison of three cerebral oximetry technologies,”
Anesthesiology, 116
(4), 834
–840
(2012). http://dx.doi.org/10.1097/ALN.0b013e31824c00d7 ANESAV 0003-3022 Google Scholar
M. Firbanket al.,
“Measurement of the optical properties of the skull in the wavelength range 650–950 nm,”
Phys. Med. Biol., 38
(4), 503
–510
(1993a). http://dx.doi.org/10.1088/0031-9155/38/4/002 PHMBA7 0031-9155 Google Scholar
A. Custoet al.,
“Effective scattering coefficient of the cerebral spinal fluid in adult head models for diffuse optical imaging,”
Appl. Opt., 45
(19), 4747
–4755
(2006). http://dx.doi.org/10.1364/AO.45.004747 APOPAI 0003-6935 Google Scholar
E. OkadaD.T. Delpy,
“Near-infrared light propagation in an adult head model. I. modeling of low-level scattering in the cerebrospinal fluid layer,”
Appl. Opt., 42
(16), 2906
–2914
(2003). http://dx.doi.org/10.1364/AO.42.002906 APOPAI 0003-6935 Google Scholar
M. Keelet al.,
“Regional differences of cerebral hemoglobin concentration in preterm infants measured by near infrared spectrophotometry,”
Technol. Health Care, 7
(1), 63
–73
(1999). THCAE2 0928-7329 Google Scholar
P. van der Zeeet al.,
“Experimentally measured optical pathlengths for the adult head, calf and forearm and the head of the newborn infant as a function of inter optode spacing,”
Adv. Exp. Med. Biol., 316 143
–153
(1992). AEMBAP 0065-2598 Google Scholar
M. FerrariL. MottolaV. Quaresima,
“Principles, techniques, and limitations of near infrared spectroscopy,”
Can. J. Appl. Physiol., 29
(4), 463
–487
(2004). http://dx.doi.org/10.1139/h04-031 CJAPEY 1066-7814 Google Scholar
M. Dujovnyet al.,
“Use of cerebral oximetry to monitor brain oxygenation reserves for skull base surgery,”
Skull Base Surg., 4
(3), 117
–121
(1994). http://dx.doi.org/10.1055/s-2008-1058961 SBSUEL 1052-1453 Google Scholar
|
||||||||||||||||||||||||||||||||||||||||||||||||||||||||||||||||||||||||||||||||||||||||||||||||||||||||||||||||||||||||||||||||||||||||||||||||||||||||||||||