
|
|
1.IntroductionA critical issue in the production of ophthalmic lenses is to guarantee the correct centering and alignment of both front and back lens surfaces throughout the manufacturing and mounting processes. Aimed to that, progressive addition lenses (PALs) are supplied with two types of markings for layout, power verification, dispensing, and identification purposes: removable and permanent marks.1 Removable or temporary markings are inked on and permit the identification and verification of the lens zones (essentially, distant, near, and corridor zones). Permanent markings are engraved upon the surface and provide useful information, such as model identification and addition (add) power of the PAL, as well as to serve as locator marks to re-ink the removable marks if needed. Both marks are placed at standardized locations at the lens. Because of their enduring characteristics, permanent marks are the most important ones. Both mineral glass and lightweight plastic PALs are marked at various stages of production for internal tracking purposes as well as for final production. The marking process involves sometimes the engraving of lens molds, or the semi-finished lenses, or polished ones, and it can be performed by using either mechanical erosion (abrasive process) or laser engraving systems (laser ablation process). Nowadays, laser engraving systems are the most used ones due to the development of new Excimer engraving stations providing high reliability, ease of operation, low maintenance downtime, high volume applications, and significantly reduced operating costs.2 Laser engraving can be applied to both mineral and plastic materials at two different stages in the working flow of PAL production.3 On one hand, markings containing relevant information about the PAL, such as reference points, add-power, manufacturer logo, lens model, and material, are engraved before coating the lens. Some examples of coatings are hard coating, adhesion layers, antireflection multilayer, and hydrophobic coating. Thus, the engraved marks (holes or grooves in the base material depending on the laser operating mode) are filled with the coating material. On the other hand, engravings can also be performed after coating and before lens inspection, printing, edging, and final packaging. This is the preferred case for branding the PAL and in such cases, the permanent marks will exhibit a microrelief in the form of holes and/or grooves as a consequence of the coating material elimination during the engraving. In any case, permanent marks must be clearly visible to the trained optician but relatively unobtrusive to the eyeglass end-user. This fact affects the manufacturing process of the permanent marks. For instance, the marks created in uncoated lenses should have enough depth in order to become visible after the coating process but not in excess to avoid irregularities and inhomogeneities in the coating layer which will produce iridescences and lack of visual comfort when looking through the lens. For marks created on coated lenses, the marks must be very precise with very clean edges in order to eliminate the risk of coating delamination during lens wearing and cleaning. So, inspection and/or characterization of permanent marks at different production stages help to improve their final quality.4 Characterization of permanent marks in PALs essentially depends on the type of mark to be analyzed. For those marks involving a micro-relief on the lens surface (i.e., engravings performed before applying the coating and in the branding stage), standard topographic measurement techniques such as, for instance, scanning electron microscopy,5,6 atomic force microscopy,6,7 confocal microscopy,8,9 and interference microscopy10–14 can be used to characterize the three-dimensional (3-D) quantitative profile of the permanent mark. From all those techniques, only confocal microscopy has been applied for engraved marks characterization in ophthalmic lenses (see the manual brochures of Laser 2000 company3). The reason seems to be obvious: confocal microscopy and, in general, all those previously commented techniques are time consuming (invalid for direct implementation in the production line) and involve very expensive equipment (only accessible for a few). Moreover, the microrelief is lost after lens coating since the coating material fills the 3-D engraving; so confocal microscopy is not useful under those conditions. In such cases, engraved marks can be understood as a sandwich of two layers of different materials having different refractive index values and thicknesses. Under this perspective, the phase of the wavefront transmitted by the PAL is distorted (advanced or delayed) according to this two-layer sandwich. Then, phase-sensitive techniques are on the pole position for characterizing the engraved marks through measuring the phase distribution. Among them, holography is a widely used method for quantitative phase imaging with applications ranging from the measurement of object displacement, shape deformation, and vibration monitoring15,16 to many others in life sciences and biomedicine.17,18 Holography dates back to the year when Dennis Gabor reported on a method to avoid spherical aberration and to improve image quality in electron microscopy.19 Essentially, Gabor’s architecture proposes an in-line configuration where two beams interfere at the recording plane. One beam is the imaging beam caused by sample’s diffraction and the other one is the reference beam incoming from the nondiffracted light passing through the sample. Both beams interfere in propagation, and the resulting light distribution is recorded on a photographic film. Finally, the reconstruction is obtained by illuminating the film with a reconstruction wave identical to the reference wave that was used in the recording process. This two-step holographic method was pioneering but suffered from three major drawbacks: the reconstructed image is affected by coherent noise, the twin image problem of holography that also affects the final image quality, and a restricted sample range (weak diffraction assumption) for preserving the holographic behavior of the method. Nevertheless, the holographic principle proposed by Gabor is the simplest holographic layout ever implemented and its application to the visible (optical) range was performed by Rogers a few years later.20 Nowadays, most of those drawbacks have been overcome and new capabilities have been added due to the replacement of the classical recording media (photographic plate) by digital sensors (CCD and CMOS cameras).21,22 Thus, digital in-line holography23–25 (DIH as the digital version of Gabor’s holography) has been validated with coherent noise reduction by the use of partially coherent light sources26,27 and also with twin image elimination.28 Moreover, improved resolution images have been reported using digital processing tools,29 pixel superresolution,30 and synthetic aperture generation31 strategies. And finally, the Gabor’s approximation regarding the sample’s weak diffraction assumption can also be beaten by abandoning the Gabor in-line layout and externally reinserting the reference beam at the recording plane in an angle (off-axis geometry) on both classical32–34 and digital versions.35,36 However, the condition imposed by the weak sample diffraction restriction is far from a problem in our case since the engraved marks are one of the best Gabor-like objects one can imagine. Since the PAL’s engravings are essentially transparent (weak diffractive sample), the in-line hologram highly approaches a Gabor hologram where the powerless imaging wave caused by diffraction at the PAL mark interferes with the strong nondiffracted light passing through it. In this manuscript, we present a novel application of DIH involving both an extremely simple visualization (identification) and a characterization (quantitative measurement) system for permanent marks in PALs.37 We have called the device a wavefront holoscope (or simply as “w-holoscope”) since it permits engraving mark inspection in a PAL looking its diffracted wavefront and using a digital implementation of Gabor holography. Although the term “holoscopy” has been previously adopted in other disciplines such as 3-D imaging,38 optical coherence tomography39,40 and digital holographic microscopy,41 holoscopy makes reference to whole (“hólos”) visualization (“skopein”) of the object information, being our device one of its simplest implementations. Light emitted by a partially coherent light source is used to illuminate the PAL which is placed just before a monochrome CCD sensor. Thus, the in-line recorded digital hologram first provides a misfocused intensity image of the permanent mark where the mark can be visualized and identified; and second, it allows a digital postprocessing stage of the recorded hologram by means of classical holographic tools applied in the digital domain (refocusing of the mark, twin image removal by phase iterative algorithms, phase contrast and 3-D imaging modes, etc.) in order to measure and characterize the engraved mark. The manuscript is organized as follows. Section 2 provides a theoretical analysis as well as initial calibration of the proposed experimental setup. Section 3 presents the experimental results obtained when visualizing permanent marks in PALs with the proposed wavefront holoscope. Finally, Sec. 4 provides some discussion as well as the main conclusions of the paper. 2.Wavefront Holoscope Analysis and Proposed Methodology2.1.Main System ParametersThe proposed experimental setup is outlined through Fig. 1. Essentially, a spherical point divergent beam illuminates the PAL mark placed and centered before a CCD camera for the recording of the in-line hologram. In DIH, the layout magnification factor () is computed as the object geometric projection into the recording device in the form of where and are the distances (see Fig. 1) from the CCD and the illumination pinhole to the input object plane, respectively. Typical values for those distances in lensless microscopy are obtained by selecting close to 1 mm (or even below, fact that can generate experimental problems due to the proximity between hardware components) and around 1 to 2 cm, thus allowing factors in the [, ] range (or even higher). Nevertheless, there is no need to provide high magnification values since PAL permanent marks are supposed to be visible under naked eye. Then, the requirement to place the input sample very close to the illumination source is no longer required in our setup thus relaxing experimental complexity. Even more, the PAL position should be closer to the CCD than to the illumination source since a low magnification value is pursued in order to frame the mark’s diffraction pattern into the available CCD recording area.Fig. 1Experimental setup arrangement of the w-holoscope. CCD and SLD are the charged-coupled device and the super luminescent diode, respectively. 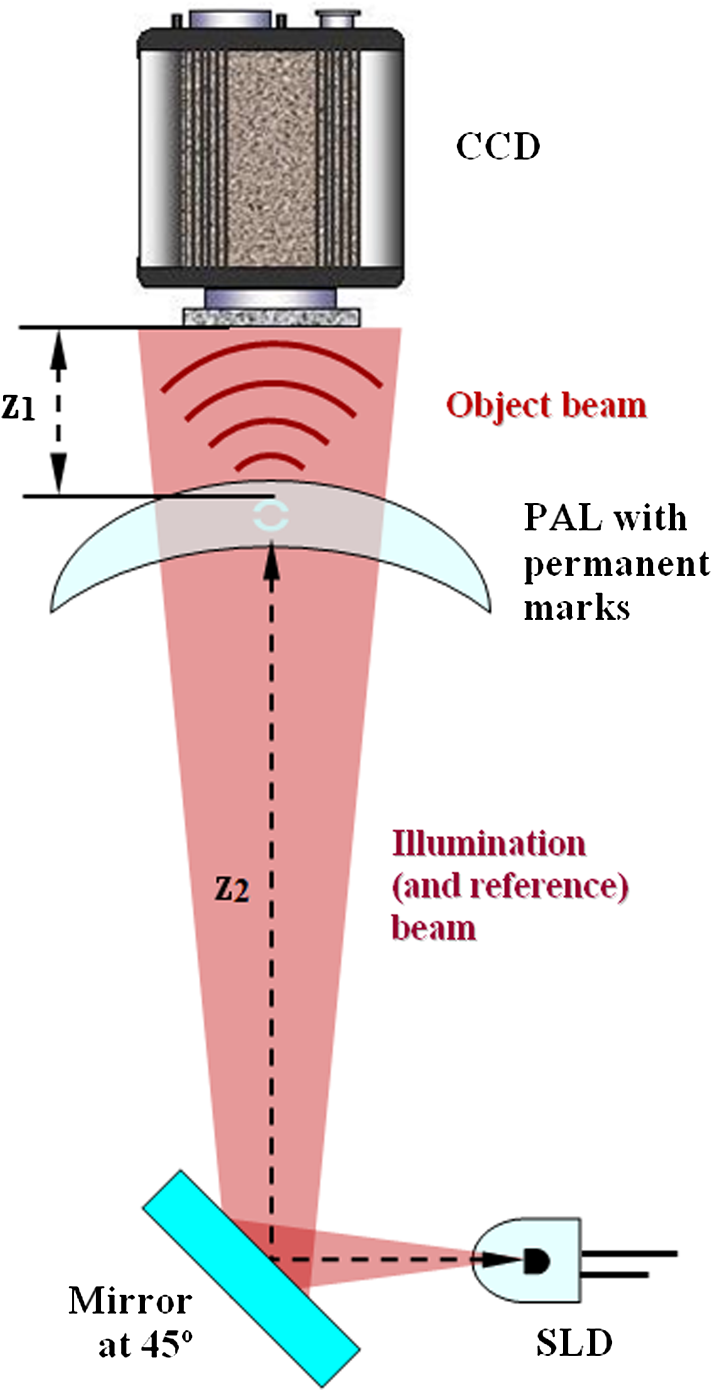 However, an additional issue should be taken into account for more realistic magnification calculation in the w-holoscope. Since the PAL contains optical power, the distance is changed to since the lens modifies the axial position where the illumination beam is generated. However, the definition of the optical power is not easy since the PAL contains a progressive dioptric power profile. Moreover, the situation is even worse when inspecting the nasal and temporal permanent marks due to the strong peripheral astigmatism as a consequence of the continuous change in power along the PAL. So, it is difficult to select the dioptric power of the engravings surrounding area for the calculations. For the sake of simplicity and as first-order approximation, we have selected the dioptric power value corresponding with the spherical equivalent of the PAL at the distant vision zone. Because of the spherical equivalent is usually represented as (the same letter than for the magnification) and to avoid misunderstandings, we have represented such value by NES (incoming from nearest equivalent sphere, which is also used as an equivalent ophthalmic definition). Notice that the NES value will provide a first-order approximation and specific power measurement at those areas will be needed in order to precisely know the real value which, in general, will result from astigmatic powers thus defining a different magnification value for each lens meridian. In any case, the NES value can be replaced by the specific dioptric power without additional penalties in the calculations. Thus and assuming thin lens approximation, we can apply the Gauss equation to calculate the new distance as: , being a negative distance. As a result, the new magnification value is defined as where is the previously defined magnification value []. For example, for a diopters (a reasonable value for the spherical equivalent) and (as it is set in our experiments), the new magnification comes from the addition of the original one () plus 0.1, that is, a very small modification.The other important parameter in a DIH layout is its spatial resolution limit that will result as the most restrictive value from two possibilities: the limits provided by the wave nature of light (diffraction resolution limit) and by the sampling criterion at the CCD plane (geometrical resolution limit). On one hand, resolution limit imposed by diffraction can be calculated as , where is the numerical aperture of the imaging system due to its aperture size, is the illumination wavelength, and is a constant equal to 0.82 for coherent imaging systems.42 In DIH, the CCD recording area (number of pixels in horizontal and vertical directions times the pixel size) defines the aperture of the imaging system and, thus, its value once considering the distance. For instance, using red illumination () and considering a permanent mark with a typical detail size of (see Ref. 3), the of the imaging system should not be lower than 0.005 to resolve such laser spot size. In our experiments, we have used a A312f Basler camera (, 8.3 μm pixel size, ) placed at 25 mm from the inspected marks; with those values, the values in the horizontal (H) and vertical (V) directions are and , approximately. So, we are satisfying the resolution requirements imposed by diffraction when analyzing a permanent mark composed by laser spots of 100 μm in diameter. In addition, we have used a 12-bit camera but, although 4096 gray levels will always perform a better image quantization than 256 ones, the proposed method could be perfectly implemented with 8-bit cameras. On the other hand, geometrical resolution is a consequence of the nonzero pixel size when sampling the recorded hologram. In applications where a high magnification value is pursued (), the inspected object as well as the interferometric fringes are magnified, thus relaxing the sampling requirements. However, this point is a critical situation in our layout since the recorded holographic fringes are no longer magnified. Assuming two pixels () as the minimum period that can be sampled by the CCD (Nyquist sampling criterion), the maximum value before aliasing can be calculated as . This value applies in the case when the object is placed in close contact with the digital sensor.25 When magnification enters in the game, it can be seen as a factor that reduces the effective pixel size since it magnifies the interferometric fringes. In our experiments, and , and the magnification value is , approximately, value computed from Eq. (1) since the U.S. Air Force (USAF) test does not contain optical power (it is a thin plane-parallel glass plate). Thus, the effective sampling NA value and its resolution limit are: and . Thus, although the of the CCD restricted area approaches from 0.1 to 0.13 for the V and H CCD directions, the effective NA of the experimental layout is defined from the CCD geometrical constraints () limiting the spatial resolution to 14.8 μm on both CCD directions, approximately. Nevertheless, this value perfectly matches the requirements to resolve a laser spot size of 100-μm width in the PAL as a typical value.3 In order to validate those assumptions, we have performed an experiment involving a USAF resolution test target and a super luminescent diode (SLD) source from Exalos (Model EXS6501-B001, 10-mW optical power, 650-nm central wavelength, 6-nm spectral bandwidth) to provide quasi-point divergent spherical illumination. SLDs combine the advantages of both light-emitting diode (LED) and laser diode (LD) sources since, on one hand, SLDs provide temporal incoherence illumination incoming from a broadband spectrum (such as LEDs) and, on the other hand, SLEDs are similar in geometry to LDs but without optical feedback mechanism for laser light emission thus providing a high degree of spatial coherence. As a result, SLDs provide partially coherent quasi-point illumination that reduces noise incoming from speckle and coherent artifacts while allowing interference according to its coherent length42 that can be calculated as , where for Gaussian spectrum, the central wavelength, and the spectral bandwidth. Figure 2 presents the images where we have included two different distances: 25 mm (on first row) and 10 mm (on second row). Images in (a1) and (a2) are the digital in-line holograms while (b1) and (b2) show their numerical focusing, respectively. Finally, images included in (c) and (d) present magnified areas of the focused images. Note that image magnification is a bit different ( and ) as it comes from the two presented layout cases ( and , respectively, and on both cases). Fig. 2Experimental validation of the w-holoscope resolution limit using a USAF test target as input object. The upper and lower rows show the cases of a propagation distances equal to 25 and 10 mm to focus the object.  Through Fig. 2(d1), we can see that the last resolved element is Group 6-Element 1 (from now on named as GX-EY in generic notation) for both H and V directions. Since we are using a rectangular CCD, the resolution limits due to diffraction should be different depending on the CCD direction that we consider. As we have previously noted for , and defining a resolution limits for the H and V CCD directions of () and . Those resolution limits, besides being different, will enable imaging of the G7-E6 and G7-E4 as last resolved test element for the H and V directions, respectively. Experimentally [Fig. 2(d1)], we have obtained the same last resolved element for both directions with a pitch of (G6-E1). In fact, the G6-E2 () is not resolved in Fig. 2(d1) due to noise but it is just in the limit after twin image removal [see Fig. 5(b1) in next section]. Those values perfectly match with our theoretical resolution sampling limit set to . The situation is a bit different for since the magnification value is reduced until because the USAF target is closer to the CCD. Then, the new theoretical values are and corresponding with the G5-E6 USAF last resolved element (). As we can see in Fig. 2(d2), the last experimental resolved element is G5-E6 thus matching again the theoretical calculations. But G6-E1 () is very close to our theoretical prediction and it is expected to be resolved after twin image removal [see Fig. 5(b2) in next section]. 2.2.Digital Image Processing StageThe proposed procedure for permanent mark inspection (visualization and characterization) in PALs implies first the recording of the in-line hologram corresponding to the region of interest (ROI) containing the diffracted wavefront of the inspected mark, second a digital processing stage to remove twin image contribution and focus the ROI, and third the preparation of final images. Holographic recording is accomplished by placing the PAL into an XYZ translation platform in order to correctly place the permanent mark ROI in front of the CCD sensitive area. After that, the digital processing stage implements a phase retrieval algorithm that consists of the iterative application of back-and-forth numerical propagations considering some specific constraints of the ROI. After a given number of iterations, the retrieved image contains no information about the twin holographic image and exhibits better-quality image concerning noise, halos, and contrast. Finally, the retrieved complex amplitude distribution is imaged under several imaging modalities, such as 3-D representation of the mark’s retrieved phase, contrast image of the inspected mark, plotting some regions for mark profiling, etc. The constraints to apply during the phase retrieval algorithm depend on the type of inspected object.43–45 In our case, a permanent mark can be considered as a pure phase object. The flow diagram of the applied algorithm is represented in Fig. 3 where all the variables are spatially dependent [for instance: ] but we have not included the coordinates in the figure to save space. One iteration of our algorithm starts with a digital propagation of the square root of the recorded intensity (named as and marked with a dashed line red rectangle in Fig. 3) until focusing the engraved mark (). Then, the obtained propagation distance to focus the mark is stored in the computer’s memory. There are different numerical methods for digital reconstruction of the diffraction integral.15,46 Among them, we have selected to solve the diffraction Rayleigh-Sommerfeld integral using convolution operation since it allows an effective and economical calculation without any approximation. After numerical propagation at the plane where the mark is focused (the real image plane and ), we retain the phase distribution introduced by the numerical propagation () and disregard the amplitude information () since we a priori know that the engraved mark can be closely approximated as a pure phase object. This pure phase distribution is back propagated again until the hologram plane () where the phase information () is retained once again and the amplitude distribution () is replaced by the square root of the recorded hologram intensity (). This synthetic hologram () improves the initial hologram because it contains the initial amplitude information () in addition with a tentative phase distribution incoming from the first iteration (). Then, the synthetic hologram enters again in the same back-and-forth propagation algorithm and the engraved mark’s phase distribution () is retrieved after a few iterations () and a final back propagation to the object plane. Phase retrieval can be viewed as a process where, from the two compatible available phase solutions (real and twin images) resulting in the recorded intensity hologram, only one is selected (the real one), and the other (the twin one) is eliminated. Fig. 3Flow diagram of the phase retrieval algorithm. The process starts with the recorded hologram intensity (dashed red line frame) and then the arrows guide the way of reading (clockwise direction) until the N’th final iteration where the phase information is retrieved (solid red line frame). The variables (I, A, U, O and their primes indexes) in the chart are -spatially dependent.  Figure 4 includes the images obtained when applying the proposed algorithm to our USAF validation case. We have included images concerning only one experimental configuration () since it is the one selected when using PALs. Because of the USAF resolution test that is not a pure phase object but a pure amplitude one, the constriction applied in the phase retrieval algorithm is not to save the phase and disregard the amplitude but just the contrary: we retain the real part ( for the first back propagation at Fig. 3) while removing the phase information ( for the first back propagation at Fig. 3) when focused at the test.44,45 Fig. 4Experimental validation of twin image removal by phase retrieval using a U.S. Air Force test target and (upper row in Fig. 2). The upper and lower rows show the case without and with phase retrieval algorithm.  The upper row of Fig. 4 depicts the case where the phase retrieval algorithm is not applied. The recorded hologram (central image) can be digitally propagated to focus the USAF test at both real (negative propagation distance) and twin (same propagation distance but with opposite sign) imaging planes. Note that the twin image is inverted (and conjugated but this fact is not noticeable since the USAF does not contain complex amplitude information) in comparison with the real image. Moreover, we can see the halos and noise in the real focused image incoming from the misfocused twin image at such plane (and vice versa). Once the phase retrieval algorithm is applied (lower row), the USAF real image term is retrieved without twin image noise contributions, that is, with improved contrast and reduced noise fluctuation. Moreover, digital propagation of the retrieved real image to the twin image plane does not provide the in-focus inverted test image but only the diffraction test pattern after propagation a distance twice the distance used to focus at the hologram plane. In other words, the twin image contribution is removed. Finally, Fig. 5 shows the retrieved images with magnification of the central regions after applying the phase retrieval algorithm for (upper row) and (lower row) layout cases. Note as now, G6-E1 is clearly visible on both cases while it is barely resolved at Fig. 2(d1) and 2(d2), and even G6-E2 is suspected to be resolved at Fig. 5. 3.Wavefront Holoscope Validation for Engraved Permanent Marks on PALsA double picture of the experimental setup is included in Fig. 6. We can see that the system layout is very simple and composed by a minimum of optical components, allowing the system to be robust and with possibility to be miniaturized and compact. Moreover, we have adopted an L-configuration (see Fig. 1) for assembling reasons, but further dimensional reduction in the experimental layout can be achieved by using, for instance, a U-design with two folding mirrors at 45 deg. As we have previously commented, a SLD source (Exalos EXS6501-B001, 650 nm wavelength) is used to provide spherical point divergent illumination of the PAL that is placed just before a CCD sensor (Basler A312f, , 8.3-μm pixel size, ). The PALs (not included in the pictures) are mounted on an XYZ micrometric manual translation stage and placed at and from the SLD source. For the experimental validation, we first present the results provided by our wavefront holoscope when inspecting a PAL from Hoya company model Hoyalux iD l45. Figure 7 presents the PAL and the two inspected ROIs are marked with different color solid line rectangles. The two digital in-line holograms of the inspected marks are also included in Fig. 7 and magnified to clearly visualize the mark’s diffracted wavefront at the CCD plane. The right one (orange rectangle) contains the nasal engraved mark (“I45” quality mark of the PAL model), whereas the left one (green rectangle) depicts the temporal mark containing information of the add power (3.5 diopters) and an additional letter “F” indicating “free form design” of the PAL. Fig. 7Hoyalux iD PAL with the two inspected regions of interest (ROIs), and the diffraction pattern at 25 mm of the nasal (orange rectangle) and the temporal (green rectangle) marks. White horizontal scale bars in lower images are 1 mm.  As a whole example of digital processing, Fig. 8 shows the case of the permanent nasal mark included in Fig. 7 with a bit of digital magnification to optimize image visualization. Similarly to Fig. 4, the upper row depicts the images obtained without applying phase retrieval algorithm. The recorded hologram (central image) can be digitally propagated to focus the engraved mark at both real (left side) and twin (right side) imaging planes. We have included real as well as phase images at both imaging planes just to show that the twin image phase results conjugated as well as inverted when comparing with the real image one. Once again, it is noticeable the halos and noise in the focused real image incoming from the misfocused twin image at such plane (and vice versa). After 15 iterations in the phase retrieval algorithm (lower row at Fig. 8), the real image term is retrieved without twin image contribution allowing mark imaging with improved contrast and reduced noise. As is expected, digital propagation of the retrieved real image complex amplitude distribution shows no presence of the twin image term when propagating twice the distance used to focus at the hologram plane (central image). Fig. 8Experimental validation of twin image removal by applying phase retrieval algorithm using the w-holoscope on the nasal engraved mark included in Fig. 7. 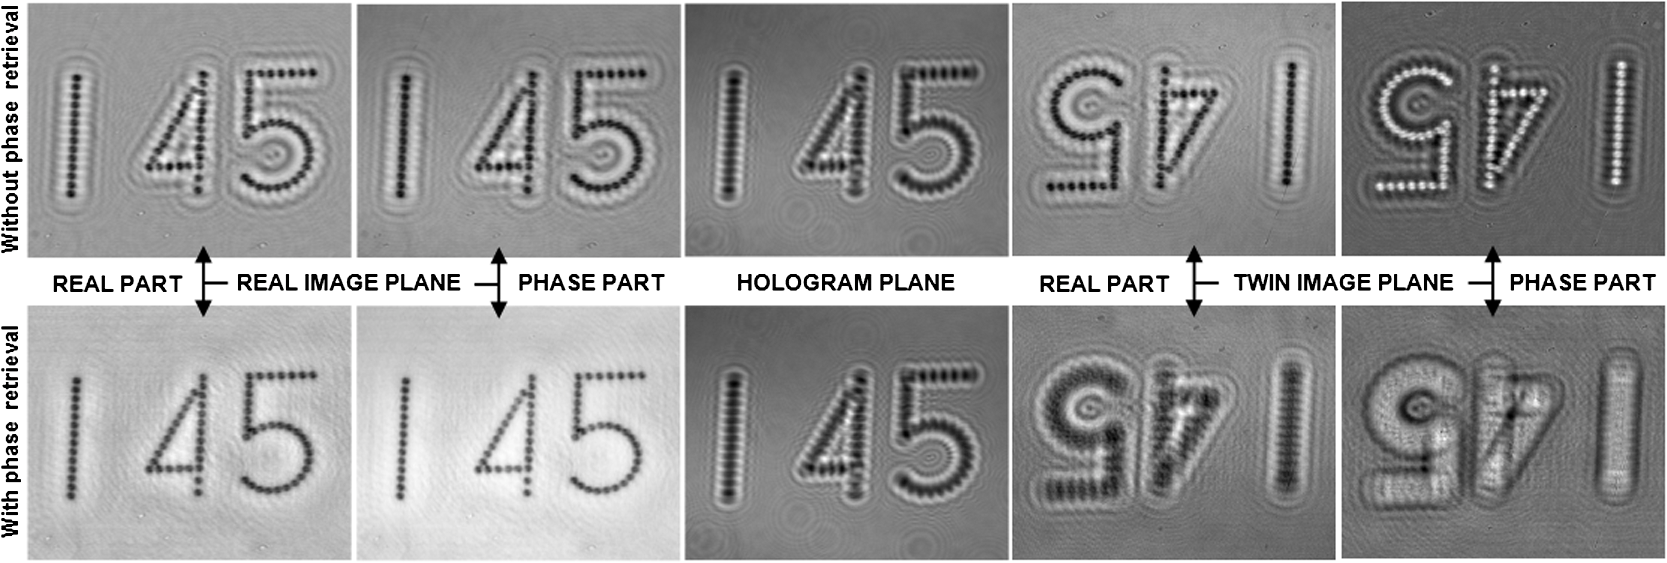 Moreover, since phase information is retrieved, it is possible to represent additional visualizations of the engraved mark (see Fig. 9). Thus, not only bright field images of the mark [Fig. 9(a) includes, for direct comparison, the same image than Fig. 8, lower row, left phase image] are possible but phase contrast imaging [Fig. 9(b)], and 3-D representations of the unwrapped phase distribution [Fig. 9(c)] where the color bar describes optical phase in radians. Figure 9 also presents the results derived from the temporal marks included in Fig. 7. Figure 9(d) includes the final bright field image after applying phase retrieval algorithm (15 iterations), Fig. 9(e) shows the phase contrast image, and Fig. 9(f) presents a 3-D view of the unwrapped phase distribution. The depression in the surroundings of the marks (white color level in the 3-D graphs) can be attributed to a nontotal twin image removal when applying the phase retrieval algorithm. As we can see, it supposes a phase step of around 0.2 rad over the background level [yellow color in the 3-D graphs corresponding with and values calculated from the unwrapped phase distributions included in (c) and (f)] while the mark phase height is in the interval to above the background level. Fig. 9Additional representations of the inspected marks using the w-holoscope: (a) phase contrast image, (b) plot along the blue dashed vertical line included in (a), and (c) 3-D representation of the unwrapped phase distribution incoming from the nasal permanent mark; and (d) the retrieved bright field image, (e) its phase contrast image, and (f) the 3-D plot of its unwrapped phase distribution for the temporal permanent mark. Hot level scale in (c) and (f) represents optical phase in radians. White horizontal scale bars in (b) and (e) are 1 mm.  Additional results are included in Figs. 10 and 11 when inspecting a Varilux PAL from Essilor. Figure 10 presents the images corresponding to the PAL add power information. This mark is engraved and then coated, so the final mark does not contain microrelief (similar case than the ones included in Fig. 9). Moreover, it is not composed by individual laser spots but for continuous engraving trajectories. Figures 10(a) and 10(b) represent, respectively, the real part and the 3-D unwrapped phase distribution when looking at the in-focus mark before and after applying the phase retrieval algorithm (20 iterations), respectively. We can see that the bright halo surrounding the in-focus image of the mark is fully removed after applying the phase iterative retrieval algorithm, and this fact also results in an improved 3-D characterization of the mark. Fig. 10Experimental results when inspecting a Varilux PAL with the w-holoscope: (a) real part (gray level image) and 3-D plot of the unwrapped phase distribution (hot colormap image) when directly focusing at the mark without applying phase retrieval algorithm, and (b) the same cases but after applying the phase retrieval algorithm. Black horizontal scale bar in (b) is 1 mm.  Fig. 11Experimental results when inspecting the Varilux branding with the w-holoscope: (a) bright field, (b) 3-D plot of the unwrapped phase distribution, and (c) phase contrast images of the phase distribution without applying phase retrieval algorithm, and (d), (e), (f) the same cases but after applying the phase retrieval algorithm. White horizontal scale bars in (d) and (f) are 1 mm.  Figure 11 presents the results obtained when applying the w-holoscope to the “Varilux” PAL brand. This mark differs from the previous ones in the fact that it defines a microrelief in the lens surface since the engraving removes a part of the coating. The images in Fig. 11 represent three different visualizations of the phase distribution without (upper row) and with (lower row) using the phase retrieval algorithm with 25 iterations: the bright field image in Figs. 11(a) and 11(d), their 3-D unwrapped phase distribution in Figs. 11(b) and 11(e), and their phase contrast images in Figs. 11(c) and 11(f). Through the 2-D images, we can realize on a contrast improvement as well as a noise reduction and analyzing the 3-D views, we can observe that the height of the letters from the background is approximately doubled [from background at and letters at approximately in Fig. 11(b) to approximately and in Fig. 11(d), respectively] as a consequence of the twin image removal. As last example, Fig. 12 presents the results obtained when inspecting a nonidentified dyeing sunglass. We have included this example since it is very illustrative of the w-holoscope capabilities. Figure 12(a) presents the recorded in-line hologram showing that the lower inscription (AGS1) is a very faint image in comparison with the upper mark (open ring). In fact, the “AGS1” inscription is almost invisible when inspecting it with the naked eye. After 30 iterations in the phase retrieval algorithm, Fig. 12(b) includes the in-focus phase image showing as the “AGS1” inscription becomes more visible (with higher contrast). Figure 12(c) presents the 3-D plot of its unwrapped phase distribution showing quantitatively that the phase delay in the “AGS1” mark is much lower than in the upper ring. Fig. 12Phase distribution of an unknown sunglass PAL: (a) recorded in-line hologram, and (b) and (c) phase gray level image and 3-D plot of the unwrapped phase distribution, respectively, after applying the phase retrieval algorithm with 30 iterations. White vertical scale bar in (b) is 1 mm.  Finally, we have performed an additional experiment for validating the experimental results: we have compared the recovered iterated phase distribution with the one provided by a home-made digital holographic microscope. This is a typical procedure for validating experimental results incoming from phase retrieval algorithms (see, for instance, Refs. 47 and 48). Figure 13 includes the comparison for the “I” inscription (line of 14 laser spots) of the engraving presented in the Hoyalux iD l45 nasal mark [see Fig. 7, orange rectangle, Figs. 8 and 9(a), 9(b), 9(c) cases]. In our especially assembled digital holographic microscope, we have used a modified Olympus BX60 upright microscope illuminated by a coherent light source (laser diode, 650-nm, 15-mW optical power) with the capability of inserting a reference beam in off-axis mode at the recording plane. The lower available magnification objective lens (Olympus UMPlan ) is selected for imaging the engraved mark onto a digital camera (same camera used in the w-holoscope). Due to geometrical restrictions in the field of view when building the microscope, only 13 of the 14 laser spots fall in the CCD recording area but the comparison becomes fully valid. The off-axis holographic recording permits the recovery of the transmitted spectral band by Fourier transforming the recorded hologram and Fourier filtering of one of the hologram diffraction orders. Once the spectral filtered distribution is centered at the Fourier domain, inverse Fourier transformation retrieves complex amplitude imaging. Figure 13 compares both the 2-D image as well as a plot of the unwrapped phase distribution provided by the w-holoscope [case (a)] with the one obtained by the especially assembled digital holographic microscope [case (b)]. We have equalized the phase values incoming from the w-holoscope to match it with the ones provided by the digital holographic microscope in order to directly compare the plots. Fig. 132-D images and 1-D plots of the unwrapped phase distributions provided by (a) the w-holoscope and (b) the especially assembled digital holographic microscope when inspecting part of the Hoyalux iD nasal engraving. Units at the plots are optical phase in radians.  Leaving aside the noise reduction in the image because of the SLD usage (point previously commented in Sec. 2.1), we want to stress two facts. First, the phase step from the background provided by the laser spots is almost the same in both plots: from 2.3 to 1.55 rad in Fig. 13(a) and from 2.4 to 1.6 rad in Fig. 13(b), approximately. This phase step is in good concordance with the phase step derived from Fig. 9. Second, the phase modulation between consecutive laser spots is similar ( to 0.5 rad) in both cases. These results show a high degree of correlation between the unwrapped phase distributions provided by both methods. 4.Discussion and Final ConclusionsIn this manuscript, we have proposed and validated a new application of DIH to solve the problem of visualization (identification) and characterization (quantification) of permanent marks in PALs. Although the basic layout and capabilities have been previously introduced in Ref. 37, the proposed manuscript expands the performance of the method by both providing a wide range of experimental results (not only preliminary results as in Ref. 37) and including a phase retrieval procedure that not only minimizes but fully removes the twin image contribution at the recorded holograms. Thus, the final image presents a high quality with improved contrast and reduced noise in comparison with the image that can be obtained by direct focusing the recorded holograms. The device and methodology have been named as wavefront holoscope (w-holoscope), and it could be the background technology of a new type of ophthalmic instrument for inspection of engraving marks in PALs. Experimental results have been reported showing the applicability of the w-holoscope for characterizing permanent engraved marks in different PALs types such as a sequence of individual laser spots (Hoyalux PAL example), a continuous engraving (Varilux PAL example), marks without and with surface relief, and a dyeing sunglass. All the presented cases contain a high amount of scratches since they are old PALs; but this is not a handicap for the w-holoscope as we have shown through the manuscript. The proposed w-holoscope can be divided into two well-identified parts. On one hand, the hardware is extremely simple, containing a reduced number of optical elements (illumination source, translation stage, and CCD sensor), easily adjustable to inspect different PAL regions of interest, and with an open architecture to be assembled depending on the specific installation requirements. On the other hand, the digital processing of the inspected marks improves its image quality due to numerical focusing and twin image removal. However, visualization and identification of the marks are achieved by direct inspection of the recorded in-line holograms since it comes from a diffracted wavefront containing a reasonable amount of defocus for identification of the numbers and/or symbols contained in the marks. Nevertheless, phase retrieval by digital image processing finally yields the quantification of the phase profile transmitted by the engraved mark. In our case, phase distribution contains information mainly related with refractive index changes and layer thickness, provided that the PAL does not contain a significant surface relief (at least in a small surrounding area). Then, considering the PAL as a two-layer sandwich of different materials and thicknesses, the recovered phase distribution is essentially proportional to the thickness profile generated by the engraving. By knowing the refractive index values of the materials involved in the sandwich (substrate material and first layer of the coating), it is possible to directly translate the optical phase values (in radians) to engraving mark profile (in microns). Thus, the 3-D plot of the unwrapped phase distribution provides a quantitative 3-D view of the surface relief generated by the engraving process in the substrate material but that can be measured before or after finishing the lens. Additional advantages of the w-holoscope can be derived from its low sensitivity to external perturbations such as vibrations and/or thermal changes due to the Gabor in-line architecture and the reduced recording time, a high acquisition rate (depending on the specific characteristics of the used CCD sensor) since full information of the mark’s diffracted wavefront is obtained from a single hologram, the absence of moving elements that can limit its accuracy, and the automation capability of the digital processing reducing user interaction with the device. Future work will be directed into two directions: to further improve the phase retrieval algorithm and to compensate for the image distortion caused by the PAL peripheral astigmatism at the inspected regions. The former will provide robustness to the w-holoscope since it will generalize the phase retrieval for a wide casuistic permanent mark range, and the latter will improve the phase accuracy measurement because it will allow engraving distortion compensation. AcknowledgmentsPart of this work has been funded by the Spanish Ministerio de Economía y Competitividad and the Fondo Europeo de Desarrollo Regional (FEDER) under the project FIS2010-16646. ReferencesD. MeisterJ. Sheedy, Introduction to Ophthalmic Optics, 6th ed.Carl Zeiss Vision, San Diego
(2008). Google Scholar
M. HaidlR. Paetzel,
“Excimer lasers make their reliability mark,”
Industrial Laser Solutions, 20
(11), 8
–10
(2005). Google Scholar
Laser 2000 GmbH, “Engraving. Printing. Automation. Controlling. Ophthalmic Systems,”
(2013) http://laser2000ophthalmic.com/sites/default/files/GB30_Ophthalmik-Katalog_2012_web.pdf December ). 2013). Google Scholar
X. FernandezS. Bosch,
“Inspection of centering marks engraved on ophthalmic lenses by model-based numerical correlation,”
Opt. Eng., 34
(7), 2120
–2125
(1995). http://dx.doi.org/10.1117/12.206581 OPEGAR 0091-3286 Google Scholar
M. Peruzziet al.,
“F2-laser ablation and micro-patterning of GaPO4,”
Europhys. Lett., 65
(5), 652
–657
(2004). http://dx.doi.org/10.1209/epl/i2003-10159-2 EULEEJ 0295-5075 Google Scholar
V. Gurycaet al.,
“Surface morphology of contact lenses probed with microscopy techniques,”
Cont. Lens Anterior Eye, 30
(4), 215
–222
(2007). http://dx.doi.org/10.1016/j.clae.2007.02.010 1367-0484 Google Scholar
Z. Liuet al.,
“Mechanically engraved mica surface using the atomic force microscope tip facilitates return to a specific sample location,”
Microsc. Res. Technol., 66
(2/3), 156
–162
(2005). http://dx.doi.org/10.1002/(ISSN)1097-0029 MRTEEO 1059-910X Google Scholar
D. GomezI. Goenaga,
“On the incubation effect on two thermoplastics when irradiated with ultrashort laser pulses: Broadening effects when machining microchannels,”
Appl. Surf. Sci., 253
(4), 2230
–2236
(2006). http://dx.doi.org/10.1016/j.apsusc.2006.04.036 ASUSEE 0169-4332 Google Scholar
G. Heiseet al.,
“Laser lift-off initiated by direct induced ablation of different metal thin films with ultra short laser pulses,”
J. Phys. D Appl. Phys., 45
(31), 315303
(2012). http://dx.doi.org/10.1088/0022-3727/45/31/315303 JPAPBE 0022-3727 Google Scholar
C. O’Mahonyet al.,
“Characterization of micromechanical structures using white-light interferometry,”
Meas. Sci. Technol., 14
(10), 1807
–1814
(2003). http://dx.doi.org/10.1088/0957-0233/14/10/310 MSTCEP 0957-0233 Google Scholar
E. AcostaS. ChamadoiraR. Blendowske,
“Modified point diffraction interferometer for inspection and evaluation of ophthalmic components,”
J. Opt. Soc. Am. A, 23
(3), 632
–637
(2006). http://dx.doi.org/10.1364/JOSAA.23.000632 JOAOD6 0740-3232 Google Scholar
F. Charrièreet al.,
“Characterization of microlenses by digital holographic microscopy,”
Appl. Opt., 45
(5), 829
–835
(2006). http://dx.doi.org/10.1364/AO.45.000829 APOPAI 0003-6935 Google Scholar
B. KemperG. von-Bally,
“Digital holographic microscopy for live cell applications and technical inspection,”
Appl. Opt., 47
(4), A52
–A61
(2008). http://dx.doi.org/10.1364/AO.47.000A52 APOPAI 0003-6935 Google Scholar
M. J. Giraldezet al.,
“White light interferometry to characterize the hydrogel contact lens surface,”
Ophthal. Physiol. Opt., 30
(3), 289
–297
(2010). http://dx.doi.org/10.1111/opo.2010.30.issue-3 OPOPD5 0275-5408 Google Scholar
T. Kreis, Handbook of Holographic Interferometry: Optical and Digital Methods, Wiley-VCH Verlag GmbH & Co. KGaA, Weinheim
(2005). Google Scholar
U. SchnarsW. Jüptner, Digital Holography, Springer-Verlag, Berlin
(2005). Google Scholar
G. von Bally, Holography in Medicine and Biology: Proceedings of the International Workshop, Springer, Münster
(1979). Google Scholar
N. T. ShakedZ. ZalevskyL. L. Satterwhite, Biomedical Optical Phase Microscopy and Nanoscopy, Academic Press (Elsevier), Oxford
(2013). Google Scholar
D. Gabor,
“A new microscopic principle,”
Nature, 161
(4098), 777
–778
(1948). http://dx.doi.org/10.1038/161777a0 NATUAS 0028-0836 Google Scholar
G. L. Rogers,
“Experiments in diffraction microscopy,”
XIV Proc. R. Soc. Edinb. A. Math. Phys. Sci., 63
(3), 193
–221
(1952). PEAMDU 0308-2105 Google Scholar
J. W. GoodmanR. W. Lawrence,
“Digital image formation from electronically detected holograms,”
Appl. Phys. Lett., 11
(77), 77
–79
(1967). http://dx.doi.org/10.1063/1.1755043 APPLAB 0003-6951 Google Scholar
T. Huang,
“Digital holography,”
Proc. IEEE, 59
(9), 1335
–1346
(1971). http://dx.doi.org/10.1109/PROC.1971.8408 IEEPAD 0018-9219 Google Scholar
W. Xuet al.,
“Digital in-line holography for biological applications,”
Proc. Natl. Acad. Sci. U. S. A., 98
(20), 11301
–11305
(2001). http://dx.doi.org/10.1073/pnas.191361398 1091-6490 Google Scholar
W. Xuet al.,
“Digital in-line holography of microspheres,”
Appl. Opt., 41
(25), 5367
–5375
(2002). http://dx.doi.org/10.1364/AO.41.005367 APOPAI 0003-6935 Google Scholar
A. OzcanU. Demirci,
“Ultra wide-field lens-free monitoring of cells on-chip,”
Lab. Chip., 8
(1), 98
–106
(2007). http://dx.doi.org/10.1039/b713695a LCAHAM 1473-0197 Google Scholar
L. RepettoE. PianoC. Pontiggia,
“Lensless digital holographic microscope with light-emitting diode illumination,”
Opt. Lett., 29
(10), 1132
–1134
(2004). http://dx.doi.org/10.1364/OL.29.001132 OPLEDP 0146-9592 Google Scholar
P. RyleS. McDonnellJ. T. Sheridan,
“Lensless multispectral digital in-line holographic microscope,”
J. Biomed. Opt., 16
(12), 126004
(2011). http://dx.doi.org/10.1117/1.3659681 JBOPFO 1083-3668 Google Scholar
V. Micóet al.,
“Phase-shifting Gabor holography,”
Opt. Lett., 34
(10), 1492
–1494
(2009). http://dx.doi.org/10.1364/OL.34.001492 OPLEDP 0146-9592 Google Scholar
M. Kankaet al.,
“Fast exact scalar propagation for an in-line holographic microscopy on the diffraction limit,”
Opt. Lett., 35
(2), 217
–219
(2010). http://dx.doi.org/10.1364/OL.35.000217 OPLEDP 0146-9592 Google Scholar
W. Bisharaet al.,
“Lensfree on-chip microscopy over a wide field-of-view using pixel super-resolution,”
Opt. Express, 18
(11), 11181
–11191
(2010). http://dx.doi.org/10.1364/OE.18.011181 OPEXFF 1094-4087 Google Scholar
V. MicóZ. Zalevsky,
“Superresolved digital in-line holographic microscopy for high resolution lensless biological imaging,”
J. Biomed. Opt., 15
(4), 046027
(2010). http://dx.doi.org/10.1117/1.3481142 JBOPFO 1083-3668 Google Scholar
E. N. LeithJ. Upatnieks,
“Reconstructed wavefronts and communication theory,”
J. Opt. Soc. Am., 52
(10), 1123
–1130
(1962). http://dx.doi.org/10.1364/JOSA.52.001123 JOSAAH 0030-3941 Google Scholar
E. N. LeithJ. Upatnieks,
“Wavefront reconstruction with continuous tone objects,”
J. Opt. Soc. Am., 53
(12), 1377
–1381
(1963). http://dx.doi.org/10.1364/JOSA.53.001377 JOSAAH 0030-3941 Google Scholar
E. N. LeithJ. Upatnieks,
“Wavefront reconstruction with diffused illumination and three-dimensional objects,”
J. Opt. Soc. Am., 54
(11), 1295
–1301
(1964). http://dx.doi.org/10.1364/JOSA.54.001295 JOSAAH 0030-3941 Google Scholar
U. Schnars,
“Direct phase determination in hologram interferometry with use of digitally recorded holograms,”
J. Opt. Soc. Am. A, 11
(7), 2011
–2015
(1994). http://dx.doi.org/10.1364/JOSAA.11.002011 JOAOD6 0740-3232 Google Scholar
E. CucheP. MarquetC. Depeursinge,
“Spatial filtering for zero-order and twin-image elimination in digital off-axis holography,”
Appl. Opt., 39
(23), 4070
–4075
(2000). http://dx.doi.org/10.1364/AO.39.004070 APOPAI 0003-6935 Google Scholar
B. PeruchoV. Micó,
“Visualization of permanent marks in progressive addition lenses by digital in-line holography,”
Proc. SPIE, 8792 87921S
(2013). http://dx.doi.org/10.1117/12.2020541 PSISDG 0277-786X Google Scholar
A. Bogusz,
“Holoscopy and holoscopic principles,”
J. Opt., 20
(6), 281
–284
(1989). http://dx.doi.org/10.1088/0150-536X/20/6/005 JOOPDB 0150-536X Google Scholar
D. Hillmannet al.,
“Holoscopy: holographic optical coherence tomography,”
Opt. Lett., 36
(13), 2390
–2392
(2011). http://dx.doi.org/10.1364/OL.36.002390 OPLEDP 0146-9592 Google Scholar
D. Hillmannet al.,
“Efficient holoscopy image reconstruction,”
Opt. Express, 20
(19), 21247
–21263
(2012). http://dx.doi.org/10.1364/OE.20.021247 OPEXFF 1094-4087 Google Scholar
J. DiJ. ZhaoA. Asundi,
“Compact digital holoscope with dual wavelength,”
Proc. SPIE, 8559 855908
(2012). http://dx.doi.org/10.1117/12.2001862 PSISDG 0277-786X Google Scholar
M. BornE. Wolf, Principles of Optics, 7th ed.Cambridge University, Cambridge, United Kingdom
(1999). Google Scholar
B. Hennellyet al.,
“Review of twin reduction and twin removal techniques in holography,”
241
–245
(2009). Google Scholar
F. Duboiset al.,
“Focus plane detection criteria in digital holography microscopy by amplitude analysis,”
Opt. Express, 14
(13), 5895
–5908
(2006). http://dx.doi.org/10.1364/OE.14.005895 OPEXFF 1094-4087 Google Scholar
P. Gaoet al.,
“Autofocusing based on wavelength dependence of diffraction in two-wavelength digital holographic microscopy,”
Opt. Lett., 37
(7), 1172
–1174
(2012). http://dx.doi.org/10.1364/OL.37.001172 OPLEDP 0146-9592 Google Scholar
L. Yaroslavsky, Digital Holography and Digital Image Processing: Principles, Methods, Algorithms, Kluwer Academic Publishers, Boston
(2004). Google Scholar
L. Camachoet al.,
“Quantitative phase microscopy using defocusing by means of a spatial light modulator,”
Opt. Express, 18
(7), 6755
–6766
(2010). http://dx.doi.org/10.1364/OE.18.006755 OPEXFF 1094-4087 Google Scholar
A. AnandV. ChhaniwalB. Javidi,
“Quantitative cell imaging using single beam phase retrieval method,”
J. Biomed. Opt., 16
(6), 060503
(2011). http://dx.doi.org/10.1117/1.3589090 JBOPFO 1083-3668 Google Scholar
BiographyBeatriz Perucho received her MSc degree in optics and optometry from the Universitat de Valencia. Nowadays, she combines a job in an optician’s establishment with PhD duties. Her PhD interests are related with the design, development, and experimental validation of equipment for the inspection of optical components, such as ophthalmic lenses, contact lenses, and ocular structures based on digital holography. Vicente Micó received his MS degree in physics, his BS degree in optics and optometry, and PhD in physics from the Universitat de Valencia, where he currently holds a PhD assistant professor position. His research interests as a physicist are in optical metrology, speckle imaging, digital holographic microscopy, lensless imaging, and optical super-resolution. And as an optometrist, he is working in theoretical aspects on physiological and visual optics as well as in the development of novel optometric instruments. |


