
|
|
1.IntroductionThe study of the time course of a drug in the body is a key determinant in the selection of a drug candidate. In general, pharmacokinetic (PK) provides information that can guide future animals and clinical studies for the selection of the dose levels and frequency of administration. Multiple steps are involved in PK studies, e.g., formulation, animal dosing and sampling, sample processing and analysis, and PK regression and data reporting. Blood samples are collected at several time points, concluding at one predose and/or multiple postdoses. Reliable analytical methods [e.g., enzyme-linked immunosorbent assay (ELISA), size exclusion chromatography (SEC), high-performance liquid chromatography, liquid scintillation counting using nonlabeled or radiolabeled compounds] are required to quantify the drug concentration in the samples and sometimes need to be developed first. Following drug administration, the maximum observed concentration in the concentration–time profile () and the time to reach that peak-level () are important descriptors of the extent and nature of drug exposure. , an indicator of maximum drug exposure, may sometimes relate better to pharmacological or toxicological effects than the other measures of exposure. In the drug discovery setting, however, secondary or derived parameters such as half-life () or area under the curve (AUC) have increased practical importance. The half-life is generally used as a guide to determine the dose interval of a drug.1–3 The conventional PK studies use the dosing strategy of a single compound per animal to avoid potential problems of drug-drug interactions. In addition, the trauma associated with the frequent venipuncture and blood loss could be expected to cause adverse changes in physiology, which could interfere with the findings of the PK parameters. A full preclinical PK study typically takes 6–12 serial blood samples from 6 to 8 animals/compound, which therefore requires a minimum of 36 samples/study. Because of the lower blood sampling volume allowed in the mouse, a full PK study in mice often requires twice the number of animals over that in a rat PK study. Consequently, many efforts are undertaken to optimize the throughput of PK studies, e.g., cassette dosing4 and snapshot PK.5 For generating the PK profile, serum drug concentration is plotted versus time by interpolation of the single time point data to generate the AUC. Inappropriate selection of time points or missing serum samples may complicate the interpolation which may influence the accuracy of the PK analysis. Finally, the determination of PK drug characteristics is laborious and error-prone because the measurement of different time points cannot be made in the same animal. These problems may lead to misinterpretation of the time course of a drug in the body. Noninvasive imaging modalities such as positron emission tomography and single-photon emission computed tomography are applied in preclinical drug development to monitor the kinetics of drugs labeled with positron emitting radionuclides. Such studies have been extremely useful to ascertain their suitability as potential radiopharmaceuticals for humans, but are correlated with high costs, long acquisition times, and special safety requirements for working with radioactivity. Furthermore, the exact determination of kinetic parameters requires manual blood/tissue sampling for counting the radioactivity emitting from the blood and from the tissue lysates, which is still the reference method for tracer concentration measurements. Especially, blood/tumor ratios are constructed based on such imaging studies to reveal the kinetics of tumor targeting antibodies or new antibody constructs.6,7 Near-infrared (NIR) optical imaging is a noninvasive, nonionizing, and real-time modality that is emerging as a diagnostic tool for different in vivo and ex vivo applications.8–10 This technique offers a simplistic while highly sensitive approach for molecular imaging research in a manner analogous to traditional approaches with radiolabeled agents. Recent studies indicate that this approach is feasible to measure the organ specific uptake dynamics of indocyanine green (ICG) and to assess the liver function after transient damage.11 In this study, we applied optical imaging in the planar reflectance mode since the NIR excitation light can penetrate into the eye of an animal with low tissue absorption and light scattering and thus illuminates the highly vascularized retina of the eye. This direct and unrestricted access to the blood vessels offers the possibility to noninvasively measure the fluorescence intensity of labeled compounds over the time in the same animal. The combination of eye imaging with the whole body fluorescence imaging enables the simultaneous measurement of blood PKs, biodistribution, and accumulation of labeled compounds over the time in different region of interests (ROI). Measurements can be performed serially, thus giving the possibility of PK analysis with a temporal resolution in the order of seconds. By multiple measurements over the time period of 2 h “kinetic movies” can be created, facilitating the mathematical description of different PK parameters. We performed a feasibility study to visualize noninvasively drug peak-levels, half-life in blood, accumulation to organs and saturation kinetics by using fluorescence-labeled drugs. The utility of this approach is demonstrated by evaluating the four different fluorescent compounds. Data generated by this method reveal excellent concordance with results obtained with the classical methods of PKs. 2.Materials and Methods2.1.Compounds and LabelingICG, a nontargeting fluorescent dye was purchased from Sigma-Aldrich Chemie GmbH (Munich, Germany) and OsteoSense750, a fluorescence-labeled bisphosphonate targeting bone tissue was bought from PerkinElmer (Rodgau, Germany). Trastuzumab and the fragment of Trastuzumab were provided from Roche Diagnostics GmbH (Penzberg, Germany). Both compounds were labeled in-house with the fluorochromes Alexa750 (Invitrogen, Hamburg, Germany) by mono-reactive N-hydroxysuccinimide ester to lysine residues with a labeling ratio of 3 fluorochromes/molecule. Labeled compounds were purified by the dialysis and SEC, and afterward surface plasmon resonance analysis (BiaCore, LKB, Broma, Sweden) was performed to verify biological identity and binding characteristics. The results revealed no significant changes in the and constants and the resulting affinity between labeled and nonlabeled molecules. 2.2.AnimalsAll imaging experiments were performed in female severe combined immunodeficiency (SCID) hairless outbred (SHO) mice from Charles River, Germany (age: 6 to 8 weeks, weight: 20 to 25 g). The experimental study protocols were reviewed and approved by the local government. Mice were handled according to committed guidelines (GV-Solas; Felasa; TierschG) and the animal facility has been accredited by AALAAC. 2.3.In Vivo ImagingMice received inhalation anesthesia and the compounds were administered i.v. through a tail vein catheter. The eyes of the mice were covert with custom-made contact lenses to prevent desiccation. ICG was injected either with a single dose [ phosphate-buffered saline (PBS), ] and multiple injections of identical (, ) and escalating dosages (, , and , ). Fluorescence signal intensities (SIs) were recorded with a rate of over a 6 min time period (exposure time: 200 ms; excitation (ex.) filter: 710 to 760 nm; emission (em.) filter: 830 to 840 nm). OsteoSense750 was injected into an SHO mouse with a single dose of PBS and SIs were recorded every 5 s for 1.4 h (exposure time: 500 ms; ex. filter: 671 to 705 nm; em. filter: 770 to 780 nm). The Alexa750 labeled antibody Trastuzumab () and its fragment () were injected with a single dose of PBS. Due to the longer half-life of antibodies in mice, longer observation periods are required.12 Nevertheless, mice should not be held under anesthesia for and therefore was only acquired for 15 min (exposure time: 200 ms; ex. filter: 671 to 705 nm; em. filter: 770 to 780 nm). Thereafter, daily measurements were performed at different time points. Fluorescence SIs were monitored and analyzed with the MAESTRO imaging system (PerkinElmer, Rodgau, Germany). The measurements were started 10 s before compound injection and at the end of the study all acquired image cubes were spectrally unmixed. The measurement ROIs were set over specific areas of the animal and the average SIs were determined as scaled counts per second (sc/s). The first SI value received from the ROI of the eye which increased the background SI by 10-fold was defined as the zero point of the measurement. The acquired fluorescence SIs from the selected ROI were plotted over the time. 2.4.Blood Sampling and ELISA AnalysisAfter i.v. injection of the -Alexa750 fragment in naive SHO mice (), fluorescence in vivo imaging was performed at different time points and blood samples were taken immediately afterward at 3, 8, and 24 h, respectively, from all animals. Thereafter, a solid phase Sandwich-ELISA was used to determine the concentration of human -Alexa750 in mouse serum. The assay principle consists of the capture of the analyte by microtiter plate-bound antihuman kappa light chain Fab M-1.7.10 (Roche) and subsequent detection of the bound analyte by digoxigenylated antihuman CH1 domain Fab M-1.19.31 (Roche) which in turn is recognized by a horseradish peroxidase (HRP) labeled polyclonal antiDig antibody. The HRP of the polyclonal antibody catalyzes a color reaction of the substrate 2, 2'-azino-di(3-ethylbenzthiazoline-6-sulfonate). The color intensity is proportional to the concentration of the analyte. The dosing material of the human fragment was used for the preparation of calibration standards. The lower limit of quantification of the assay is . 3.Results3.1.Method Evaluation with ICGIn order to evaluate the application of eye imaging for PK studies, we measured the average SI of ICG noninvasively over the time. This molecule provides a short half-life and a fast clearance rate and is therefore eminently suitable for repeated applications in the same experimental animal. Data generated in an SHO mouse demonstrate that of ICG was reached 10 s after i.v. injection and the half-life of the SI was 1.2 min (Fig. 1 and Video 1). The received half-life result is in concordance with the published data.13,14 The reproducibility of this method was assessed by administering multiple injections of equal ICG dosages in short intervals in the same animal [Fig. 2(a) and Video 2]. The acquired average SI of the three repeated ICG applications revealed a nearly identical curve shape and only slight peak-level variations. The values are almost identical and were calculated to be 13 s (first application), 15 s (second application), and 15 s (third application), whereas the values for were 1.8, 2.2, and 2.5 min, respectively [Fig. 2(b)]. The continuously increasing half-life values may be attributed to the limited clearing capacity of the liver and the cumulative dose effect of the three applications leading to an accumulation of ICG in the blood. In a second study, we examined if the injection of escalating dosages of ICG correlated with increased fluorescence SIs in the eye [Fig. 3(a) and Video 3]. The maximum peak-levels of all three applications occurred after 3 s, however, the half-life was starting slightly to increase after the third ICG application (1.4, 1.3, and 1.6 min, respectively) [Fig. 3(b)], the latter indicating the same cumulative dose effect as mentioned before. The results of this experiment demonstrate a linear correlation between the administered compound concentration and their associated fluorescence SIs. Thus, different concentrations of a fluorescent compound can be distinguished by measuring the fluorescence intensity in the eye of a mouse. Fig. 1Noninvasive fluorescence monitoring in the eye of a SCID hairless outbred (SHO) mouse after a single i.v. injection of 10 µg indocyanine green (ICG). Images were recorded with a rate of 1 frame/s over a 6-min time period. (a) White light picture of the mouse head with the measurement region over the eye (inset yellow box). Snap shots of fluorescence images at indicated time points are shown to the left. All raw data images were converted into pseudocolor as shown in the color bar. (b) The diagram illustrates the curve shape of the average fluorescence signal intensity (SI) in the region of interest. The time to reach the maximum signal intensity ( = 10 s) and the half-life value of ICG ( = 1.2 min) was extracted from the diagram.  Video 1Monitoring the fluorescence signal intensity (SI) in the eye of a SCID hairless outbred (SHO) mouse after a single i.v. injection of 10 μg indocyanine green (ICG) (MPEG, 7.27 MB) [URL: http://dx.doi.org/10.1117/1.JBO.19.1.016022.1].  Fig. 2Noninvasive fluorescence monitoring in the eye of a SHO mouse after three repeated i.v. injections of 10 µg ICG. Images were recorded with a rate of 1 frame/s over a time period of 18 min. (a) White light picture of the mouse head with the measurement region over the eye (inset yellow box). Snap shots of fluorescence images at indicated time points after first, second, and third compound injections. All raw data images were converted into pseudocolor as shown in the color bar. (b) The diagram illustrates the curve shape of the average fluorescence SI in the selected ROI. The time to reach the maximum SI (: first = 13 s, second = 15 s, third = 15 s) and the half-life values (: first = 1.8 min, second = 2.2 min, third = 2.5 min) of the repeated ICG injections were extracted from the diagram. 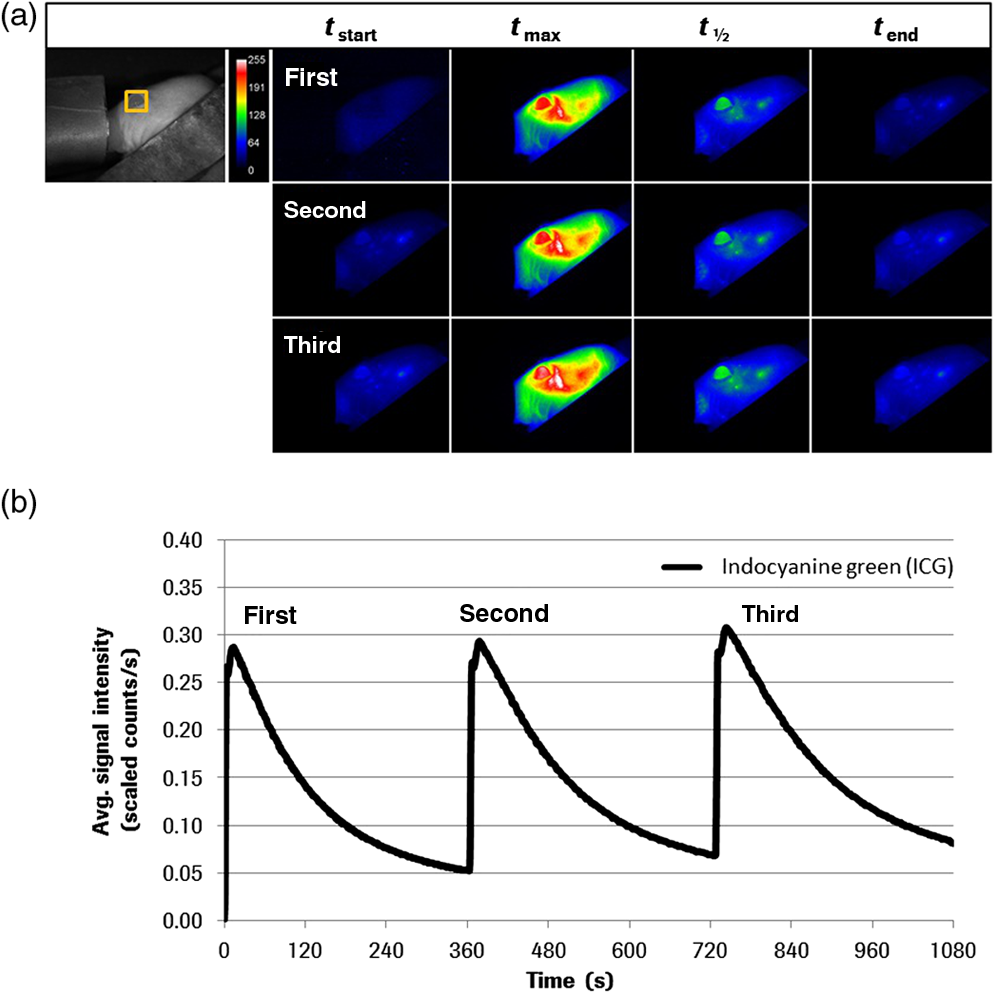 Video 2Monitoring the fluorescence SI in the eye of a SHO mouse after three repeated i.v. injections of 10 μg ICG (MPEG, 7.24 MB) [URL: http://dx.doi.org/10.1117/1.JBO.19.1.016022.2].  Fig. 3Noninvasive fluorescence monitoring in the eye of a SHO mouse after three cumulative dose injections of 5, 10 and 15 µg ICG. Images were recorded with a rate of 1 frame/s over an 18-min time period. (a) White light picture of the mouse head with the measurement region over the eye (inset yellow box). Snap shots of fluorescence images at indicated time points after first, second, and third compound injections. All raw data images were converted into pseudocolor as shown in the color bar. (b) The diagram illustrates the curve shape of the average fluorescent SI in the selected ROI. The time to reach the maximum SI ( : first = 3 s, second = 3 s, third = 3 s) and the half-life values (: first = 1.4 min, second = 1.3 min, third = 1.6 min) of the repeated ICG injections were extracted from the diagram.  Video 3Monitoring the fluorescence SI in the eye of a SHO mouse after three cumulative dose injections of 5, 10, and 15 μg ICG (MPEG, 7.13 MB) [URL: http://dx.doi.org/10.1117/1.JBO.19.1.016022.3]. 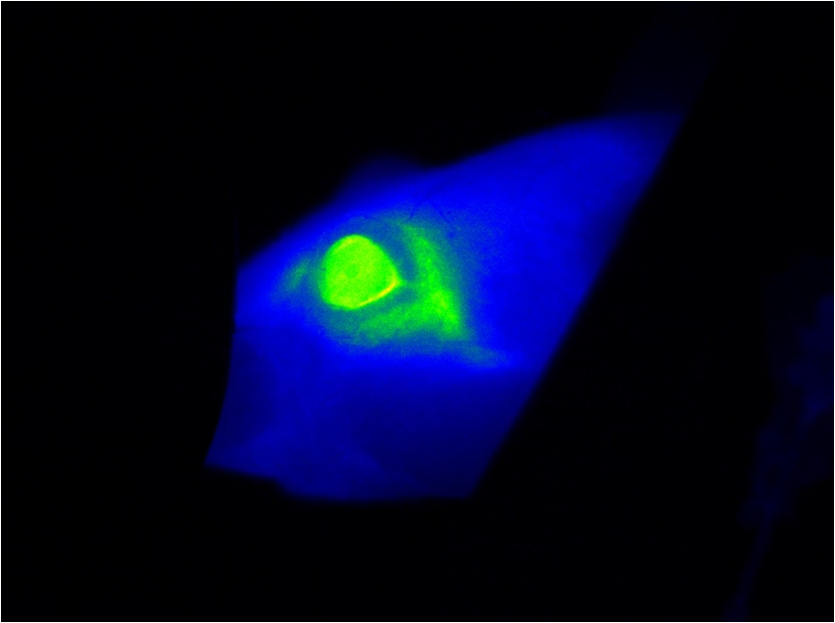 In addition to it, we examined if the PK measurements of ICG through the animal’s eye can be combined with the whole body fluorescence imaging. This approach would facilitate the simultaneous measurement of blood kinetics with biodistribution kinetics. For this experiment, a single SHO mouse was injected with PBS i.v. and the fluorescent signals were acquired in both eyes and the liver over the time period of 6 min [Fig. 4(a) and Video 4]. The results indicate an immediate increase followed by a sharp decline of the fluorescence SI in both eyes (left: , ; right: , ) [Fig. 3(b)]. The compound was cleared out of the blood stream and accumulated in the liver within 3 min (), as described in the literature.11,15 Fig. 4Noninvasive fluorescence monitoring in the eye and whole body of a SHO mouse after a single i.v. injection of 10 µg ICG. Images were recorded with a rate of 1 frame/s over a 6-min time period. (a) White light picture of the mouse with different measurement regions (right eye = yellow, left eye = blue, liver = red box). The two fluorescence images illustrate exemplarily the SI at 10 and 186 s after compound injection. All raw data images were converted into pseudocolor as shown in the color bar. (b) The diagram illustrates the curve shape of the average fluorescent SI in the different selected ROI. The time to reach the maximum SI and the corresponding half-life values of both eyes (left: = 9 s, = 1.3 min; right: = 7 s, = 1.2 min) and the liver ( = 186 s) were extracted from the diagram.  Video 4Monitoring the fluorescence SI in the eye and whole body of a SHO mouse after a single i.v. injection of 10 μg ICG (MPEG, 7.27 MB) [URL: http://dx.doi.org/10.1117/1.JBO.19.1.016022.4].  3.2.Method Evaluation with OsteoSense750The fluorescent-labeled bone targeting agent OsteoSense750 was also applied to evaluate the new eye imaging method. This molecule has already been used to examine osteoblastic activity in animal models.16 It has a half-life of 20 to 30 min in mice17 and rats,18 depending on the mode of application.19,20 The bone (tibia) contains the highest concentration of all the tissues examined and the remainder is excreted via the kidney.16,20 In contrast to the previous studies, our setup allows simultaneous semiquantitative measurement of blood level and bone uptake simultaneously. Both parameters were recorded over the time period of 1.4 h. The acquired distribution kinetic of OsteoSense750 demonstrates a transient accumulation in the kidneys and an immediate accumulation in the spine [Fig. 5(a)]. Based on the optical imaging measurements was determined to be 3.8 min and half-life in the blood was 34 min [Fig. 5(b)]. These results correlate with the published data.17,18 A final image, taken 24 h after the i.v. injection of the compound, showed a strong fluorescence signal in spine, right and left femur, scapula, ribs, and in the knees [Fig. 5(a)]. Fig. 5Noninvasive fluorescence monitoring in the eye and whole body of a SHO mouse after a single i.v. injection of 2 nMol OsteoSence750. Images were recorded with a rate of 1 frame/s over a time period of 83 min. (a) White light picture of the mouse with the measurement region over the eye (inset yellow box). Snap shots of fluorescence images at indicated time points demonstrating fluorescence signals in the kidneys (at ) and subsequently accumulation in bone tissue (at and ). After 24 h of incubation the postmortem image () demonstrates specific accumulation of the bone targeting agent in spine, femur, scapula, ribs and knees (skin was removed). All raw data images were converted into pseudocolor as shown in the color bar. (b) The diagram illustrates the curve shape of the average fluorescence SI in the ROI. The time to reach the maximum SI ( = 3.8 min) and the half-life value of OsteoSense750 ( = 34 min) were extracted from the diagram.  3.3.Evaluation with Trastuzumab-Alexa750Beside the application of small molecules for method evaluation, we also noninvasively investigated the PK behavior of the labeled therapeutic antibody Trastuzumab by eye imaging. Therefore, Alexa750-labeled Trastuzumab was injected in an SHO mouse and monitored over time [Fig. 6(a)]. The fluorescence SIs reached the maximum after 6 s and antibody half-life was 2.5 days [Fig. 6(b)], which is comparable to conventionally acquired and published values.12,21 Fig. 6Noninvasive fluorescence monitoring of blood drug levels in the eye and whole body biodistribution kinetics in a SHO mouse after a single i.v. injection of 50 µg Trastuzumab-Alexa750. Images were recorded with a rate of 1 frame/s over a 15-min time period. Thereafter, daily single measurements were performed for seven time points. (a) White light picture of the mouse with the ROI over the eye (inset yellow box). Snap shots of fluorescence images at indicated time points demonstrating antibody injection, distribution, accumulation and clearance. All raw data images were converted into pseudocolor as shown in the color bar. (b) The diagram illustrates the curve shape of the average fluorescence intensity in the ROI. The maximum SI of Trastuzumab-Alexa750 was reached 6 s after compound injection and half-life was 2.5 days.  3.4.Evaluation with the -Alexa750 Fragment of TrastuzumabHaving confirmed the correspondence between classical PK measurements and fluorescence imaging for ICG, OsteoSence, and Trastuzumab, we further evaluated the fragment of Trastuzumab in more detail. This study was prioritized because antibody fragments are considered to penetrate tumor tissue more easily and thus represent optimal targeting moieties.22,23 In addition, a direct comparison of the half-life between the eye imaging method and the “gold standard” of blood sampling analysis was performed. The -Alexa750 was injected i.v. into SHO mice () and the fluorescence intensities were measured in the eye over time. The imaging results showed a high measurement reproducibility between the individual animals and also a low standard deviation for all time points [Figs. 7(a) and 7(b)]. The determined half-life of the labeled compound was 8.3 h, which is in accordance with the published data.24 Furthermore, the direct comparison of the fluorescence SIs from eye imaging and the analyzed protein concentration in the blood (performed by ELISA), revealed a strong linear relationship [Fig. 7(c)]. Linear regression analysis between three measurement time points of both techniques (3, 8, and 24 h after compound injection) resulted in a square correlation coefficient of . Fig. 7Noninvasive fluorescence monitoring in the eye of SHO mice (n = 8) after a single i.v. injection (50 µg/ 100 µl) of the Alexa750 labeled fragment of Trastuzumab. Images were recorded 5 min, 0.5, 1, 3, 8, 24 and 48 h after compound injection. Blood samples from all animals were selected at 3, 8, and 24 h and analyzed by enzyme-linked immunosorbent assay. (a) The diagram illustrates the curve shape of the average fluorescence SIs from the different eye measurement regions. The time to reach the maximum SI () and the half-life value of -Alexa750 () were extracted from the diagram. (b) Blow-up of the diagram from (a) showing the early measurement time points in more detail. (c) The diagram illustrates direct comparison between the -Alexa750 SI received from eye imaging and its associated protein concentration in the blood. Linear regression analysis between of both measurement values resulted in a square correlation coefficient of . 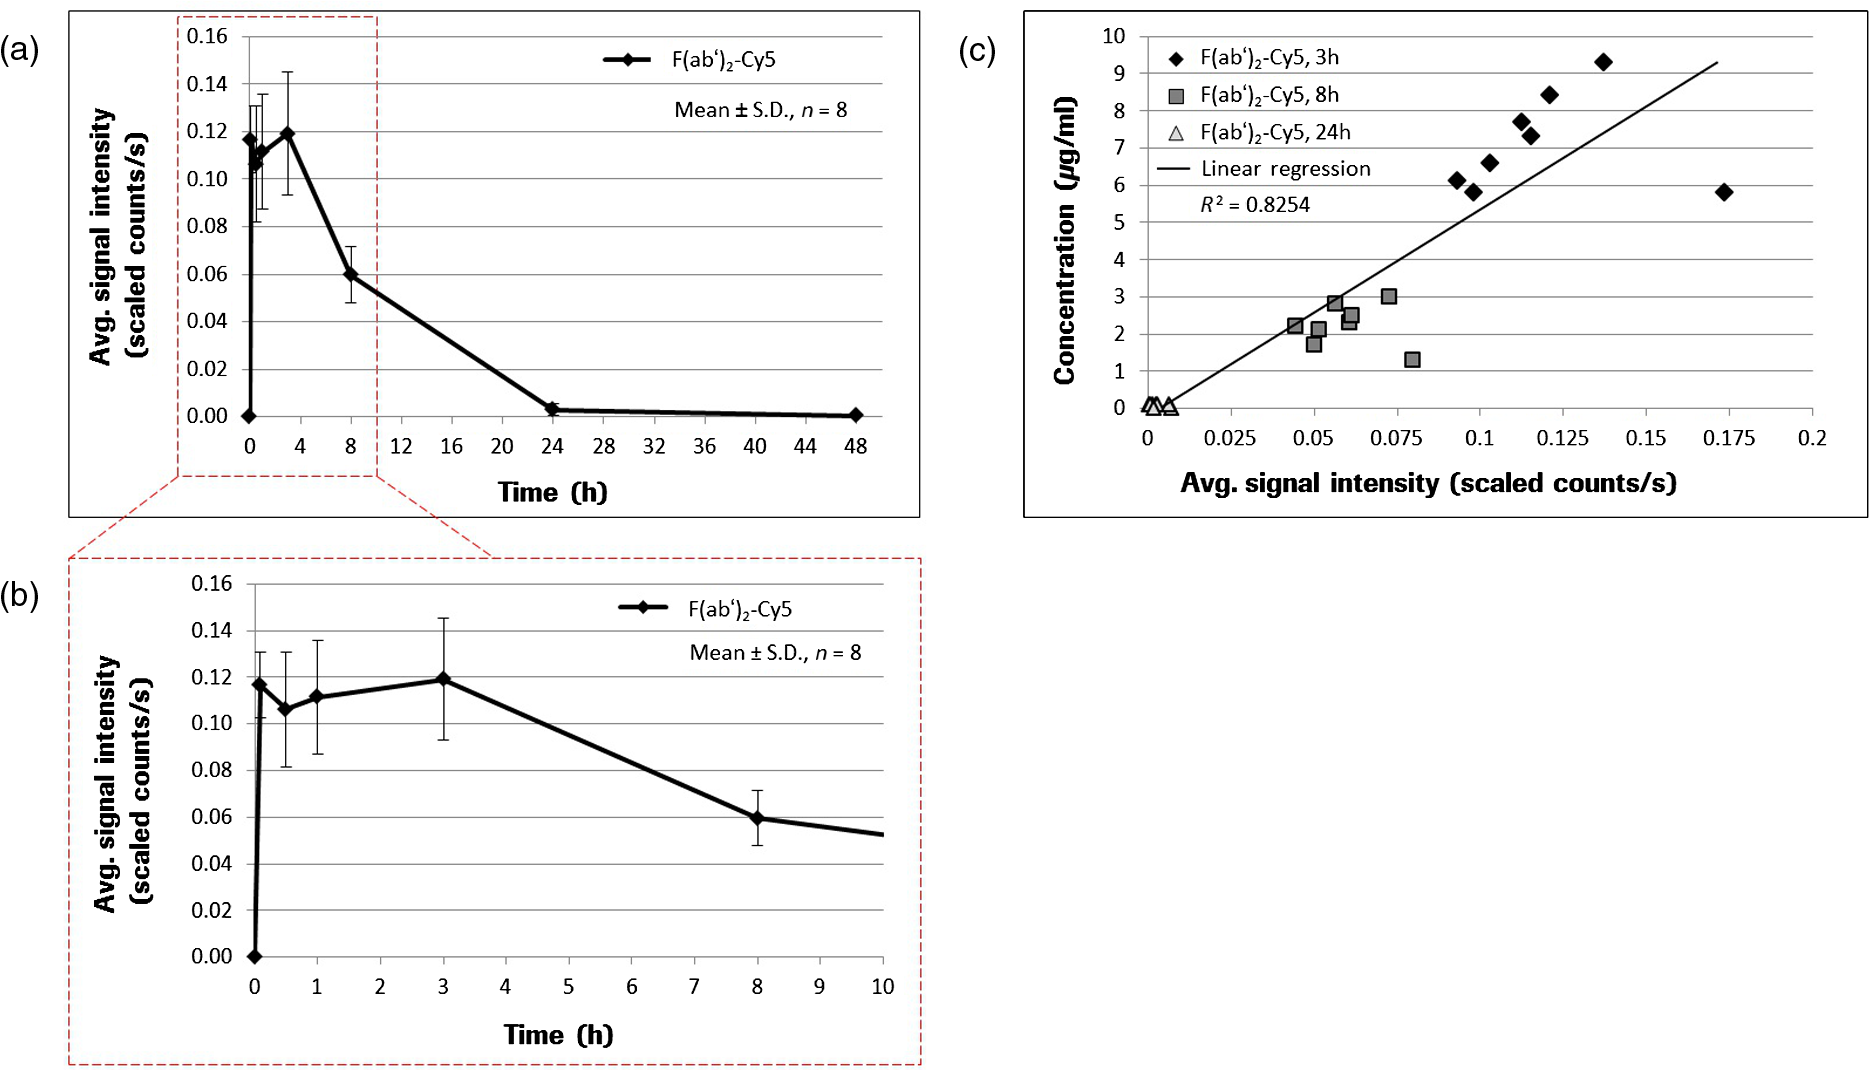 4.DiscussionWe evaluated the application of NIR fluorescence eye imaging for the noninvasive estimation of PK parameters. This new approach was validated with four different compounds, including: ICG, OsteoSense750, Trastuzumab-Alexa750, and the Alexa750 labeled fragment of Trastuzumab. The results demonstrate that the PK parameters, such as and , can easily be determined by measuring the fluorescence SIs in the eyes of anesthetized mice. The half-life values of the different fluorescent compounds are in accordance with the published data12–14,17,18,21 and thus indicate that the noninvasive fluorescence eye imaging method provides reliable data. Furthermore, half-life values received from the fluorescence imaging were compared with the conventional serum analytics by ELISA. We found that the eye fluorescence SIs directly relate to the compound concentration in the blood (). An important aspect that may have influenced the measuring reproducibility of the performed imaging experiments and might cause the differences between the obtained and values is the manual compound injection. The usage of an automatic injection device will standardize compound application and therefore reduce the measurement variations to a minimum and further improve the imaging results. This optical imaging method has multiple advantages compared to the conventional PK and biodistribution assay techniques. Manual labor and required time for sample analysis are significantly reduced, mixing up of blood samples is prevented, and the use of nonradioactive materials permits further analysis by routine laboratory methods without the precautions needed with radiochemicals. Furthermore, the number of animals required is significantly reduced and animal bleeding is not necessary anymore, resulting in improved animal conditions following the 3R principle of animal testing. Since animals do not need to be sacrificed, multiple applications of the same and/or another compound (labeled with a fluorochrome possessing emission spectra different from the first one) can be applied to get insights on drug-drug interactions. The optimal dosages and treatment schedules can be found for i.v., i.p., oral, inhalation, nasal, and dermal applications of drugs in wild type and in genetically engineered preclinical models (e.g., FcRn knock-outs or mice with huFcRn). In addition to and , organ distribution of new compounds can be analyzed simultaneously. Such measurements can provide new insights regarding the time courses of blood clearance and migration to target organs. The semiquantitative information about the location and concentration of labeled substances in the body can be obtained as a function of time, thereby enabling a more profound understanding of its biological effects. This information is crucial to the design of optimized delivery systems and new drugs. Antibodies that target cellular surface antigens have complex kinetics. When antigen expression is high, half-life is short because the antibody is rapidly cleared from the blood stream through antigen-mab interactions. When the antigen is depleted, clearance decreases and half-life is consequently prolonged. As the antibody accumulates, a new steady state is reached. Therefore, it is of interest to (i) perform PK studies in xenografts (not only in tumor-free mice) and (ii) quantify antibody concentration in the blood and in the target tissue to clarify the association between tumor burden/target expression and saturation kinetics with serum/plasma kinetics.25–27 Knowledge of these parameters (measured simultaneously) would provide a more comprehensive data basis for PK–PD modeling which has become an integral part of the preclinical and clinical developments of protein drugs.28–30 In addition, combined measurement of PK and target saturation supports strategies to modify serum half-life of therapeutic proteins. In such cases where the clearance of drugs from the specific tissue/organ is fast, conventional techniques cannot catch up with its dynamic changes. Therefore, a noninvasive in vivo real-time imaging modality for protein drugs in biological matrices like the method described here will timely meet the needs and expedite the step of protein drug development. Furthermore, new antibody formats,31–33 glycoengineered antibodies,33 and antibody drug conjugates34 can be easily labeled with a fluorochrome and thus can also be examined with our method. However, before performing any in vivo studies with labeled drugs, functional assays must demonstrate that there is no difference in the binding constants and biological effects compared to the nonlabeled substance. For compounds where the labeling with fluorochromes may interfere with the biological characteristics (e.g., receptor binding), optical imaging cannot be applied for assessing PK and biodistribution. Although planar reflectance optical imaging is associated with the limited tissue penetration, scattering of the emitted fluorescence and the different optical properties of the tissue, such measurements still allow a semi-quantify assessment and thus, facilitate the selection of the most appropriate time points for taking serum and tissue explantation. With the advent of tomographic optical systems35 or the combination with CT, such problems can be circumvented and will subsequently improve PK studies using whole body optical imaging.36,37 Such hybrid systems will also facilitate studies aiming to address the target mediated clearance and penetration of targeting antibodies into tumor tissue.30,38,39 The noninvasive measurement of PK parameters by eye imaging provides the possibility to understand PK and PD properties of drugs in a better way. Since fluorescent-labeled compounds (ICG) are already approved as diagnostic markers in humans, there are no restrictions to use our imaging method in a clinical setting. The preclinical to clinical transfer of such biological information and pharmacological data would enhance the drug discovery and development process and can have profound implications on the drug approval process, reducing time, cost, and failure rates in later-stage clinical trials.40,41 5.ConclusionsWe describe a new noninvasive optical imaging method that allows monitoring the drug levels in blood and organ distribution simultaneously in mice over the time. We demonstrated the utility of this approach by evaluating four different compounds, including: (i) ICG, a fluorescent dye; (ii) OsteoSence750, a fluorescence-labeled bisphosphonate targeting bone tissue; (iii) Alexa750 labeled Trastuzumab; and (iv) Alexa750 labeled fragment of Trastuzumab. Our results demonstrate that and can be easily acquired by measuring the fluorescence SIs in the eyes of anesthetized animals. In contrast to the conventional techniques, this new approach improves the performance of PK studies since quantification of the drug in serum probes and data interpolation between time points is not necessary. Furthermore, the number of required mice is significantly reduced and mice do not need to be sacrificed. Whole body planar reflectance optical imaging, besides its limitations, can be applied to get information regarding the distribution of labeled drugs and its accumulation in target tissue. For drugs that do not emit fluorescence by themselves, labeling with an appropriate fluorescence dye can easily be done. However, initiation of such studies is only justified if biological identity (no difference between labeled and nonlabeled drugs) has been demonstrated. Optimization of hardware and software components in combination with the new fluorescent probes may allow this technology to be applicable in the clinical situation. AcknowledgmentsThe authors wish to express their gratitude to A. Wessner for fluorescence labeling of Trastuzumab, U. Jucknischke for performing the Biacore studies, and U. Haupt for cell culturing and mice handling. The constant support of R. Vogel, C. Klein, and M. Weidner and especially of C. Meisel and K. Bosslet is very much appreciated. This work is dedicated to our colleague Steffen Strobel who died from the consequences of an accident after the finalization of the manuscript. Competing interest statement: All authors are employees of Roche Diagnostics GmbH, Germany. ReferencesG. R. JangR. Z. HarrisD. T. Lau,
“Pharmacokinetics and its role in small molecule drug discovery research,”
Med. Res. Rev., 21
(5), 382
–396
(2001). http://dx.doi.org/10.1002/(ISSN)1098-1128 MRREDD 1098-1128 Google Scholar
S. A. Roberts,
“Drug metabolism and pharmacokinetics in drug discovery,”
Curr. Opin. Drug Discovery Dev., 6
(1), 66
–80
(2003). CODDFF 2040-3437 Google Scholar
L. A. WittenburgD. L. Gustafson,
“Optimizing preclinical study design in oncology research,”
Chem.-Biol. Interact., 190
(2–3), 73
–78
(2011). http://dx.doi.org/10.1016/j.cbi.2011.01.029 CBINA8 0009-2797 Google Scholar
R. E. WhiteP. Manitpisitkul,
“Pharmacokinetic theory of cassette dosing in drug discovery screening,”
Drug Metab. Dispos., 29
(7), 957
–966
(2001). DMDSAI 0090-9556 Google Scholar
B. Liuet al.,
“Snapshot PK: a rapid rodent in vivo preclinical screening approach,”
Drug Discovery Today, 13
(7–8), 360
–367
(2008). http://dx.doi.org/10.1016/j.drudis.2007.10.014 DDTOFS 1359-6446 Google Scholar
L. Convertet al.,
“A new tool for molecular imaging: the microvolumetric beta blood counter,”
J. Nucl. Med., 48
(7), 1197
–1206
(2007). http://dx.doi.org/10.2967/jnumed.107.042606 JNMEAQ 0161-5505 Google Scholar
H. DingF. Wu,
“Image guided biodistribution and pharmacokinetic studies of theranostics,”
Theranostics, 2
(11), 1040
–1053
(2012). http://dx.doi.org/10.7150/thno.4652 THERDS 1838-7640 Google Scholar
J. V. Frangioni,
“In vivo near-infrared fluorescence imaging,”
Curr. Opin. Chem. Biol., 7
(5), 626
–634
(2003). http://dx.doi.org/10.1016/j.cbpa.2003.08.007 COCBF4 1367-5931 Google Scholar
F. Leblondet al.,
“Pre-clinical whole-body fluorescence imaging: review of instruments, methods and applications,”
J. Photochem. Photobiol. B, 98
(1), 77
–94
(2010). http://dx.doi.org/10.1016/j.jphotobiol.2009.11.007 JPPBEG 1011-1344 Google Scholar
S. A. HilderbrandR. Weissleder,
“Near-infrared fluorescence: application to in vivo molecular imaging,”
Curr. Opin. Chem. Biol., 14
(1), 71
–79
(2010). http://dx.doi.org/10.1016/j.cbpa.2009.09.029 COCBF4 1367-5931 Google Scholar
C. B. Amoozegaret al.,
“Dynamic contrast-enhanced optical imaging of in vivo organ function,”
J. Biomed. Opt., 17
(9), 096003
(2012). http://dx.doi.org/10.1117/1.JBO.17.9.096003 JBOPFO 1083-3668 Google Scholar
D. G. Covellet al.,
“Pharmacokinetics of monoclonal immunoglobulin G1, , and Fab′ in mice,”
Cancer Res., 46
(8), 3969
–3978
(1986). CNREA8 0008-5472 Google Scholar
T. DesmettreJ. M. DevoisselleS. Mordon,
“Fluorescence properties and metabolic features of indocyanine green (ICG) as related to angiography,”
Surv. Ophthalmol., 45
(1), 15
–27
(2000). http://dx.doi.org/10.1016/S0039-6257(00)00123-5 SUOPAD 0039-6257 Google Scholar
V. SaxenaM. SadoqiJ. Shao,
“Polymeric nanoparticulate delivery system for indocyanine green: biodistribution in healthy mice,”
Int. J. Pharm., 308
(1–2), 200
–204
(2006). http://dx.doi.org/10.1016/j.ijpharm.2005.11.003 IJPHDE 0378-5173 Google Scholar
G. Paumgartner,
“The handling of indocyanine green by the liver,”
Schweiz. Med. Wochenschr., 105
(17 Suppl.), 1
–30
(1975). SMWOAS 0036-7672 Google Scholar
A. Zaheeret al.,
“In vivo near-infrared fluorescence imaging of osteoblastic activity,”
Nat. Biotechnol., 19
(12), 1148
–1154
(2001). http://dx.doi.org/10.1038/nbt1201-1148 NABIF9 1087-0156 Google Scholar
P. T. Daley-YatesR. Bennett,
“A comparison of the pharmacokinetics of 14C-labelled APD and 99mTc-labelled APD in the mouse,”
Calcif. Tissue Int., 43
(2), 125
–127
(1988). http://dx.doi.org/10.1007/BF02555158 CTINDZ 0171-967X Google Scholar
M. PongchaidechaP. T. Daleyyates,
“Clearance and tissue uptake following 4-hour and 24-hour infusions of pamidronate in rats,”
Drug Metab. Dispos., 21
(1), 100
–104
(1993). DMDSAI 0090-9556 Google Scholar
A. Hoffmanet al.,
“Mode of administration-dependent pharmacokinetics of bisphosphonates and bioavailability determination,”
Int. J. Pharm., 220
(1–2), 1
–11
(2001). http://dx.doi.org/10.1016/S0378-5173(01)00654-8 IJPHDE 0378-5173 Google Scholar
D. Kumaret al.,
“Evaluation of biodistribution by local versus systemic administration of Tc-99m-labeled pamidronate,”
J. Orthop. Sci., 11
(5), 512
–520
(2006). http://dx.doi.org/10.1007/s00776-006-1046-5 JOSCFS 0949-2658 Google Scholar
G. Pavlinkovaet al.,
“Pharmacokinetics and biodistribution of engineered single-chain antibody constructs of MAb CC49 in colon carcinoma xenografts,”
J. Nucl. Med., 40
(9), 1536
–1546
(1999). JNMEAQ 0161-5505 Google Scholar
G. P. Adamset al.,
“Prolonged in vivo tumour retention of a human diabody targeting the extracellular domain of human HER2/neu,”
Br. J. Cancer, 77
(9), 1405
–1412
(1998). http://dx.doi.org/10.1038/bjc.1998.233 BJCAAI 0007-0920 Google Scholar
U. B. Nielsenet al.,
“Targeting of bivalent anti-ErbB2 diabody antibody fragments to tumor cells is independent of the intrinsic antibody affinity,”
Cancer Res., 60
(22), 6434
–6440
(2000). CNREA8 0008-5472 Google Scholar
H. Sakaharaet al.,
“Radioimmunoimaging using fragment of monoclonal antibodies against human alpha-fetoprotein,”
Kaku Igaku, 22
(3), 377
–382
(1985). KAIGBZ 0022-7854 Google Scholar
D. Daydeet al.,
“Tumor burden influences exposure and response to rituximab: pharmacokinetic-pharmacodynamic modeling using a syngeneic bioluminescent murine model expressing human CD20,”
Blood, 113
(16), 3765
–3772
(2009). http://dx.doi.org/10.1182/blood-2008-08-175125 BLOOAW 0006-4971 Google Scholar
K. McLartyet al.,
“Associations between the uptake of (111)In-DTPA-Trastuzumab, HER2 density and response to trastuzumab (Herceptin) in athymic mice bearing subcutaneous human tumour xenografts,”
Eur. J. Nucl. Med. Mol. Imaging, 36
(1), 81
–93
(2009). http://dx.doi.org/10.1007/s00259-008-0923-x EJNMA6 1619-7070 Google Scholar
B. A. PloegerP. H. van der GraafM. Danhof,
“Incorporating receptor theory in mechanism-based pharmacokinetic-pharmacodynamic (PK-PD) modeling,”
Drug Metab. Pharmacokinet., 24
(1), 3
–15
(2009). http://dx.doi.org/10.2133/dmpk.24.3 DMPRB8 1347-4367 Google Scholar
L. K. Roskoset al.,
“PK-PD modeling of protein drugs: implications in assay development,”
Bioanalysis, 3
(6), 659
–675
(2011). http://dx.doi.org/10.4155/bio.11.28 BIOAB4 1757-6180 Google Scholar
R. E. Kontermann,
“Strategies to extend plasma half-lives of recombinant antibodies,”
Biodrugs, 23
(2), 93
–109
(2009). http://dx.doi.org/10.2165/00063030-200923020-00003 BIDRF4 1173-8804 Google Scholar
W. WangE. Q. WangJ. P. Balthasar,
“Monoclonal antibody pharmacokinetics and pharmacodynamics,”
Clin. Pharmacol. Ther., 84
(5), 548
–558
(2008). http://dx.doi.org/10.1038/clpt.2008.170 CLPTAT 0009-9236 Google Scholar
P. HolligerP. J. Hudson,
“Engineered antibody fragments and the rise of single domains,”
Nat. Biotechnol., 23
(9), 1126
–1136
(2005). http://dx.doi.org/10.1038/nbt1142 NABIF9 1087-0156 Google Scholar
A. L. Nelson,
“Antibody fragments hope and hype,”
Multi-Agent-Based Simul., 2
(1), 77
–83
(2010). http://dx.doi.org/10.4161/mabs 1942-0862 Google Scholar
T. A. Millwardet al.,
“Effect of constant and variable domain glycosylation on pharmacokinetics of therapeutic antibodies in mice,”
Biologicals, 36
(1), 41
–47
(2008). http://dx.doi.org/10.1016/j.biologicals.2007.05.003 BILSEC 1045-1056 Google Scholar
E. R. Boghaertet al.,
“Determination of pharmacokinetic values of calicheamicin-antibody conjugates in mice by plasmon resonance analysis of small (5 mu l) blood samples,”
Cancer Chemother. Pharmacol., 61
(6), 1027
–1035
(2008). http://dx.doi.org/10.1007/s00280-007-0560-2 CCPHDZ 0344-5704 Google Scholar
K. O. VasquezC. CasavantJ. D. Peterson,
“Quantitative whole body biodistribution of fluorescent-labeled agents by non-invasive tomographic imaging,”
PLoS One, 6
(6), e20594
(2011). http://dx.doi.org/10.1371/journal.pone.0020594 1932-6203 Google Scholar
A. Aleet al.,
“FMT-XCT: in vivo animal studies with hybrid fluorescence molecular tomography-X-ray computed tomography,”
Nat. Methods, 9
(6), 615
–620
(2012). http://dx.doi.org/10.1038/nmeth.2014 1548-7091 Google Scholar
S. Kunjachanet al.,
“Noninvasive optical imaging of nanomedicine biodistribution,”
ACS Nano, 7
(1), 252
–262
(2013). http://dx.doi.org/10.1021/nn303955n 1936-0851 Google Scholar
M. A. TabriziC. M. L. TsengL. K. Roskos,
“Elimination mechanisms of therapeutic monoclonal antibodies,”
Drug Discovery Today, 11
(1–2), 81
–88
(2006). http://dx.doi.org/10.1016/S1359-6446(05)03638-X DDTOFS 1359-6446 Google Scholar
G. M. ThurberM. M. SchmidtK. D. Wittrup,
“Factors determining antibody distribution in tumors,”
Trends Pharmacol. Sci., 29
(2), 57
–61
(2008). http://dx.doi.org/10.1016/j.tips.2007.11.004 TPHSDY 0165-6147 Google Scholar
A. E. Spinelliet al.,
“Optical imaging of radioisotopes: a novel multimodal approach to molecular imaging,”
Q. J. Nucl. Med. Mol. Imaging, 56
(3), 280
–290
(2012). 1824-4785 Google Scholar
Q. ZhouJ. M. Gallo,
“The pharmacokinetic/pharmacodynamic pipeline: translating anticancer drug pharmacology to the clinic,”
AAPS J., 13
(1), 111
–120
(2011). http://dx.doi.org/10.1208/s12248-011-9253-1 AJAOB6 1550-7416 Google Scholar
|


