
|
|
1.IntroductionData have been published reporting that bacteriophage M13, Tobacco mosaic virus (TMV), human papillomavirus, human immunodeficiency virus, Escherichia coli (E. coli), and a tissue culture line of human T-lymphocytes (Jurkatt) can be inactivated by irradiation with 80-fs pulses of 425- or 850-nm laser radiation.1–3 The mechanism of interaction between the biomolecules and the ultrashort laser pulses is postulated to be impulse stimulated Raman scattering (ISRS).4 The reported inactivation effect correlates strongly with pulse duration and the associated peak irradiance () of the source laser, but is basically independent of laser emission wavelength, in the visible and near-infrared wavebands, and pulse repetition frequency. Inactivation data show a distinct threshold, and inactivation irradiances were found to roughly increase with the molecular size of the target. The initial hypothesis regarding the inactivation mechanism was related to the breaking of covalent bonds in proteins and/or phospholipids.1,2 The postulated mechanism was absorption of photon energy by covalent bonds, which caused increased vibrational stretching, ultimately leading to the breaking of bonds. However, subsequent results obtained by those authors have led to a new hypothesis that involves disruption of hydrogen bonding and/or hydrophobic interactions.3 Hydrogen bonds do not break like covalent bonds, and they can spontaneously reform following disruption so long as hydrophilic and hydrophobic interactions hold the macromolecule in the proper conformation. In this regard, there are reports in the literature of increased DNA transfection efficiencies in tissue culture cells in vitro and solid tumors in situ with exposures to femtosecond laser pulses.5,6 Since this phenomenon is thought to occur by forming pores in the cell’s plasma membrane, disruption of hydrophobic interactions between membrane phospholipids could conceivably account for these observations but would be nearly impossible to distinguish from denaturation of integral membrane proteins, which could, in principle, lead to the same results. Thus, the competing mechanism(s) of photon interaction, one leading to biological inactivation and the other to membrane pore formation that does not cause inactivation, remain unsettled. Nevertheless, as a potential mechanism of virus bioinactivation, interaction with membrane phospholipids is problematic. Some eukaryotic cell viruses have membranes surrounding the protein capsid that are derived from the host plasma membrane.7 However, neither TMV (a eukaryotic cell RNA virus) nor the M13 bacteriophage (prokaryotic cell DNA virus), the two strains used in the initial experiments, have phospholipid membranes around the capsid. Both are simply a strand of nucleic acid wrapped in proteins held together by noncovalent interactions. In the published data, isolated, pure cultures of M13 and TMV were exposed to the laser pulses followed by viability measurements based upon infecting and replicating in the host cells. Since the laser exposures occurred outside the host, there was no opportunity for ISRS interaction with phospholipids to affect their viability. Therefore, it seems unlikely that the mechanism of bioinactivation has anything to do with phospholipid membranes. It is interesting to note that nucleic acids were never postulated as the ISRS target even though these molecules contain essentially the same chemical bonds as proteins and phospholipids, experience hydrophobic interactions, form hydrogen bonds, are present in all living organisms (bacteriophage do not have phospholipid membranes), and are well-known targets for cell lethality following exposure to ultraviolet (UV) radiation, ionizing radiation, and chemicals. This observation, along with decades of historical precedence in the field of radiation biology, led us to hypothesize that bioinactivation occurred as a result of interaction with the DNA or proteins.8,9 2.Methods2.1.MicroorganismsM13 bacteriophage (phage) and its recommended host, E. coli, were purchased from the American Type Culture Collection (ATCC 15669-B1 and ATCC 15669, respectively) as lyophilized powders. Cultures of the organisms were initiated, maintained, and stored according to the instructions provided by ATCC. Tryptone broth was used as the bacteria growth medium. Overnight cultures of bacteria were always used for experiments, and bacteria were stored in tryptone broth at 4°C between experiments. M13 stocks were established and propagated using both a liquid culture method and a soft agar culture method with similar results. Since the liquid method was simpler, it was used. To create M13 stocks, 1 ml of broth was used to hydrate the lyophilized organisms received from ATCC. This 1 ml of broth and 0.1 ml of E. coli from an overnight culture were added to 7 ml of broth in a tube, and the combined culture was then incubated overnight at 37°C on a rotary shaker. The next day, a 2-ml aliquot of this culture was used to inoculate each of four 500-ml bottles of growth media, which were then incubated overnight at 37°C on a rotary shaker. M13 were isolated from these co-cultures by centrifuging at 7000 rpm for 20 min to pellet the bacteria, collecting the supernatant, and then vacuum filtering the supernatant through a 0.22-μm filter to remove any remaining bacteria. To reduce the volume of the M13 stock, the filtrate was then filtered again by centrifugation through a 100 K molecular weight cutoff spin-filter (Millipore) to collect the M13. The M13 stock suspension was then prepared by washing phage off the filter with Dulbecco’s phosphate buffered saline (PBS). This procedure produced of stock M13 suspension, with plaque forming units (pfu) per ml. Stocks were stored at 4°C until used. 2.2.DNA ElectrophoresisChanges in the size of DNA were measured using agarose gel electrophoresis (AGE). DNA from treated and control M13 was extracted from 100 μl of phage suspension ( to ) with 1 ml of TRIZOL (Sigma, St. Louis, Missouri). After precipitating the DNA by addition of 1.6 ml of ethanol, the DNA was dissolved in 25 μl of Tris-ethylenediamine tetra-acetic acid (TE) buffer ( EDTA, pH 8) and heated at 65°C for 30 min. Aliquots of the M13 DNA were analyzed by electrophoresis (30 min at 100 V) on a 1.2% agarose gel in Tris-acetate-EDTA buffer (40 mM Tris-acetate and 1 mM EDTA, pH 8.3). DNA bands were visualized and photographed under UV illumination with a Versa-Doc imaging system after staining with either ethidium bromide (Sigma) in PBS or a dilution of SYBR® Gold (Life Technologies, Frederick, Maryland) in TE buffer. The pUC19 plasmid is a transfection vector initially fabricated in the early 1980s.10 The pUC19 is a circular, double-stranded piece of DNA. When not undergoing replication, the normal state of a pUC19 plasmid is a closed-loop supercoil. The supercoiled pUC19 DNA will unwind into an open-loop structure in response to just one single-strand break (SSB), so it is an extremely sensitive assay for DNA damage. Because of its very compact shape, the supercoil runs farther in the gel than the open-loop conformation. Therefore, if one creates one or more SSB in the pUC19 supercoil, the top band (open loop) increases in intensity and the lower band (supercoil) decreases in intensity. The present experiments employed an E. coli strain (JM109) that carries this plasmid, which exists in a high copy number in the host and can be positively selected using ampicillin resistance. The pUC19 plasmid DNA was isolated from overnight cultures of JM109 using a High-Speed Plasmid Maxi Kit #12662 (Qiagen, Waltham, Massachusetts). In preparing to extract pUC19 plasmids, overnight cultures of JM109 were grown in Luria broth containing of ampicillin. Following the instructions in the Quiagen kit, pUC19 samples with DNA concentrations were routinely obtained from the overnight cultures. 2.3.Protein ElectrophoresisChanges in protein molecular weight were assessed using sodium dodecyl sulfate polyacrylamide gel electrophoresis (SDS-PAGE). To prepare M13 phage proteins, the required volume of phage suspension was denatured by adding 3 volumes of SDS disruption buffer (250 mM Tris-hydrochloride, pH 6.8, 4% sodium dodecylsulfate, 20% glycerol, 2% -mercaptoethanol, 0.002% bromphenol blue) and heating at 95°C for 10 min. Each lane of a gel was loaded with 20 μg of coat protein. Bovine serum albumin (BSA, DNase, RNase, and protease free, Fraction V, Biotech Grade Fisher Scientific, Pittsburgh, Pennsylvania) was used as the model protein for denaturation experiments. BSA was dissolved in PBS (pH 7.4) at a concentration of . Further dilutions of the BSA were done in PBS so that the volume (20 μl) loaded in each lane of the gel was equal to the desired amount of total protein. Electrophoresis was done using commercially available prepoured gels (SDS-PAGE, 15% Tris-HCL gels, Bio-Rad, Hercules, California) run at 100 mA for 1 h. After electrophoresis, gels were stained with 0.1% Coomassie brilliant blue R-250 for 30 min at room temperature (RT) and then destained overnight at RT with 20% methanol/10% acetic acid. Although silver staining of the gels is an alternative to Coomassie blue, our interest was protein fragmentation (changes in molecular weights) rather than measuring the amounts of proteins present in the bands. Also, silver staining is known for a high variability between gels, and we needed optimal reproducibility for these experiments, so Coomassie blue staining was the chosen method. Protein bands were visualized and photographed under visible-light illumination using the Versa-Doc imaging system (Bio-Rad). 2.4.Laser ExposuresA Mai-Tai laser (Spectra Physics, Mountain View, CA) was used for all the laser exposures, except the chirped pulses. This Mai-Tai is a tunable, mode-locked, Ti:Sapphire laser that emits 90-fs pulses at 80-MHz repetition rate, is tunable from 720 to 920 nm, and has an average output power of 1.2 W at 850 nm. The energy per pulse is 15 nJ, the peak power per pulse is 167 kW, and the transform limited bandwidth is 8.5 nm (). Most of these experiments used the laser tuned to 850 nm. Selected 425-nm exposures were accomplished by passing the 850-nm emission through a doubling crystal (Fig. 1). All mirrors in the beam path were silver metallic. Beam diameters (all beam diameters are reported at ) ranged from to and were measured in air using the knife-edge technique. For the highest irradiance, a near-infrared (NIR) corrected Mitutoyo M-Plan-APO microscope objective was used in order to produce a focal spot diameter on the order of 10 μm, which we were not able to measure using the knife-edge technique. Therefore, this diameter was estimated assuming diffraction limitation propagation. Because of this, the irradiances reported for data using the microscope objective could have uncertainties as high as 50%. Irradiances in the samples were corrected for Fresnel losses from the air/quartz and quartz/water interfaces at the laser-incident surface of the cuvette. Irradiances are calculated using average continuous-wave (CW) power divided by the pulse repetition rate, divided by the pulse duration, then divided by the area of the beam. Pulse duration measurements were made using both a GRENOUILLE and an interferometric autocorrelator, and are fit to a sech2 function to extract pulse duration. A Tsunami laser (Spectra Physics) was used for the chirped-pulse experiments. This Tsunami laser is a sub-35-fs model that can emit pulses , after compression, at a rate of 80 MHz. It operates nominally at 805 nm. The pulse bandwidth can be tuned from a few nanometers to . For these experiments, we operated this laser with 60 nm nominal bandwidth (full width at half maximum) centered at 805 nm. We did not externally compress the pulses, so the pulses used in these experiments were chirped going into the sample cuvette. The Tsunami laser was pumped by a 6 W Millennia laser (Spectra Physics) emitting at 532 nm (Fig. 2). All samples were irradiated in quartz cuvettes according to the method described by Tsen et al.1,2 Two milliliters of solutions/suspensions were placed into a 3-ml cuvette containing a small stir bar (). The cuvette was held above a magnetic stir plate, using a clamp attached to a ring stand, and exposed for 1 h while stirring gently (). The jaws of the clamp were placed above the meniscus of the liquid in the cuvette so as not to block or scatter the laser beam. The beam spot was centered on the cuvette left to right, and at the midpoint between the meniscus of the liquid and the bottom of the cuvette. The beam spot diameter was not necessarily constant between experiments because it was used as one method for controlling irradiance. However, knowing the size of the stir bar and the rotation frequency, one can estimate the rate of displacement of the liquid in the cuvette by the spinning stir bar and thereby obtain some notion of the homogeneity of the exposure. The displacement of the spinning bar is a disc with a volume of for one full rotation, and the rate of spinning was estimated to be 100 rpm, which amounts to a volume of displaced. This means that the entire volume of the liquid in the cuvette is displaced by the spinning bar, and exposures were always 1 h in duration. All exposures were done at room temperature (20 to 25°C). Table 1 provides a comparison of the laser exposure parameters used for these experiments to exposure parameters previously published by Tsen et al. Table 1Laser exposure parameters used in published papers compared to laser exposure parameters used for these experiments. Exposure parameters for these experiments are well within those reported in the referenced papers. Irradiances above ∼1 GW/cm2 in Refs. 1 and 4 are needed only for inactivation of mammalian cells.
2.5.Viability AssaysAll treatments, exposures, dilutions, and platings were done at room temperature (20 to 25°C) unless otherwise stated, and phage and bacteria samples were held on ice when not being treated, sham exposed, or diluted for plating. Viability of the microorganisms was measured by counting plaques (M13) or colonies (E. coli) formed in a soft agar overlay. To make the overlays, suspensions of the microorganisms were serially diluted () in PBS and a 100-μl aliquot at each dilution was added to 4 ml of 0.5% eosin-methylene blue (EMB) agar (Cole-Parmer, Vernon Hills, Illinois) made with nutrient broth and held at 43°C. For M13 assays, a 100-μl aliquot of E. coli host was also added to the soft agar prior to adding the phage. The suspension was then mixed by vortexing and poured into prepared, 100-mm bacteriological plastic plates containing an EMB agar base (VWR International, Sugar Land, Texas) prewarmed to 37°C. The soft agar overlay was then allowed to harden at room temperature for 10 to 15 min before humidified incubation overnight at 37°C to allow for colony or plaque formation. When suspended in soft EMB agar, this strain of bacteria forms dark spherical colonies. M13 is not a lytic phage; it replicates by extrusion from the bacterium. Plaques are formed as a result of the inhibition of bacteria growth by the phage. 2.6.Assay ValidationsPeroxynitrite (PON) was used as a positive control for the various assays. When mixed with DNA, PON adds a nitrogen atom to guanine residues forming 8-nitroguanine.11 Nitroguanine is a leaving group in DNA, so the formation of nitroguanine results in an apurinic site in the double helix. Apurinic sites are labile and, under alkaline conditions, result in an SSB in the DNA, enough of which can lead to the death of a cell.8,9 The SSB allows the supercoiled pUC19 plasmid to uncoil into the open-loop structure, creating a second band in the gel. PON will also create peroxide radicals in water with dissolved oxygen, and these peroxide radicals will break peptide bonds in proteins. Peptide bond breaking can be detected by SDS-PAGE using denaturing conditions. Because of its reactivity with DNA and proteins, PON is also toxic to M13 and E. coli. PON stocks were synthesized by placing 1.38 g of in 15 ml of in a 100-ml beaker with a magnetic stir bar, which was, in turn, placed in an ice bath on a magnetic stirrer. After allowing a few minutes for the solution to become ice cold, an ice cold mixture of 2.27 g of 30% and 0.33 ml of concentrated in 15 ml of water was added rapidly. Immediately thereafter, an ice cold solution of 1.12 g of NaOH dissolved in 15 ml of was added rapidly. The resulting product was a clear, intensely yellow solution. PON concentrations of 65 to 95 mM were typically obtained using this method. PON that was not used immediately was stored frozen at and allowed to thaw at room temperature prior to subsequent use. PON treatment of pUC19 DNA was done at room temperature. From the pUC19 stock suspension, a 40-μl aliquot of DNA was diluted with 400 μl of borate buffer (50 mM adjusted to pH 8 with NaOH) yielding a DNA concentration of . Then 40 μl of this solution ( DNA) was mixed with 10 μl of the PON in borate buffer mixture to produce a total reaction volume of 50 μl. The different PON treatment concentrations were achieved by varying the volume of PON mixed into the complementary volume of borate buffer needed to keep a constant volume of 10 μl of PON to add to the 40 μl pUC19. After 15 min at RT, 5 μl of SYBR® Gold diluted in TBE buffer (89 mM Tris base, 89 mM boric acid, 1 mM EDTA, pH 8.0) was added to the reaction mixture (now a 55 μl total volume) and 30 μl ( of DNA) transferred to wells in a 0.8% agarose gel in TE buffer for 1.5 to 2 h of electrophoresis at 80 V and RT. The gels were then transferred to a glass dish and observed and photographed under UV illumination. PON treatment is a method for directly creating SSB in DNA, but since the laser-induced inactivation mechanism is unknown, we wanted to be sure the method was also sensitive to SSB induction by reactive oxygen species (ROS). The Fenton reaction is a well-known method of creating ROS during a cyclic oxidation and reduction of Fe (II)/Fe (III) in the presence of free radicals, in this instance ROS formed by hydrogen peroxide ().12 Ferrous iron, Fe (II), is oxidized by hydrogen peroxide to ferric iron, Fe (III), a hydroxyl radical, and a hydroxyl anion [Eq. (1)]. Fe (III) is then reduced back to Fe (II), a peroxide radical, and a proton, by hydrogen peroxide [Eq. (2)]. Both OH and OOH are ROS that can react with organic molecules by either extracting an electron, which is the most likely reaction, or by an addition reaction. In PBS prepared with 18 MΩ water, solutions of 10 mM Fe(II), and Fe(III) were prepared using and , respectively. The 250 mM solutions of and were prepared in 18 MΩ water. A pUC19 DNA solution of was prepared in PBS by diluting the stock preparation obtained using the Qiagen kit. PBS was used as the buffer in the final reaction volume of 1 ml. The reagent solutions can be combined in any order as long as the is added last. The volumes of the various components in the reaction mixtures are shown in Table 4. The components were added to the microcentrifuge tube in the sequence shown, left to right, in the table, allowed to react at room temperature for 15 min, and the DNA was then analyzed by AGE and SYBR® Gold stain. 2.7.Raman SpectroscopyTwo Raman spectroscopy systems were used in an attempt to replicate low-energy Raman measurements of previous reports. The first one used a double monochromator (Spex Model 1403) with a Hamamatsu R928 photomultiplier tube driven by computer software (SpectrMax/32 Windows from Instruments S.A., Vedrin, Belgium). For the laser source, a 488-nm laser line of argon ion laser (Spectra Physics Inc. Model 2025-05) was used. For a typical Raman spectrum measurement, the monochromator was scanned from to in steps of with a typical dwell time of 1 s per point. Thirty individual spectra were measured and averaged to generate a typical spectrum. This system allowed acquisition of Raman spectra as close as to the excitation laser line, as it is illustrated for a representative spectrum for sulfur, which contains a number of Raman lines in the above-mentioned spectral region. Note that all Stokes components are represented with their related anti-Stokes components. To perform Raman measurements in a broad frequency range and to compare the Raman intensities at low frequencies and high frequencies (), a different system was used. This system is based on a single spectrometer (Spex Model 270M) with an attached liquid-nitrogen-cooled multichannel CCD detector (Spectrum One, Instruments S. A.). The excitation line source was the doubled-frequency laser with the center wavelength at 532 nm. The Raman signal was collected in a backscattered geometry and, through a set of notch edge filters, was directed into the spectrometer. 3.Results3.1.Laser BioinactivationThe first experiments done were efforts to reproduce the inactivation of M13 bacteriophage as reported in published data.1–3 M13 in PBS diluted to were exposed for 1 h to irradiances of 0, 20, 40, 60, or of 850-nm radiation from the Mai-Tai laser and plaque-forming ability was measured. Data from one experiment, representative of overall results, are shown in Table 2. The published data showed a steep drop from 100 to 0% survival between 50 and . The data in Table 2 show no effect from the laser exposures. To be sure exposures were adequate to see an effect (if one was present), 1-h exposures to irradiances up to were used without finding phage inactivation (data not shown). Table 2Survival, measured by plaque formation, of M13 bacteriophage following a 1-h exposure to 90-fs pulses of 850-nm laser radiation at the indicated irradiances. There was no effect of these exposures on the survival of the phage.
The next experiments done were efforts to reproduce the inactivation of E. coli bacteria as reported in published data. The experiments with the bacteria were performed in the same manner as the experiments with the phage. The major difference was that the irradiances used were higher, in accordance with the published data. The published data show a steep drop in survival between 600 and . Data from one experiment, representative of overall results, is shown in Table 3. There was no effect of these laser pulses on the colony-forming ability of E. coli. The same results were obtained with 425-nm exposures (data not shown). To be sure that the exposures were adequate to see an effect, if one was present, selected exposures up to were produced using the microscope objective without measurable effect (data not shown). Table 3Survival of E. coli following exposure to 90-fs pulses of 850-nm radiation at the indicated irradiances. The numbers in the table are the counted colonies in one petri dish. There was no effect of these exposures on the survival of the bacteria.
At this point, concerns arose regarding the veracity of the assays, so experiments employing positive controls were done. PON was chosen as a positive control for the various assays because it is toxic to anything containing DNA,13,14 and one member of the research team has considerable experience synthesizing PON and measuring PON toxicity in microorganisms. M13 and E. coli were treated with various concentrations of PON, and plaque-forming and colony-forming assays were performed in the same manner as was done for the laser exposures. PON treatment resulted in killing of the microorganisms, and survival curves were made with the data. The PON survival curves for M13 and E. coli are shown in Figs. 3 and 4, respectively. Note the effective PON concentrations in E. coli are higher than the effective concentrations in M13. From these data, it was concluded that the survival assays were working and that the laser pulses were having no effect. 3.2.M13 FragmentationIn published atomic force microscope (AFM) images of M13 following exposure to femtosecond laser pulses, there are bits and pieces of what appear to be fragmented phage.15 Confidence that the survival assays were working, combined with the inability to reproduce the laser inactivation results, led to experiments to determine if there was any measurable interaction between the laser pulses and biological macromolecules. Since bacteriophage are composed of only DNA and protein, experiments to look for DNA damage in the M13 were accomplished as it is unclear whether the M13 DNA genome was still intact in these bits and pieces shown in the AFM images. The M13 genome is a single-strand, circular DNA that pairs with itself to create a pseudo double-stranded conformation in viable phage. To determine if laser pulses caused strand breaks in M13 genomic DNA, phage were exposed to laser pulses and then DNA was extracted and analyzed by AGE. Results of a representative gel are shown in Fig. 5. Fig. 5Agarose gel electrophoresis of genomic DNA extracted from M13 phage exposed to 0, 20, or of ultrashort laser pulses. Exposure parameters were 850 nm, 90-fs pulse duration, 80 MHz pulse frequency, 170-μm diameter spot size, and either or in phosphate buffered saline (PBS). DNA was stained with ehthidium bromide and relative fluorescence was measured under ultraviolet light illumination.  The lanes show results with equal volumes of DNA extracted from M13 exposed for 1 h to either 20 or at densities of or . The published data showed a steep drop from 100 to 0% survival between 50 and . There is a noticeable, expected difference in the relative fluorescence intensities in the DNA bands between and , but there is no observable change in the size of the genomic DNA, i.e., the fluorescence intensity does not leave the irradiated bands compared to the control bands and no additional bands appear anywhere else in the gel. Although these data do not totally rule out the possibility of multiple SSBs, as base pairing could keep the strand of DNA together, there is no possibility that the laser exposures are causing double-strand breaks in the M13 genomic DNA, as this would result in fragmenting as seen in the AFM images. The absence of any measurable effect on the M13 genome correlates with the plaque-forming data. Even though the M13 DNA strands were not broken by the laser exposure, it seemed possible that the DNA could remain intact inside the fragments seen in the AFM images with fragmentation of the protein coat as a possible mechanism of the inactivation because coat proteins are essential to the infectivity of the phage. Fragmentation could occur as a result of breaking peptide bonds in the coat proteins or by causing the coat proteins to crumble away from the core DNA since the coat protein subunits are simply wound around the single strand of DNA and held together by noncovalent interactions. Either way, this would be seen as M13 inactivation in a plaque-forming assay. So, after concluding that there was no obvious interaction of the laser radiation with DNA, laser-protein interactions were examined using SDS-PAGE. To determine if laser pulses caused peptide bond breaking in M13 coat proteins, phage were exposed for 1 h to irradiances of either 20 or , the coat proteins were extracted, and then run on SDS-PAGE gels. The results are shown in Fig. 6. Clearly, there are no differences between the irradiated and control samples. The large blot at the bottom of the gel is the major coat protein (P8) with a molecular weight of 3 kD. There are 2700 to 3000 units of this protein on each phage compared to only units of each of the other coat proteins. Because of the very small size of P8 and the very large unit number per phage, it is impossible to distinguish between fragmentation and denaturation of P8 using this technique. However, if peptide bonds in P8 were breaking, the smaller fragments would run off the bottom of the gel, and this would result in a lightening of the bottom band. This does not appear to be happening, and there are no noticeable differences between the bands in the gel associated with the higher molecular weight coat proteins. There is no objective evidence that the laser radiation is breaking peptide bonds in M13 coat proteins, and the nature of the apparent fragments in the AFM images remains a mystery. Fig. 6Sodium dodecyl sulfate polyacrylamide gel electrophoresis (SDS-PAGE) data for coat proteins isolated from M13 bacteriophage following laser irradiation in PBS. The left lane (MW) is the molecular weight standard ladder. The other lanes are duplicate preparations of single samples exposed to 0, 20, or . Exposure parameters were 850 nm, 90-fs pulse duration, 80-MHz pulse frequency, 170-μm diameter spot size, and .  3.3.Positive ControlsAlthough the data were consistent with no bioeffects of ultrashort laser pulses on M13 or E. coli, there was still some concern that perhaps the methods were not producing accurate results. At this point, a decision was made to use model systems to see if covalent bond breaking could be demonstrated in known experimental systems. The model system chosen for DNA was the pUC19 plasmid assay system for detecting SSB. Experiments were done exposing isolated pUC19 plasmids to femtosecond laser pulses in exactly the same way that M13 phage and E. coli exposures were done for survival measurements. Figure 7 shows a representative agarose gel with pUC19 plasmids following 1-h exposures to the indicated irradiances in . If there were an effect of the laser exposure on the plasmid, one would see fluorescence intensity moving from band 2 (supercoils) into band 1 (open loops). No difference in the DNA profiles was discernible following laser exposures of up to . Initial experiments were done in Tris/EDTA buffer because this is a commonly used buffer for isolating DNA. When negative results were found, we became concerned that perhaps the buffer was scavenging free radicals and that was protecting the DNA from damage. A check of the literature showed that Tris/EDTA does have a radical scavenging capability.16 Thereafter, laser exposures were done in either PBS or distilled water, even though there was no difference in the observed results (data not shown). Fig. 7Agarose gel electrophoresis image of pUC19 DNA laser-irradiated in PBS. Band 1 is open loop DNA, band 2 is supercoiled DNA, and band 3 is a tracking dye used to make sure the samples do not run off the end of the gel. The lanes, left to right, are duplicate samples exposed to 0, 30, 60, 90, and . Exposure parameters were 850 nm, 90-fs pulse duration, 80-MHz pulse frequency, and 170-μm diameter spot size. DNA was stained with ethidium bromide. 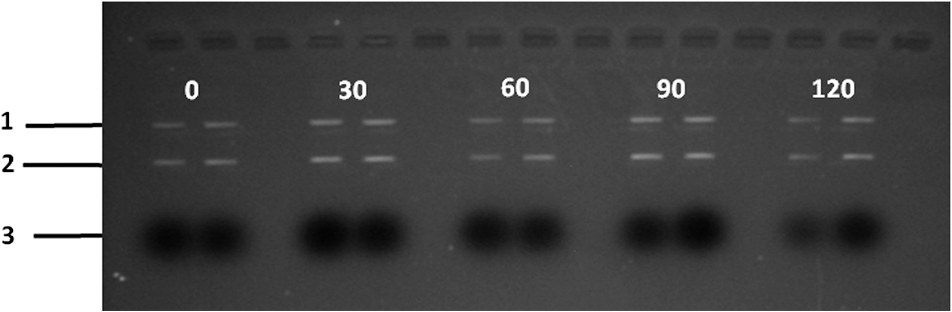 To confirm the assay was working as described, PON was used as a positive control for induction of DNA strand breaks. If the nitrosylation reaction is allowed to go to completion, the conversion of supercoils to open loops is dependent upon PON concentration. The results of a representative experiment are shown in Fig. 8. The change in the pattern of the pUC19 DNA in the gel as a result of the transition from supercoils to open loops is easily seen as a function of PON concentrations between 0.057 and 1.14 mM. At PON concentrations , the reaction is essentially saturated. However, the open-loop bands appear to move a bit farther in the gel at the higher PON concentrations, so there may be some fragmentation as a result of double-strand breaks in the open-loop DNA occurring in those samples. Fig. 8Agarose gel electrophoresis results after exposing of pUC19 DNA to 0.0, 0.057, 0.114, 0.171, 0.57, 1.14, 1.71, 5.7, 11.4, or 17.1 mM peroxynitrite (PON) in alkaline borate buffer for at room temperature. Wells in the gel were loaded with 0.4 μg of treated DNA. Row 1 is the open loop plasmid DNA, and row 2 is the supercoiled plasmid DNA. The change in pUC19 conformation is seen to be concentration dependent. DNA was stained with SYBR® Gold.  The model system chosen for looking at peptide bond breaking in proteins was bovine serum albumin (BSA). The physical and chemical properties of BSA are well known. Samples of BSA in PBS were exposed to ultrashort laser pulses and SDS-PAGE electrophoresis was done. BSA received 20, 40, 60, or femtosecond pulse laser exposures in 96-well plates using 100 μl (, 20 μg total) of stock solution. A representative experimental result is shown in Fig. 9. No effect of laser irradiation is seen. Fig. 9SDS-PAGE data for duplicate 4 μg samples of bovine serum albumin (BSA) exposed in PBS to laser irradiances of 0, 20, 40, 60, or in PBS. The left lane (MW) is the molecular weight standard ladder. Exposure parameters were 850 nm, 90-fs pulse duration, 80-MHz pulse frequency, and 170-μm diameter spot size.  The positive control was trypsin treatment of the BSA. Trypsin is a general-acting protease that cleaves peptide bonds on the carboxyl side of lysine and arginine residues in polypeptides. BSA was treated with trypsin, or with trypsin following thermal denaturation by heating at 95°C for 5 min. The BSA was then analyzed by SDS-PAGE with the results shown in Fig. 10. BSA fragments created by trypsin digestion ran at lower molecular weights than the native protein, and the fragments from trypsin treatment of the heat-denatured BSA ran at even lower molecular weights than fragments from trypsin-treated BSA. Heat denaturation destroys the tertiary structure of the protein, which allows trypsin access to lysine and arginine residues buried in regions of the protein otherwise inaccessible to the enzyme in the normal configuration. Fig. 10SDS-PAGE of bovine serum albumin. Left lane (MW) is the molecular weight standard ladder. The next four lanes, left to right, are 2.2, 2.5, 2.85, and 3.3 μg BSA per lane. The next three lanes are 4.0 μg BSA digested with 0.125, 0.05, and 0.0125% trypsin after protein disruption with SDS. The next three lanes are 4 μg SDS-treated BSA heated at 95°C for 5 min and then treated with 0.125, 0.05, and 0.0125% trypsin at 37°C. Note the dose response of the density of the bands in the gel as a function of trypsin concentration.  If, however, the laser radiation is selectively causing denaturation of proteins rather than bond breaking, that result would not be detected using this method because denaturation is part of the sample preparation procedure. Instead of denaturing conditions, one would have to run neutral gels in order to detect denaturation. This has been done, and denaturation of BSA by exposure to femtosecond pulses of laser radiation was not found (data not shown). The published data also showed that bioinactivation by exposure to 425-nm laser light in experiments performed to demonstrate the published effect was not the result of two-photon absorption. Thus, reproduction of these data was also attempted. The 425 nm wavelength was obtained from the Mai-Tai laser by passing the 850-nm emission through a doubling crystal placed between the laser aperture and the sample (Fig. 1). The laser output and spot size were adjusted to achieve the same irradiance at 425 nm as was used at 850 nm. pUC19 plasmids were exposed to pulses of 425 nm for 1 h, and AGE was used to look for SSB in the DNA. Results of a representative experiment are shown in Fig. 11. No SSB were found in the pUC19 plasmid DNA. Fig. 11Agarose gel electrophoresis results with pUC19 DNA in PBS after 1-h exposure to 0, 40, 60, or of 425-nm laser radiation in stirred suspension. Exposure parameters are 425 nm, 90-fs pulse duration, 80-MHz pulse rate, and 40-μm diameter spot size. Row 1 is DNA oligomers of unknown origin, row 2 is the open loop plasmid DNA, and row 3 is the supercoiled plasmid DNA. Published data show phage inactivation at . There is no effect of the pulsed laser radiation on the pUC19 DNA. DNA was stained with SYBR® Gold.  Although no radical scavenging activity by Tris/EDTA buffer was found in the pUC19 experiments, we have previously reported evidence of photooxidation and DNA damage in mammalian cells exposed to ultrashort pulses of laser radiation.17–19 We found that all of the positive controls showed our assays would detect covalent bond breaking by direct interaction (hypothesized ISRS mechanism), but there was no inactivation of phage or bacteria. Therefore, a positive control for detection of ROS-mediated DNA damage was accomplished. The Fenton reaction [Eqs. (1) and (2)] was chosen as the method to create ROS for detection of DNA SSB induction in the pUC19 assay because the chemistry is well known and PON can be formed in the cell from and nitrite ().13 We wanted to determine if the pUC19 assay would detect SSB induced by ROS and also if PON could be synthesized ex vivo by ROS and . So an experiment was devised to simultaneously determine whether or not the pUC19 assay would detect SSB induced by ROS created by the Fenton reaction and to determine if the induction of SSB by ROS was altered by the presence of . The experiment was done in 1.5 ml microcentrifuge tubes using the reagent proportions shown in Table 4, and the reaction was allowed to proceed for 15 min prior to loading the agarose gels for DNA electrophoresis. The results of the experiment are shown in Fig. 12. Table 4Compositions of the reaction mixtures for the pUC19 DNA samples shown in Fig. 12. The total reaction volume for all samples was 1 ml. Components of the reaction mixtures were added in the sequence (left to right) shown in the table. Rows in the table correspond to lanes in the gel.
Fig. 12Agarose gel electrophoresis of pUC19 DNA incubated with components of the Fenton reagent and , a potential source of PON through reaction with . The results show that the reactive oxygen species (ROS) created by the Fenton reaction causes single strand break in the pUC19 plasmid DNA (lanes 3, 6, and 7). Interestingly, protects the DNA from ROS (lanes 4, 5, 8, and 9). Clearly, is acting as a free radical scavenger while generating little or no PON. DNA was stained with SYBR® Gold.  The gel shows that the ROS created by the Fenton reaction do cause SSB in the pUC19 plasmid DNA (lanes 3, 6, and 7) and that these breaks can be found using this method. Even though no was added to the sample in lane 6, there appears to be enough naturally occurring in water at RT to initiate and maintain the Fe (II) to Fe (III) oxidation/reduction cycle. However, this is not the case with reduction of Fe (III) to Fe (II), lane 2, even though the reaction equations indicate it could occur. There is no evidence in these data that PON is being synthesized from and . To the contrary, in this experiment protects the DNA from SSB induction by ROS (lanes 4, 5, 8, and 9) acting, apparently, as a free-radical scavenger. 3.4.Raman Spectrum MeasurementsFrom the beginning of this effort, there was the assumption that there exists a Raman interaction strong enough to impart the energy required to break bonds (H- or covalent) or interrupt hydrophobic interactions. This is based on Tsen’s theory proposing that the acoustic vibrations that inactivate biological materials are the result of stimulating a low-wavenumber Raman mode.20 If this is true, a strong Raman line should be measurable using spontaneous Raman spectroscopy on the M13 samples. Our first observation was that whatever interactions there might be between the photons and the M13 phage are very weak. The standard phage preparations were not concentrated enough to acquire a reliably measurable signal over background, and components of the growth medium fluoresced strongly during illumination with the 532-nm laser. In order to achieve phage titers high enough to acquire a suitable signal and to replace the growth medium with a nonfluorescing buffer, a technique for precipitating phage from the growth medium was required. The method chosen is described in Ref. 21. Briefly, the method uses 4% polyethylene glycol (PEG) and 0.5 M NaCl to precipitate phage out of the growth medium after removing the host bacteria by centrifugation. After in the PEG/NaCl solution, the phage form aggregates that are pelleted by centrifugation on a superspeed centrifuge and resuspended in PBS. Using this method, a 1-l culture of phage in growth medium can be concentrated into 10 ml of PBS, a 100-fold titer increase. Using these concentrated samples, both low-frequency and high-frequency Raman vibrational spectra for M13 phage in PBS were acquired. All the Raman measurements were made using the 530-nm line of Kr laser, 250 mW on a sample, 160 s per data point ( step). Figure 13 shows data (all on the same scale) for M13 in PBS, PBS solution only, sulfur (as a reference), and a difference spectrum (M13-PBS) in the spectral range from to . Raman spectra are plotted as a function of energy difference from the laser line energy. A clear sulfur spectrum with Raman bands appearing symmetrically with respect to 0 wavenumber is shown for reference to indicate the ability to approach within to the Raman line. The Raman spectrum of the buffer was digitally subtracted from the Raman spectrum of M13 in the buffer, and the resulting spectrum is displayed as a difference. The spectrum shows no sign of a strong low-frequency vibration of M13 in the spectral region . It does not exclude the existence of weaker peaks in the low-frequency range of the Raman spectrum, but it unambiguously demonstrates that those lines are substantially weaker than, for example, high-frequency Raman lines and significantly weaker than anticipated.20 It is also clear that, at the same level of signal, no significant difference appears in solution. There is no evidence of a Raman amplitude strong enough to be considered useful for stimulated Raman excitation. The difference Raman spectrum (M13-PBS) in Fig. 13 is expanded in Fig. 14 ( to ), where points are experimental data and the line is a smooth fit to those points. If something specific to M13 were occurring, it would show up as peaks both for positive and negative Raman shifts, but nothing like this is seen within the accuracy of our measurements. Fig. 13Low-frequency Raman spectra, both Stokes and anti-Stokes, for samples as labeled. The sulfur spectrum is used as a known control and has its characteristic shape. There is no difference in the spectra of PBS and M13 in PBS, indicating no Raman-active mode in this low-energy regime.  Fig. 14The difference Raman spectrum in Fig. 13 expanded to show detail and fidelity of the curve fit to the data points from to . Dots are experimental data and the line is a computer model fit to the data. No interaction unique to M13 is observed. 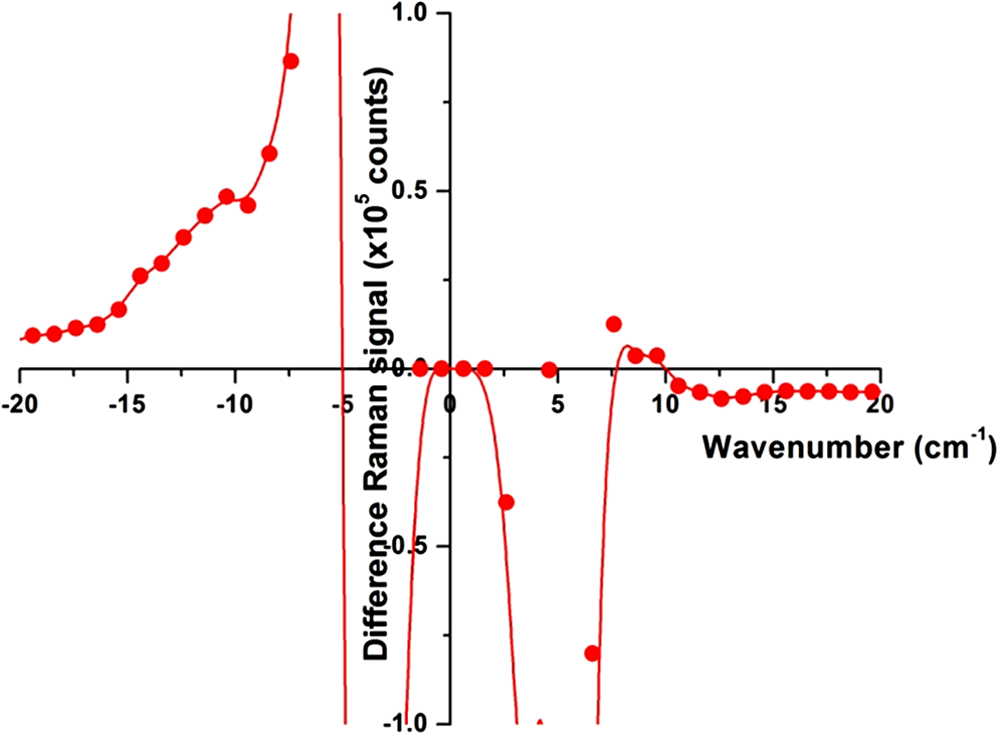 A high-wavenumber Raman difference spectrum for M13 is shown in Fig. 15. To generate this spectrum, a 600-s exposure Raman spectrum of PBS was subtracted from a 600-s Raman spectrum of M13 in PBS. This difference spectrum agrees, in general, with previous data in the region of the spectra from Serban and Lord,22,23 showing some vibrations unique to the phage. So higher-frequency components () exhibit all the characteristic vibrational lines attributed to the complex organic composition of M13 bacteriophage, but no significant low-frequency Raman components were recorded at the same level of signal. We estimate that if there were any low-frequency components of the Raman spectrum, they would be of the strength of the amide I Raman band for M13. Such a low level of interaction makes any nonlinear effects, such as stimulated Raman excitation, highly improbable as it was demonstrated both theoretically and experimentally in our recent publications on stimulated Raman photoacoustics.24,25 Fig. 15A 300-s exposure Raman spectrum of PBS subtracted from a 300-s exposure Raman spectrum of M13 in PBS. Water peaks are removed after subtracting out the PBS spectrum. On the ordinate, one has to multiply the values by 100 to get absolute counts. There is no evidence of a strong Raman interaction.  4.DiscussionUsing the published methods of Tsen et al.,1–3 we were unable to find any effect of low-average-power femtosecond laser pulses on survival of M13 phage or E. coli bacteria, pure DNA, pure BSA protein, coat proteins extracted from irradiated M13, or DNA extracted from irradiated M13. The problem, of course, is that negative results are impossible to prove because one is always susceptible to the claim that the experiment was not done correctly, according to any one of a myriad of minutiae associated with an experimental protocol. When faced with this quandary, the only things one can do is to thoroughly consider the experimental methods, systematically eliminate any possible errors, and employ positive controls to reassure that the assay methods are performing as expected. The process of exposing samples to the laser pulses is actually rather simple and straightforward. The laser used in the experiments is a commercially available, solid-state instrument that is very durable, and consistent and stable in its output. The setup for the experiment (Fig. 1) is also very simple compared to setups routinely provided by our engineers and technicians for other in vitro experimental protocols.17–19 The reference detector was checked and recorded every 10 min during the 1-h exposure to detect significant output fluctuations if they occurred. Although excursions of up to 3% standard deviation in output were occasionally observed, the output power rarely varied by (data not shown). Samples were exposed at RT and stir bars were used in the cuvettes containing the experimental samples, according to the published methods. Calculations based upon the estimated volume of the stir bar and its rotation rate indicated the entire sample volume moved through the 170-μm beam spot, on average, approximately once every 2.5 min over the course of the 1-h exposure. These conditions duplicate those described by Tsen et al.1–3 Since we were unable to kill the phage or bacteria, we decided to see if ultrashort laser pulses could induce SSB in M13 DNA or break peptide bonds in the phage coat proteins. We found no evidence of covalent bond breaking in either of these molecules. At this point, we became concerned about the veracity of our assays, so positive controls unrelated to laser pulses were devised. PON was used as a positive control for the DNA nicking, and microorganism survival curves. The assay methods for DNA strand breaks and killing of M13 and E. coli all showed the expected results when treated with PON. A control for breaking of peptide bonds, e.g., treatment with the protease trypsin, also returned the expected results. The biological endpoints are a result of an interaction, but they do not tell one anything about the interaction itself. Unable to reproduce the biological endpoints, a decision was made to measure Raman interactions in the M13 phage. The high-energy Raman spectra we measured reproduced, in general, the previous results of Serban and Lord22,23 in part of the spectrum. The higher-frequency components () exhibit all the characteristic vibrational lines attributed to the complex organic composition of M13 bacteriophage, but no significant low-frequency Raman components were recorded at the same level of signal. We measured the Raman spectra in the low-energy regime but found no interaction strong enough to induce ISRS. 5.ConclusionOur inability to reproduce the published data is curious inasmuch as the assays responded as predicted when treated with chemical agents whose mechanism of action is known (i.e., trypsin and PON) and we are experienced in using ultrashort pulse lasers in biomedical research.17–19 It is not unusual for investigators to report different inactivation parameters for any given cell line or strain, or between cell lines or strains, following some treatment (e.g., ionizing radiation or hyperthermia), but this is generally a matter of a difference in the relative magnitude of the effect rather than a difference between an effect and no effect.26 For femtosecond pulse laser research, this phenomenon is demonstrated by the fact that Tsen et al. reported inactivation of a human T-lymphocyte cell line at , while other authors report inactivation of Chinese hamster ovary (CHO) cells at a threshold of when irradiated with 200-fs pulses from a 780-nm laser.27 Tirlapur and König found that femtosecond-scale pulses of 800 nm radiation at a power density of opened up transient perforations in the membranes of CHO and rat-kangaroo kidney epithelial (PtK2) cells without apparent harm to the cells.5 Thus, we have evidence in the literature that femtosecond pulse laser exposures inactivate CHO cells in one instance, but femtosecond exposure does no apparent harm to CHO cells in another; a difference in irradiance of -fold reported by research groups with a common author.5,25 We are unaware of any other attempts to replicate these data of Tsen et al., but we closely matched the exposure conditions and microorganisms reported by Tsen et al. and could not duplicate the inactivation of biological samples or find any interaction between the laser pulses and biological macromolecules. AcknowledgmentsThis research was supported by a grant from the U.S. Air Force Office of Scientific Research to J. C. W. and NSF grants DBI-1250361 and CBET-1250363 to V.V.Y. ReferencesK. T. Tsenet al.,
“Selective inactivation of micro-organisms with near-infrared femtosecond laser pulses,”
J. Phys.: Condens. Matter, 19 1
–7
(2007). http://dx.doi.org/10.1088/0953-8984/19/47/472201 JCOMEL 0953-8984 Google Scholar
K. T. Tsenet al.,
“Inactivation of viruses by coherent excitations with a low power visible femtosecond laser,”
Virol. J., 4 50
–56
(2007). http://dx.doi.org/10.1186/1743-422X-4-50 VJIOA4 1743-422X Google Scholar
K. T. Tsenet al.,
“Photonic approach to the selective inactivation of viruses with a near-infrared ultrashort pulsed laser,”
Proc. SPIE, 7561 75610W
(2010). http://dx.doi.org/10.1117/12.841316 PSISDG 0277-786X Google Scholar
K.-T. Tsenet al.,
“Photonic approach to the selective inactivation of viruses with a near-infrared subpicosecond fiber laser,”
J. Biomed. Opt., 14
(6), 064042
(2009). http://dx.doi.org/10.1117/1.3275477 JBOPFO 1083-3668 Google Scholar
U. K. TirlapurK. König,
“Targeted transfection by femtosecond laser,”
Nature, 418 290
–291
(2002). http://dx.doi.org/10.1038/418290a NATUAS 0028-0836 Google Scholar
S.-W. D. Tsenet al.,
“Femtosecond laser treatment enhances DNA transfection efficiency in vivo,”
J. Biomed. Sci., 16 36
(2009). http://dx.doi.org/10.1186/1423-0127-16-36 JBCIEA 1021-7770 Google Scholar
T. GotoM. NakaiK. Ikuta,
“The life-cycle of human immunodeficiency virus type 1,”
Micron, 29
(2–3), 123
–138
(1998). http://dx.doi.org/10.1016/S0968-4328(98)00002-X MICNB2 0047-7206 Google Scholar
W. D. Claus, Radiation Biology and Medicine, 73
–98 Addison-Wesley Publishing Co., Reading, Massachusetts
(1958). Google Scholar
H. L. Andrews, Radiation Biophysics, 220
–228 2nd ed.Prentice-Hall Inc., Englewood Cliffs, New Jersey
(1974). Google Scholar
J. VieiraJ. Messing,
“The pUC plasmids, an M13mp7-derived system for insertion mutagenesis and sequencing with synthetic universal primers,”
Gene, 19
(3), 259
–268
(1982). http://dx.doi.org/10.1016/0378-1119(82)90015-4 GENED6 03781119 Google Scholar
V. Yermilovet al.,
“Formation of 8-nitroguanine by the reaction of guanine with peroxynitrite in vitro,”
Carcinogenesis, 16
(9), 2045
–2050
(1995). http://dx.doi.org/10.1093/carcin/16.9.2045 CRNGDP 1460-2180 Google Scholar
H. J. H. Fenton,
“Oxidation of tartaric acid in presence of iron,”
J. Chem. Soc. Trans., 65
(65), 899
–911
(1894). http://dx.doi.org/10.1039/ct8946500899 0368-1645 Google Scholar
C. SzaboH. IschiropoulosR. Radi,
“Peroxynitrite: biochemistry, pathophysiology and development of therapeutics,”
Nat. Rev. Drug Discov., 6 662
–680
(2007). http://dx.doi.org/10.1038/nrd2222 NRDDAG 1474-1776 Google Scholar
J. S. BeckmanW. H. Koppenol,
“Nitric oxide, superoxide, and peroxynitrite: the good, the bad, and ugly,”
Am. J. Physiol., 271
(5 Pt 1), C1424
–C1437
(1996). AJPHAP 0002-9513 Google Scholar
J. Ouellette,
“Femtosecond lasers prepare to break out of the laboratory,”
Phys. Today, 61
(1), 36
–38
(2008). http://dx.doi.org/10.1063/1.2835147 PHTOAD 0031-9228 Google Scholar
K. S. Haveleset al.,
“Effects of radical scavengers on radiation-induced DNA double strand breaks,”
Int. J. Radiat. Biol., 76
(1), 51
–59
(2000). http://dx.doi.org/10.1080/095530000139005 IJRBE7 0955-3002 Google Scholar
R. M. Hallet al.,
“Pulsewidth-dependent nature of laser-induced DNA damage in RPE cells,”
Proc. SPIE, 4257 159
–166
(2001). http://dx.doi.org/10.1117/12.434700 PSISDG 0277-786X Google Scholar
M. L. Dentonet al.,
“Photo-oxidation from mode-locked laser exposure to hTERT-RPE1 cells,”
Proc. SPIE, 5319 231
–237
(2004). http://dx.doi.org/10.1117/12.529355 PSISDG 0277-786X Google Scholar
R. D. Glickmanet al.,
“Laser bioeffects associated with ultrafast lasers: role of multiphoton absorption,”
J. Laser Appl., 20 89
–97
(2008). http://dx.doi.org/10.2351/1.2900538 JLAPEN 1042-346X Google Scholar
K. T. Tsenet al.,
“Raman scattering studies of the low-frequency vibrational modes of bacteriophage M13 in water—observation of an axial torsion mode,”
Nanotechnology, 17
(21), 5474
–5479
(2006). http://dx.doi.org/10.1088/0957-4484/17/21/030 NNOTER 0957-4484 Google Scholar
K. R. Yamamotoet al.,
“Rapid bacteriophage sedimentation in the presence of polyethyleneglycol and its application to large-scale virus purification,”
Virology, 40
(3), 734
–744
(1970). http://dx.doi.org/10.1016/0042-6822(70)90218-7 VIRLAX 0042-6822 Google Scholar
D. Serbanet al.,
“Structure and dynamics of the DNA-binding protein HU of B. stearothermophilus investigated by Raman and ultraviolet-resonance Raman spectroscopy,”
Protein Sci., 12
(4), 861
–870
(2003). http://dx.doi.org/10.1110/ps.0234103 PRCIEI 0961-8368 Google Scholar
R. C. LordG. J. Thomas,
“Raman spectral studies of nucleic acids and related molecules. I Ribonucleuic acid derivatives,”
Spectrochim. Acta A Mol. Spectrosc., 23
(9), 2551
–2591
(1967). http://dx.doi.org/10.1016/0584-8539(67)80149-1 SAMCAS 1386-1425 Google Scholar
V. V. Yakovlevet al.,
“Stimulated Raman photoacoustic imaging,”
Proc. Natl. Acad. Sci. U. S. A., 107
(47), 20335
–20339
(2010). http://dx.doi.org/10.1073/pnas.1012432107 1091-6490 Google Scholar
V. V. Yakovlevet al.,
“Chemically specific imaging through stimulated Raman photoexcitation and ultrasound detection: minireview,”
Austr. J. Chem., 65
(3), 260
–265
(2012). http://dx.doi.org/10.1071/CH11407 AJCHAS 0004-9425 Google Scholar
G. P. Raaphorstet al.,
“Intrinsic differences in heat and/or x-ray sensitivity of seven mammalian cell lines cultured and treated under identical conditions,”
Cancer Res., 39 396
–401
(1979). CNREA8 0008-5472 Google Scholar
K. Koniget al.,
“Cloning assay thresholds on cells exposed to ultrafast laser pulses,”
Proc. SPIE, 3616 100
–110
(1999). http://dx.doi.org/10.1117/12.351834 PSISDG 0277-786X Google Scholar
BiographyJeffrey C. Wigle received a PhD in radiation biophysics from the University of Rochester, Rochester, New York, completed a postdoctoral fellowship in Genetic Toxicology in the Carcinogenesis Laboratory at Michigan State University, and then joined the U.S. Air Force. While on active duty he held a variety of jobs, most of which were management of biomedical or environmental technology research programs. He is now an Air Force civilian biological scientist engaged in research on light-tissue interactions. Eric A. Holwitt is currently on loan from the Air Force Research Laboratory to the U.S. Air Force Academy where he is serving as the Distinguished Visiting Professor of Chemistry. He has led research into radiation protection, biological threat agent detection and decontamination, and the role of nitric oxide and superoxide in nitrating DNA. He holds 7 patents. He has also served twice as a United Nations weapons inspector in Iraq. Larry E. Estlack graduated with honors from Texas A&M University, College Station, Texas, with a BS degree in microbiology/chemistry. He has 28 years experience working in a variety of government, academic, and commercial biomedical research laboratories. For the past ten years he has worked on bioeffects following interactions of lasers or nanosecond electrical pulses with mammalian cells in vitro. He has co-authored 40 scientific papers and holds four patents in the field of virology. Gary D. Noojin has worked for the past 23 years in ultrashort pulse laser safety research. He has worked in a group that has produced numerous publications in the field of laser safety. Many of these publication involved measuring MPEs for subnanosecond laser systems, and the mechanisms for damage from these pulses. He is currently employed by TASC, Inc. and works in the bioeffects group under contract with AFRL/RHDO. Katharine E. Saunders BS, BSN, MPH, is a 2007 AFROTC graduate of the University of South Alabama. On active duty she served as a biomedical research scientist at AFRL/RHDO. After leaving active duty, she earned her nursing degree from Florida State University. She is currently serving as a public health officer in the Air Force Reserves while studying to become a family nurse practitioner through the doctoral program at Loyola University, New Orleans, Louisiana. Vladislav V. Yakovlev is professor of physics and astronomy, and biomedical engineering at Texas A&M University, College Station, Texas. He is a Fellow of OSA, SPIE, and BMES. His professional awards include NSF Career Award, and USAF ASEE and DOD Consortium Fellowships. His research interest, the development of instrumentation and methods for sensing and imaging biological materials, has resulted in more than 180 peer-reviewed publications with citations in excess of 3000. Benjamin A. Rockwell is a principal research physicist in the Optical Radiation Branch, Bioeffects Division, Human Effectiveness Directorate, U.S. Air Force Research Laboratory. He serves as the Advanced Laser Bioeffects team leader, guiding a team to develop recommendations to change the national and international laser safety standards based on solid scientific investigation of hazards. He is a Fellow of the Laser Institute of America and a Fellow of the Air Force Research Laboratory. |
||||||||||||||||||||||||||||||||||||||||||||||||||||||||||||||||||||||||||||||||||||||||||||||||||||||||||||||||||||||||||||||||||||||||||||||||||||||||||||||||||||||||||||||||||||||||||||||||||


