|
|
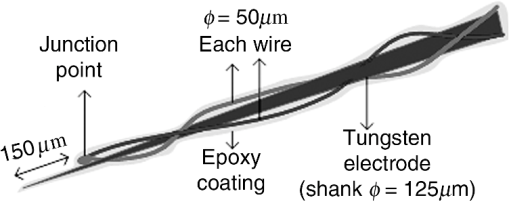
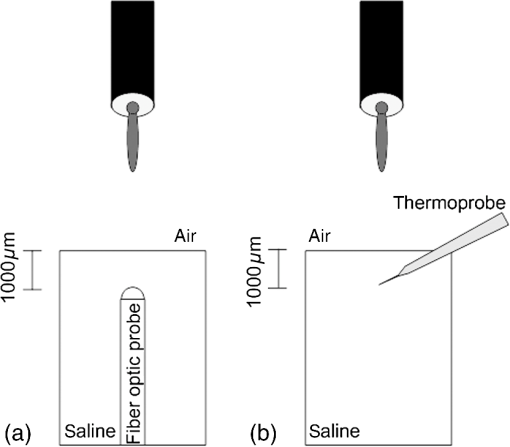
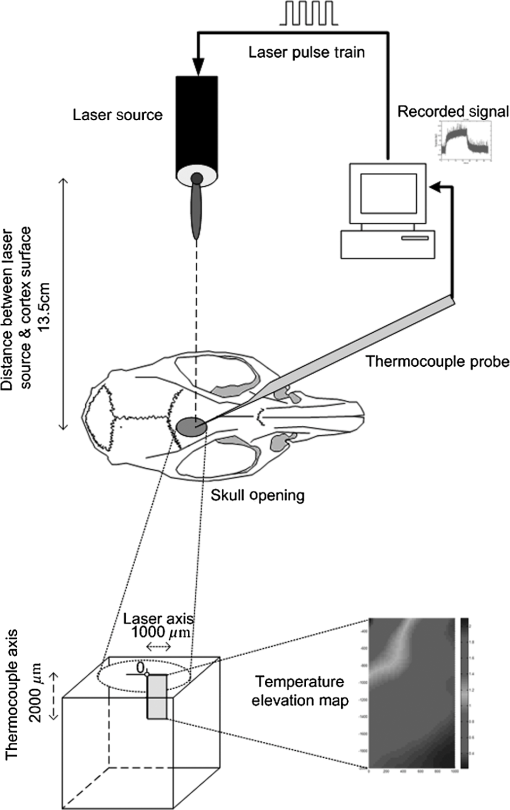
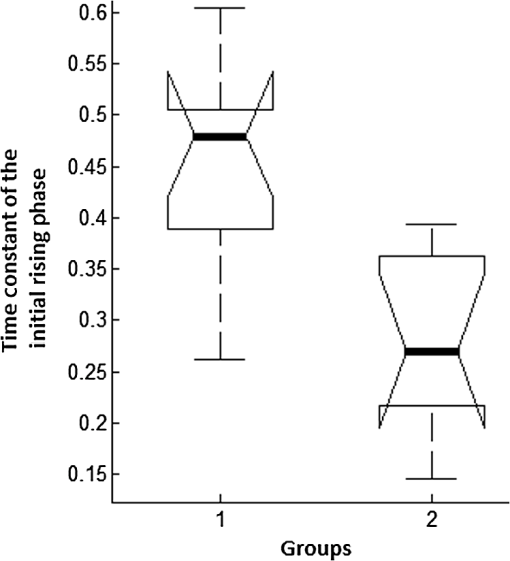
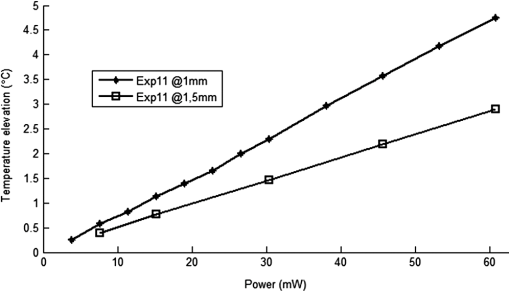
1.IntroductionNear-infrared (NIR) light finds applications in medicine for diagnostic and therapeutic purposes such as spectroscopic imaging1 and the treatment of brain tumors.2 Infrared light is also tested as a means of wireless power transfer in visual prosthesis.3 Temperature elevation is a complication that has not been addressed sufficiently in these studies. Our laboratory is currently investigating the feasibility of wireless neurostimulation in the central nervous system (CNS) using optically activated microstimulators in the NIR wavelengths.4–6 The project’s motivation is to solve well-known problems caused by the microwires that connect electrode arrays to the outside world.7 Microelectrode arrays often fail due to breakage of wire interconnects and the chronic tissue response caused by the tethering forces of the wires. In humans, a body temperature of greater than 37.5 to 38.3°C is defined as hyperthermia; i.e., elevated body temperature due to failed thermoregulation that occurs when the body produces or absorbs more heat than it dissipates.8 Body temperatures exceeding 40.5°C, which usually result from extended exposures to environmental heat, cause a heat stroke. A study of temperature effects on the CNS argues that the brain loses its ability to thermoregulate at the body core temperatures exceeding 40.5°C and the irreversible multiorgan dysfunction begins.9 Hyperthermia in the 41 to 44°C range can cause damage in the CNS and neurological symptoms of a heat stroke in some animal models.10 However, the lasers used in the field of neural prosthetics will most likely involve local and steady temperature elevations in the CNS and the adverse effects should be investigated at the molecular level. For instance, a study performed on the rat spinal cord showed significant morphological and histochemical alterations and signs of diffuse spinal cord lesions of vascular origin with degeneration of nerve cells due to exposure to an ambient temperature of 43°C for 4 h.11 On the other side, the whole or local brain hyperthermia studies indicate that a fluctuation of brain temperature within 4°C may be considered a normal physiological response depending upon the activation of the neurons and blood circulation.12 The safe level of NIR exposure given by American National Standards for Safe Use of Lasers (ANSI Z136.-2007) does not list the dose for the neural tissue specifically. Despite these reports that involved extreme temperature applications, others show that even small temperature elevations have observable effects. A study on stimulation induced thermal effects indicates that an increase of 0.5°C causes detectable changes at the cellular level, and 1°C increase can have profound effects.13 An implantable neural prosthetic device should be designed with the most conservative criteria considering a potential lifetime of many years. Therefore, we use a conservative value of 0.5°C as a design criterion in this study, although the results can be scaled for other temperature values. Optical tissue properties (scattering and absorption coefficients) and the number of photons penetrating into the tissue determine the magnitude and the spatial pattern of energy deposition and hence the temperature distribution in neural tissue.13 The number of penetrating photons at a given location along the tissue surface is a function of the incident light beam parameters, e.g., cross-sectional intensity profile, total power, and exposure duration. Scattering is the dominant form of interaction inside the neural tissue at NIR wavelengths. Gray matter, in general, has a lower scattering coefficient than the white matter and as a result, NIR light penetrates deeper into the gray matter. However, the optical parameters do not determine the temperature distribution alone. Once the optical energy is converted into heat through absorption, the heat spreads into medium by conduction as a function of time. The transient and steady-state temperature distribution depend on both optical and thermal parameters of the neural tissue in question. Although the main objective of this study was to specifically measure the temperature profile inside the rat brain under the exposure of an NIR laser beam with typical parameters needed to activate our microstimulators, the results can also provide practical insights for those who are investigating NIR light–neural tissue interactions in general. In this study, a micro-temperature probe was inserted into the brain cortex in anesthetized rats to directly measure the temperature rise inside in a two-dimensional (2-D) vertical plane while varying the relative position of the NIR laser beam. The maximum allowable light exposure was estimated that caused a threshold level temperature elevation in neural tissue. 2.Methods2.1.Temperature Probe PreparationA T type thermocouple (copper-constantan, T301, Unisense, Denmark) made of microwires (50 μm each wire) was wrapped around the tapering part of the tip of a tungsten microelectrode (shank diameter 125 μm) as a backbone for easy penetration into the brain (Fig. 1). The thermocouple wires were covered with a thin layer of epoxy for electrical insulation while maintaining a fast time response. The time constant of the final probe design was measured by dropping hot water droplets on the tip and found to be 60 ms. 2.2.Thermocouple Exposure to LightPhotons absorption directly on the thermocouple wires and the tungsten electrode carrier may result in an overestimation of temperature in tissue.14 The error introduced by exposure of the probe to the incident light was estimated by inserting the probe in a Petri dish filled with saline and positioning the laser source above the thermocouple junction at 13.5 cm [Fig. 2(b)], the same distance used in the animal experiments. Scattering and absorption in this medium were assumed to be negligibly small at the laser wavelength used (830 nm) and the saline layer above the probe was only 1 mm. On the other hand, the thermal conductivity and the specific heat capacity of saline closely mimic that of neural tissue (0.45 to and , respectively13). Thus, the saline bath imitated the thermal properties of the brain while eliminating the effects of optical scattering and absorption of light in the medium, which allowed us to assess the thermal effect of light on the probe without perturbing the temperature of the medium. The steady-state temperature rise was measured as 1.4°C in the thermoprobe with its tip at a depth of 1000 μm in saline [Fig. 2(b)]. The light intensity was also measured at the same position in saline by replacing the probe with a 100 μm glass fiber [Fig. 2(a)], facing up toward the laser, which was connected to a photodiode at the other end. The light beam was attenuated by a small amount in saline (by 2.3%) as predicted. We normalized the in-saline temperature measurements with the experimentally measured values of light in the brain reported earlier in another study from our laboratory.15 More specifically, the light intensity at the same depth in the brain was about 1.8% of the intensity measured without the brain. This percentage multiplied by 1.4°C gave us the estimated temperature rise in the probe as a result of light exposure when it was in the rat brain. This error term (0.025°C) was of the temperature elevation measured () at this point in the tissue during in vivo experiments. Following the same method, the maximum thermocouple heating effect was estimated to occur at the surface and found to be 10%. The error was smaller in deeper regions since the light intensity decreases exponentially by depth (hence the exposure of the probe) while the temperature decline is more gradual due to heat conductance through tissue. It was decided that the temperature error due to light fallen on the probe was small enough to be neglected in this study for the sake of simplicity. 2.3.In Vivo ExperimentsSix Sprague–Dawley rats (350 to 500 g) were used in this study. The anesthesia was induced with ketamine () and xylazine () mixture diluted with saline and further doses of ketamine were given as needed. Marcaine (0.2 mL) was injected at the site of incision as local analgesics. Dexamethasone (, IM) was injected prior to surgery to reduce edema of the brain. The rectal temperature was continuously monitored and maintained at 36°C using a temperature regulated heating pad. The end-tidal was observed to stay within the normal range throughout the experiment, which usually lasted about 6 to 7 h including the surgery. All the experimental procedures were approved by the Animal Care Committee at Rutgers University, New Jersey. A cranial opening was made immediately rostral to the bregma on the right side of the central fissure. The connective tissue over the dura was carefully removed, but the dura was left intact. Dehydration of brain tissue was prevented using a pool of mineral oil or saline (three experiments with each) over the cortex filling the cavity to the rim of the skull opening. After positioning the head perfectly horizontally in the stereotaxic frame, the probe was inserted into the brain (through a small hole in the dura that is off the laser path) at an angle of 45 deg using a three-axis micromanipulator (Fig. 3). A free-air, NIR laser beam (74 mW, 830 nm, DLS-500-830FS-100, StockerYale, Canada) with a Gaussian intensity profile and a circular footprint of 0.4 mm in diameter was aimed at the probe from 13.5 cm above the cortex. The laser activation pattern and data acquisition were controlled through MATLAB™. The laser intensity profile was verified (at a distance of 13.5 cm) using a commercial photodiode with a very small active area (, G9842, Hamamatsu, GaAs PIN photodiode) as shown in Fig. 7 on the top. The laser profile was Gaussian with a circular cross section. The radius was taken as the value of the Gaussian intensity curve, which is the horizontal distance where the intensity profile drops down to of its peak in the center. This diameter was equal to that of a flat profile beam with the same peak power intensity and the same total power as the Gaussian profile laser that was used. A train of NIR pulses (2-ms pulse width, 100 Hz, 15 s train duration) was sent to the cortex while the temperature elevations were measured at depths from 250 to 2000 μm in steps of 250 μm from the dura. For each depth, the laser source was horizontally moved in steps of 100 μm up to 1000 μm away from the probe axis in the rostrocaudal direction while repeating the temperature measurements. Thus, a 2-D map of temperature elevation was developed in a parasagittal plane for an area of . 2.4.Data ProcessingFigure 4 shows a sample temperature signal with the sensor in the brain gray matter at a depth of 500 μm. Because the baseline brain temperature was different in each animal due to variations in the homeostasis of the animal and the room temperature, the differential temperature elevation from the baseline () was taken as the temperature signal caused by the laser. The trend in the temperature signal did not follow a simple exponential curve but rather had multiple regions [Fig. 4(a)]. There was an initial fast rising region [expanded in Fig. 4(b)] which was followed by a ramp-like segment for the rest of the laser ON phase. An analytical function that consists of the products of multiple exponential terms would probably give the best fit to the experimental data. Considering the thermal noise level of the signals, we chose a simpler but a more robust model. The initial segment (first 1.5 s) of temperature signals was modeled with a single exponent where is the time) and the last 12 s of the curve with a linear ramp (, where and are the constants) as shown by the dash and solid lines in Fig. 4(a). The linear line was extrapolated back to time zero to find the parameter of the exponential formula, leaving the time constant () as the only unknown. The baseline was calculated by averaging the data points within 1.5 s window immediately before the onset of the laser. The temperature elevation at each measurement point was taken at time equals to 5 s from the line fit, subtracted from the baseline, and used for a 2-D temperature plot. Fig. 4The temperature signal produced as a response to a 15-s long laser pulse train at a depth of 500 μm. (a) The solid line is the linear fit to the signal after 3 s during the laser ON phase. The dash line shows the filtered (10 Hz low pass) version of the noisy temperature signal (gray). (b) Exponential fit to the initial 1.5 s of the temperature curve shown in a larger time scale. 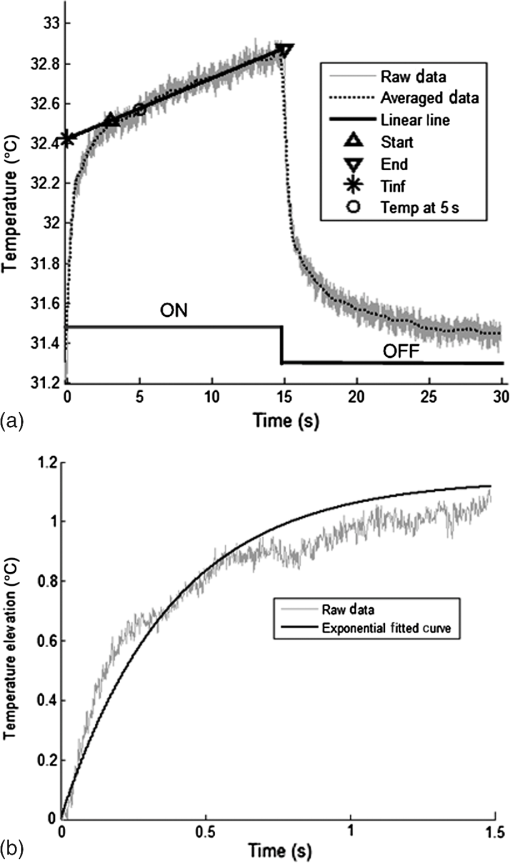 3.ResultsThe temperature elevation as a function of depth at the center of the laser beam is shown in Fig. 5. The temperature decline by depth was fitted by a single exponent, as shown over the plot. The space constant, which was defined as the depth where the intensity was reduced to of its maximum, was found as 0.96 mm. If extrapolated, the plot intersects the -axis at 2.6°C, i.e., when the depth equals to zero. Fig. 5Temperature elevation as a function of depth at the center of the laser beam. The data points represent the mean±standard error of measurements from all six animals. The dashed line is an exponential curve fit (correlation 0.99) with a single exponent. 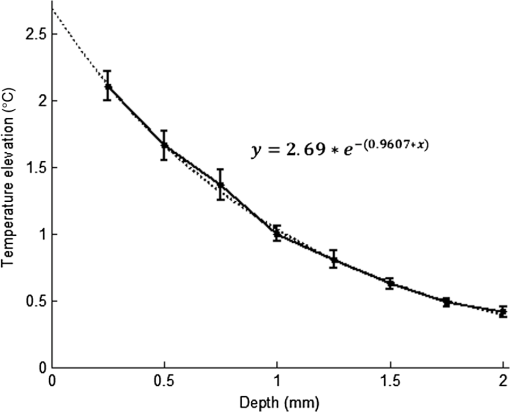 The map of temperature elevations within the 2-D vertical plane is shown in Fig. 6. The maximum temperature values were measured near the surface at the beam center. The temperature profile quickly drops in the horizontal direction nearly following the same trend of the laser intensity profile. In the vertical direction, however, the intensity profile extends a few times the laser diameter. The directional asymmetry is a result of the beam direction entering the brain as well as the large directionality factor of neural tissue (). Fig. 6Two-dimensional temperature elevation inside the rat brain due to a laser beam of 14.8 mW average power. Measurements were made in steps of 250 μm vertically and 100 μm horizontally and then interpolated. The bell-shaped curve above shows the laser intensity profile aligned with the 2-D temperature plot. 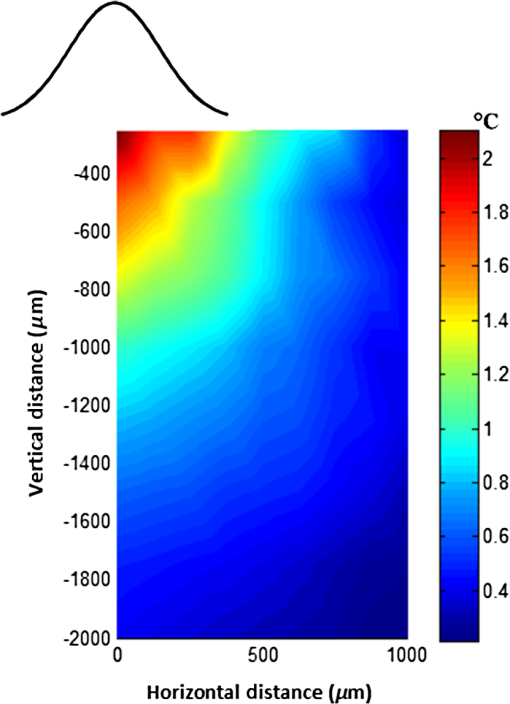 3.1.Statistical AnalysisThe experiments were divided into two groups; those with saline (three experiments) and those with mineral oil (three experiments) that was used to fill the cranial hole above the dura. The Student test indicated a significant difference between the two groups in terms of the time constant of the initial rising phase (). The group means were and , respectively (Fig. 7). The temperature measurements taken at of the temperature curve were also significantly different between saline and mineral oil when the corresponding points in the 2-D plane were paired (, -way analysis of variance). 3.2.Optical Power Versus TemperatureThe laser source had an average power of 14.8 mW (74 mW operated at 20% duty cycle) and a Gaussian intensity profile beam with a circular footprint. The diameter was adjusted to be 0.4 mm at the dura surface using lenses to focus the beam. This diameter was calculated by finding where the light intensity drops to times the peak in the center, which corresponds to the diameter of a flat intensity profile beam that has the same peak and total power as the Gaussian beam. The average laser power density, i.e., the total power divided by the beam area, was calculated as . At this power level, the maximum temperature measured in the beam center was 2.1°C at 250 μm below the surface. By extrapolating the curve in Fig. 5 back to zero, the temperature at the pia matter surface was estimated to be 2.6°C. A temperature elevation of 1°C causes profound effects in neural tissue.13 Thus, a more conservative value of 0.5°C was taken as the maximum allowable temperature in our calculations.5 The signal-to-noise ratio (SNR) at the thermocouple output was very poor for temperature changes less than a degree Celsius. In order to improve the SNR, the laser power was intentionally kept high and the results were scaled down to find the optical power level corresponding to 0.5°C. For this linear interpolation, we first verified that the temperature increase was a linear function of power within the temperature ranges observed in this study (Fig. 8). The laser power was varied by adjusting the pulse width while keeping the intensity and frequency the same. Vascular mechanisms of temperature regulation did not seem to play a large role within the range studied here, as suggested by the linearity of the plot in Fig. 8. Thus, the optical power limit was found as or by linear interpolation that corresponds to 0.5°C temperature elevation (). 4.Discussion4.1.2-D Temperature ProfileOptical properties play as much of a role as the thermal parameters of the neural tissue in defining the temperature distribution inside the brain. NIR wavelengths can penetrate with more ease into neural tissue than the visible light. The dominant form of the interaction with the neural tissue at NIR wavelengths is scattering.5 Since the gray matter has a lower scattering coefficient than the white matter, NIR light can penetrate deeper into the gray matter. The laser wavelength (830 nm) chosen in this study is one of the several wavelengths in the NIR range at which commercial semiconductor lasers diodes are available. The specific wavelength is not very critical for the general conclusions of this study since the optical properties of tissue do not vary drastically within the NIR region.16 The temperature elevation of the beam center at a depth of 1150 μm is around 0.9°C in Fig. 6 while the same temperature increase at the surface in the horizontal direction occurs at 750 μm. Thus, the spatial gradient of temperature decrease is steeper in the horizontal direction than the vertical direction. This trend is similar to the optical intensity profile observed in a previous study (their Fig. 4 in Ref. 5), except that the temperature decline is much less steep in all directions because of heat conduction through the medium. The laser beam profile and diameter are also among the factors that determine the light intensity profile inside the neural tissue as predicted by Monte Carlo simulations.15 A larger beam size may yield smaller increases in the local temperatures near the surface for the same total power that needs to be delivered. This would make sense only if the same level of optical power can be harvested at the targeted implant with the larger beam size. The Gaussian profile has a central peak of times the total power of the source. A flat profile circular beam can help to reduce this spatial peak effect in the center. 4.2.Sources of Measurement ErrorA steady-state was assumed to be reached within the 5 s of laser application. From the time course of the thermocouple signal, however, it was evident that the temperature was still rising slowly at the end of the pulse train. The 5 s time frame was chosen, while recognizing that this is not the steady-state measurement, to be able to finish the 2-D temperature map within a few hours before the animal’s condition begin to deteriorate under anesthesia. Other factors influencing the measurements included motion artifacts due to breathing and pulsation of the heart. We also saw the disturbances from the air circulation in the room particularly in the measurements made near the brain surface. The time constant of the probe (60 ms) was significantly shorter than the 5-s measurement period and therefore dismissed as a possible error source. The heat dissipation to the outside through the electrode shank that carried the thermocouple was also assumed to be negligible. The nearest point of measurement to the cortical surface was 250 μm below the dura and the temperature plot was extrapolated back to the pial surface. The measurements at the pial or dural surface were not reported here because of large variations seen in those measurements. In our observations, the dura matter thickness was also one of the major factors that influenced how much light penetrates into the brain and hence the temperature elevation profile inside. The interanimal variations in the dura thickness caused large differences in our results as well. Despite these imperfections and disturbances, an adequate level of reproducibility was achieved in the measurements to make a temperature map by averaging the results from multiple animals. 4.3.Maximum Allowable Optical PowerThe laser power corresponding to 0.5°C temperature increase () is almost two orders of magnitude larger than what was needed () to stimulate the ventral horn neurons in the rat cervical cord at a depth of 2.35 mm from the dorsal surface.6 This suggests that our microstimulators can be implanted deeper in neural tissue without exceeding the temperature limitation on the surface. In a simulation study, the maximum power for the same temperature increase was found as 325 and for the human gray and white matters, respectively.5 Almost an order of magnitude difference in simulated and measured power levels (2.27 versus for the gray matter) must result from several factors, including the contribution of heat dissipation from blood flow that was not considered in the simulations. Another source of discrepancy is the medium filling the cavity above the brain cortex, which was assumed to be air in the simulations and was either saline or mineral oil in the experiments of this study. The thermal conductivity and the specific heat capacity for air and saline are substantially different (0.03 versus 0.45 to , and 1005 versus , respectively13) and air would dissipate much less heat. The finding that the time constants measured with saline and mineral oil as the filling material are statistically different suggests that the heat dissipation through the skull opening was an important contributor to the measurements. The thermal conductivity and specific heat capacity of the skull are closer than air to that of saline ( and , respectively17) and thus the experimental conditions of this study are expected to better mimic the chronic implant conditions where the skull opening would presumably be a tiny hole for the passage of an optical fiber for delivery of NIR light. On the optical side, the reported values of the scattering coefficient for rat18 and human gray and white matters19,20 vary in a large range; a parameter that would determine the penetration depth and hence the region of maximal temperature effect. We experimentally found the scattering coefficient to be around in the rat brain gray matter.15 The above discussion exemplifies how many different factors account for the thermal effect of a light beam penetrating into tissue. In general, the experimental results may be considered more reliable, if the conditions can closely mimic the targeted application, while being cognizant of the shortcomings of the experimental setup. For instance, anesthesia may reduce the blood flow and suppress the vascular regulation mechanisms of temperature control. If anesthesia indeed has a significant influence, it would push the estimated maximum allowable optical power toward more conservative values. 4.4.Future WorkA computer bioheat model can provide insights as to which parameters the results are most sensitive to, including the properties that cannot be easily modified experimentally, and thereby increase the level of confidence in these experimental results. A computer simulation can also perform a transient time analysis that would allow one to study the heat propagation through the volume in time. Finally, the degree to which these results can translate to the other parts of the CNS, such as the spinal cord, and to other species is arguable since optical parameters are significantly different between the white and gray matters and between species. These concerns warrant further experimentation for the extension of these results to other neural tissues. 5.ConclusionsThe thermal effects of NIR laser exposure in the rat brain are reported here in anesthetized preparations. The noteworthy outcome is that the significant levels of optical energy () can be injected into the brain tissue before the thermal effect reaches a critical level that may influence the homeostasis of the local neurons. As a comparison, this optical power is about two orders of magnitude higher than the energy levels required to wirelessly activate neural tissue via photodiode-based floating devices implanted into the rat cervical spinal cord.6 Nonetheless, the thermal effects should be tested for each specific application since the temperature map depends on many parameters such as the thermal properties of the tissue and the surrounding structures, the optical properties of the CNS region, and the laser beam size and shape. AcknowledgmentsThis study was funded by the National Institute of Health Grant (NIBIB, R01 EB009100). We thank David S. Freedman for commenting on this paper. ReferencesW. Fredericket al.,
“Near infrared spectroscopy: the practical chemical imaging solution,”
Spectrosc. Eur., 14
(3), 12
–19
(2002). SPEUEF 0966-0941 Google Scholar
Z. Aminet al.,
“Hepatic metastases: interstitial laser photocoagulation with real-time US monitoring and dynamic CT evaluation of treatment,”
Radiology, 187
(2), 339
–347
(1993). RADLAX 0033-8419 Google Scholar
H. Saileret al.,
“Investigation of thermal effects of infrared lasers on the rabbit retina: a study in the course of development of an active subretinal prosthesis,”
Graefes Arch. Clin. Exp. Ophthalmol., 245
(8), 1169
–1178
(2007). http://dx.doi.org/10.1007/s00417-006-0513-1 GACODL 0721-832X Google Scholar
A. Abdoet al.,
“In vitro testing of floating light activated micro-electrical stimulators,”
in Conf. Proc. IEEE Eng. Med. Biol. Soc.,
626
–629
(2009). Google Scholar
A. AbdoM. Sahin,
“Feasibility of neural stimulation with floating-light-activated microelectrical stimulators,”
IEEE Trans. Biomed. Circuits Syst., 2011
(99), 1
(2011). http://dx.doi.org/10.1109/TBCAS.2011.2114882 Google Scholar
A. Abdoet al.,
“Floating light-activated microelectrical stimulators tested in the rat spinal cord,”
J. Neural Eng., 8
(5), 056012
(2011). http://dx.doi.org/10.1088/1741-2560/8/5/056012 1741-2560 Google Scholar
M. SahinV. Pikov,
“Wireless microstimulators for neural prosthetics,”
Crit. Rev. Biomed. Eng., 39
(1), 63
–77
(2011). http://dx.doi.org/10.1615/CritRevBiomedEng.v39.i1 CRBEDR 0278-940X Google Scholar
S. BurkeM. Hanani,
“The actions of hyperthermia on the autonomic nervous system: central and peripheral mechanisms and clinical implications,”
Auton. Neurosci., 168
(1–2), 4
–13
(2012). http://dx.doi.org/10.1016/j.autneu.2012.02.003 ANUEB2 1566-0702 Google Scholar
M. G. Whiteet al.,
“Cellular mechanisms of neuronal damage from hyperthermia,”
Prog. Brain Res., 162 347
–371
(2007). http://dx.doi.org/10.1016/S0079-6123(06)62017-7 PBRRA4 0079-6123 Google Scholar
H. S. SharmaP.J. Hoopes,
“Hyperthermia induced pathophysiology of the central nervous system,”
Int. J. Hyperthermia, 19
(3), 325
–354
(2003). http://dx.doi.org/10.1080/0265673021000054621 IJHYEQ 0265-6736 Google Scholar
A. GodlewskiH. Wygladalska-JernasJ. Szczech,
“Effect of hyperthermia on morphology and histochemistry of spinal cord in the rat,”
Folia Histochem. Cytobiol., 24
(1), 53
–63
(1986). FHCYEM 0239-8508 Google Scholar
E. A. Kiyatkin,
“Brain hyperthermia as physiological and pathological phenomena,”
Brain Res. Rev., 50
(1), 27
–56
(2005). http://dx.doi.org/10.1016/j.brainresrev.2005.04.001 BRERD2 0165-0173 Google Scholar
M. M. Elwassifet al.,
“Bio-heat transfer model of deep brain stimulation-induced temperature changes,”
J. Neural Eng., 3
(4), 306
–315
(2006). http://dx.doi.org/10.1088/1741-2560/3/4/008 1741-2560 Google Scholar
F. Mannset al.,
“In situ temperature measurements with thermocouple probes during laser interstitial thermotherapy (LITT): quantification and correction of a measurement artifact,”
Lasers Surg. Med., 23
(2), 94
–103
(1998). http://dx.doi.org/10.1002/(ISSN)1096-9101 LSMEDI 0196-8092 Google Scholar
A. AbdoA. ErsenM. Sahin,
“Near-infrared light penetration profile in the rodent brain,”
J. Biomed. Opt., 18
(7), 075001
(2013). http://dx.doi.org/10.1117/1.JBO.18.7.075001 JBOPFO 1083-3668 Google Scholar
H. R. EggertV. Blazek,
“Optical properties of human brain tissue, meninges, and brain tumors in the spectral range of 200 to 900 nm,”
Neurosurgery, 21
(4), 459
–464
(1987). http://dx.doi.org/10.1227/00006123-198710000-00003 0148-396X Google Scholar
J. C. Chato,
“Thermal properties of tissues,”
Handbook of Bioengineering, McGraw Hill, New York
(1987). Google Scholar
M. Johnset al.,
“Determination of reduced scattering coefficient of biological tissue from a needle-like probe,”
Opt. Express, 13
(13), 4828
–4842
(2005). http://dx.doi.org/10.1364/OPEX.13.004828 OPEXFF 1094-4087 Google Scholar
W. Gottschalk,
“Ein messverfahren zur bestimmung der optischen parameter biologischer Gevebe in vitro,”
Univ. Fridriciana, Karlsruhe,
(1992). Google Scholar
A. N. Yaroslavskyet al.,
“Optical properties of selected native and coagulated human brain tissues in vitro in the visible and near infrared spectral range,”
Phys. Med. Biol., 47
(12), 2059
–2073
(2002). http://dx.doi.org/10.1088/0031-9155/47/12/305 PHMBA7 0031-9155 Google Scholar
BiographyAli Ersen received a BS degree in electrical and electronics engineering from Erciyes University, Turkey, in 2006 and an MS degree in the biomedical engineering from New Jersey Institute of Technology, Newark, New Jersey, in 2011. He has been a PhD candidate in Biomedical Engineering Department at New Jersey Institute of Technology, Newark, New Jersey since spring 2012. His research interests include floating microstimulators and neural stimulation in the spinal cord. Ali Ersen is a student member of IEEE/EMBS. Ammar Abdo received a BS degree in biomedical engineering from Hashemite University, Zarqa, Jordan, in 2004 and MS and PhD degrees in biomedical engineering from the New Jersey Institute of Technology, Newark, in 2007 and 2013. Currently, he is a postdoctoral fellow at the University of California, Davis. His research interests include developing microstimulators for neural stimulation applications, and studying the neural mechanisms of flexible decision-making. Mesut Sahin received MS and PhD degrees in biomedical engineering from CWRU in 1993 and 1998. He received a postdoctoral grant from CRPF, and a Whitaker award upon joining Louisiana Tech as an assistant professor in 2001. He moved to New Jersey Institute of Technology in 2005 and was promoted to associate professor in 2009. He has more than 70 peer-reviewed publications. He serves as an associate editor to IEEE Tran. BioCAS. |

