|
|
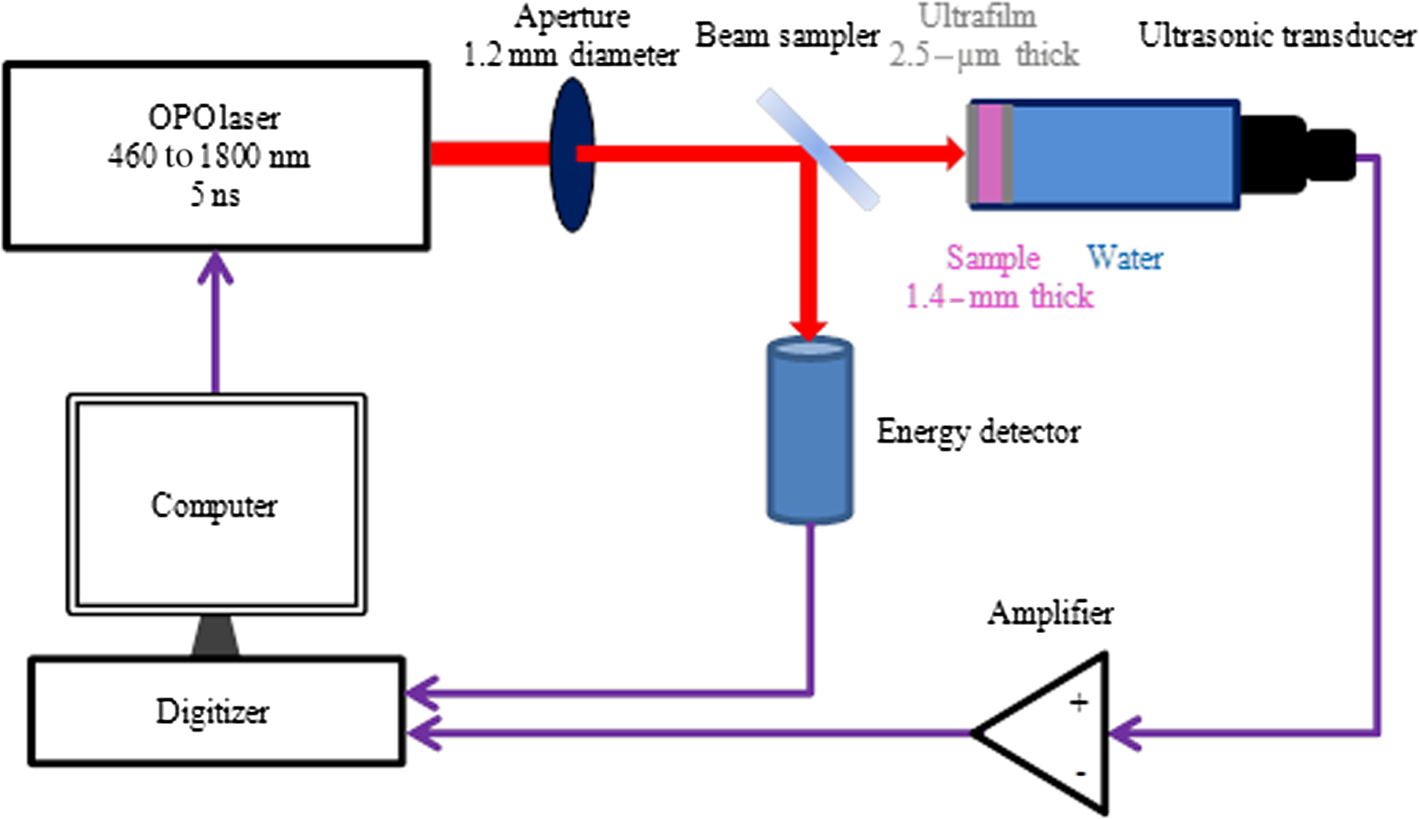
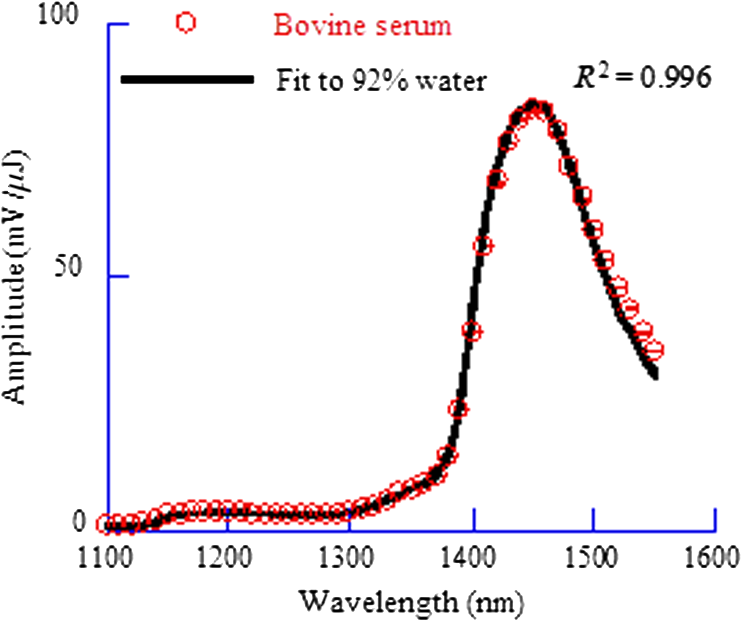
1.IntroductionAs a new biomedical imaging technique, photoacoustic tomography (PAT) is able to noninvasively visualize relatively deep structures in biological tissue.1–3 In PAT, light pulses are delivered into biological tissue. Light absorbed by tissue is converted to heat that generates an initial pressure rise, which produces the acoustic waves used to construct a photoacoustic image. The Grüneisen parameter of tissue relates the initial pressure to the light absorption by the following expression:1,4 , where is the absorption coefficient of tissue, and is the local light fluence. Therefore, quantitative photoacoustic imaging of relies on accurate knowledge of the Grüneisen parameter. The Grüneisen parameter can be expressed as ,1,4 where is the isobaric volume expansion coefficient, is the specific heat, is the acoustic speed, is the isothermal compressibility, and is the mass density. Unfortunately, Grüneisen parameters measured from bulk isobaric thermal expansion may not be valid in photoacoustics in heterogeneous biological media. In pulsed photoacoustics, due to the short heating time, thermal expansion can occur in the immediate vicinity of the optical absorbers, where the tissue’s thermo-mechanical parameters are different from its average bulk parameters as measured by the conventional isobaric thermal expansion method. In addition, Grüneisen parameters were found to vary even within the same type of tissue.5 For example, the Grüneisen parameter of fat tissue is estimated to be between 0.7 and 0.9,5 and that of blood is estimated to be between 0.152 and 0.226,6 causing uncertainty in photoacoustic imaging and errors in inverting for tissue composition from the PAT measurements. So far only a few measurements of the Grüneisen parameter of tissue have been conducted using photoacoustic and photothermal methods.6–8 Soroushian et al.8 measured the Grüneisen parameter of liver tissue using an interferometric method, in which thermal expansion due to light absorption causes sample surface displacement. Once the surface displacement was measured, the Grüneisen parameter was calculated based on Poisson’s ratio of the tissue, its acoustic speed, the optical attenuation depth, and a complicated geometrical correction factor, resulting in relative error.8 Savateeva et al.6 measured the Grüneisen parameter of blood using a photoacoustic method, in which 2090-nm-wavelength light heated water in blood to generate photoacoustic signals. The signals were detected by an ultrasonic transducer with calibrated absolute sensitivity. The absorption coefficient of blood was determined by the temporal profile of the signal, and the Grüneisen parameter was calculated from the signal amplitude. However, the measured Grüneisen parameter6 was significantly lower than the minimal value of the theoretically estimated one. In addition to biological materials, Laufer et al.9 observed linear relations between the Grüneisen parameters of copper and nickel chloride solutions and their concentrations. Photoacoustic pressure wave generation and detection is a complicated process, making quantitative measurements possible only by calibrating the measuring system with homogeneous media that have well-known Grüneisen parameters. However, the relationship between the Grüneisen parameter and the signal detected by the ultrasonic transducer depends on other optical and mechanical parameters of the medium. To account for the potential influences, we apply photoacoustic spectroscopy (PAS)10,11 over a wide optical wavelength range. We chose the wavelength range at the peak absorption of tissue constituents, such as hemoglobin in blood and lipid in fat tissue, to reduce measurement uncertainties due to optical scattering. The difference between our method and the isobaric thermal expansion method lies in the way molecules are heated. Although the isobaric thermal expansion method heats up both the optical absorbers and the interstitial less absorbing material, our method heats up only the optical absorbers. 2.Materials and Method2.1.Photoacoustic SpectroscopyTo acquire photoacoustic spectra of tissue, we assembled a PAS system, shown schematically in Fig. 1. An optical parametric oscillator (OPO) laser system (NT242-SH, Altos Photonics, Bozeman, Montana) emits light pulses at a wavelength tunable from 460 to 1800 nm. The laser pulse repetition rate was 1 kHz, and the pulse duration was 5 ns. The laser beam passed through a 1.2-mm-diameter aperture and a beam sampler (BSF10-B, Thorlabs, Newton, New Jersey), and then irradiated a 1.4-mm-thick tissue sample in the front part of a water-filled cylindrical chamber. The tissue sample was enclosed between two 2.5-μm-thick ultrafilm membranes (01865-AB, SPI Supplies, West Chester, Pennsylvania). The chamber, with a 20-mm-inner-diameter, was fixed horizontally. A flat ultrasonic transducer was installed coaxially with the laser beam at the rear of the chamber and positioned at roughly one acoustic Rayleigh distance from the sample. When a 6-mm diameter, 2.25-MHz ultrasonic transducer (V323-SU, Olympus, Waltham, Massachusetts) was used, its distance from the sample was 19 mm; when a 3-mm diameter, 20-MHz ultrasonic transducer (V316-SM, Olympus) was used, the distance was 33 mm. Each laser pulse reflected from the free sample surface produced a bipolar photoacoustic signal whose amplitude is proportional to the specific optical absorption (i.e., absorbed optical energy per laser pulse per unit volume in ) and the Grüneisen parameter of the tissue. After being detected by the ultrasonic transducer, the photoacoustic signal was amplified by two amplifiers of 56 dB combined gain (ZFL-500LN, Mini-Circuits, Brooklyn, New York). Two photodiode detectors, calibrated by a digital power meter (PM100D, Thorlabs, Newton, New Jersey) with a thermal power sensor (S302C, Thorlabs), were used separately to measure the pulse energy: one (SM05PD2A, Thorlabs) for the 460- to 1050-nm wavelength range and another (SM05PD4A, Thorlabs) for the 1050- to 1800-nm range. Both photoacoustic and photodiode signals were collected by a computer through a 12-bit, 200-MHz digitizer (NI PCI-5124, National Instruments, Austin, Texas). Photoacoustic spectra were acquired by extracting peak-to-peak amplitudes from the photoacoustic signals measured at varied optical wavelength at room temperature (22°C). 2.2.Setup CalibrationThe Grüneisen parameter of tissue was determined by fitting the photoacoustic spectra, which were measured in a wavelength range in which the absorption coefficient of the tissue is much greater than its reduced scattering coefficient. Thus, the effect of optical scattering was negligible. The initial photoacoustic signal generated in planar transmission geometry nearly follows the energy deposition along the acoustic axis within the boundaries of the sample:7 where is the Grüneisen parameter, is the absorption coefficient of the tissue, is the light fluence, is the speed of sound, and is time of acoustic arrival at the ultrasonic transducer. Correspondingly, the peak-to-peak voltage amplitude () of a photoacoustic signal normalized by can be expressed as where is a system calibration factor and is the optical wavelength. The normalized amplitude, , is plotted versus to yield a photoacoustic spectrum. Although independent of , the parameter is affected by the frequency response of the ultrasonic transducer and by many other factors, including light penetration depth, transmittance through interfaces, acoustic diffraction, and acoustic attenuation.7 Estimates show that in our system geometry, the greatest error can be caused by the ultrasonic transducer, which works as a bandpass filter for the acoustic pressure at the transducer surface. By convolving Eq. (1) with the electrical impulse response of the transducer—experimentally measured and then approximated as the first derivative of a Gaussian pulse—one can find that depends on the central frequency of the transducer , approximately following: .To reduce errors in the photoacoustic spectra, the normalized amplitude was acquired by averaging 1000 photoacoustic signals at each wavelength. The acquired photoacoustic spectra of the tissue were linear least-squares fitted to its molar absorption spectra with the Grüneisen parameter being the fitting parameter. To calibrate for the parameter for the 2.25-MHz ultrasonic transducer, we measured the photoacoustic spectrum of water at 22°C from 1100 to 1400 nm, with a 10-nm wavelength step size. A photoacoustic spectrum of water is shown in Fig. 2(a). Knowing the absorption spectrum of water and the Grüneisen parameter of water (0.12 at 22°C),12 we set as a fitting parameter. The solid curve in Fig. 2(a) is a fit to the absorption spectrum of water.13 After measuring three water samples, was calibrated to be a constant of (). Corresponding to Fig. 2(a), Fig. 2(b) shows a plot of the normalized amplitude versus the absorption coefficient, indicating that the normalized amplitude is proportional to the absorption coefficient. Fig. 2Photoacoustic spectra of water used for system calibration. (a) Typical photoacoustic spectrum measured by a 2.25-MHz ultrasonic transducer, in which the normalized amplitude () is plotted versus wavelength. Knowing the absorption coefficient of water and the Grüneisen parameter of water at 22°C (0.12), we fitted Eq. (1) to the photoacoustic spectrum (solid curve), yielding a value of for . (b) Correlation of the normalized amplitude measured by the 2.25-MHz transducer and the absorption coefficient, showing that the normalized amplitude is proportional to the absorption coefficient. (c) Typical photoacoustic spectrum measured at 22°C by a 20-MHz ultrasound transducer. A fit to Eq. (1) yields a value of for . (d) The normalized amplitude measured by the 20-MHz transducer linearly related to the absorption coefficient. 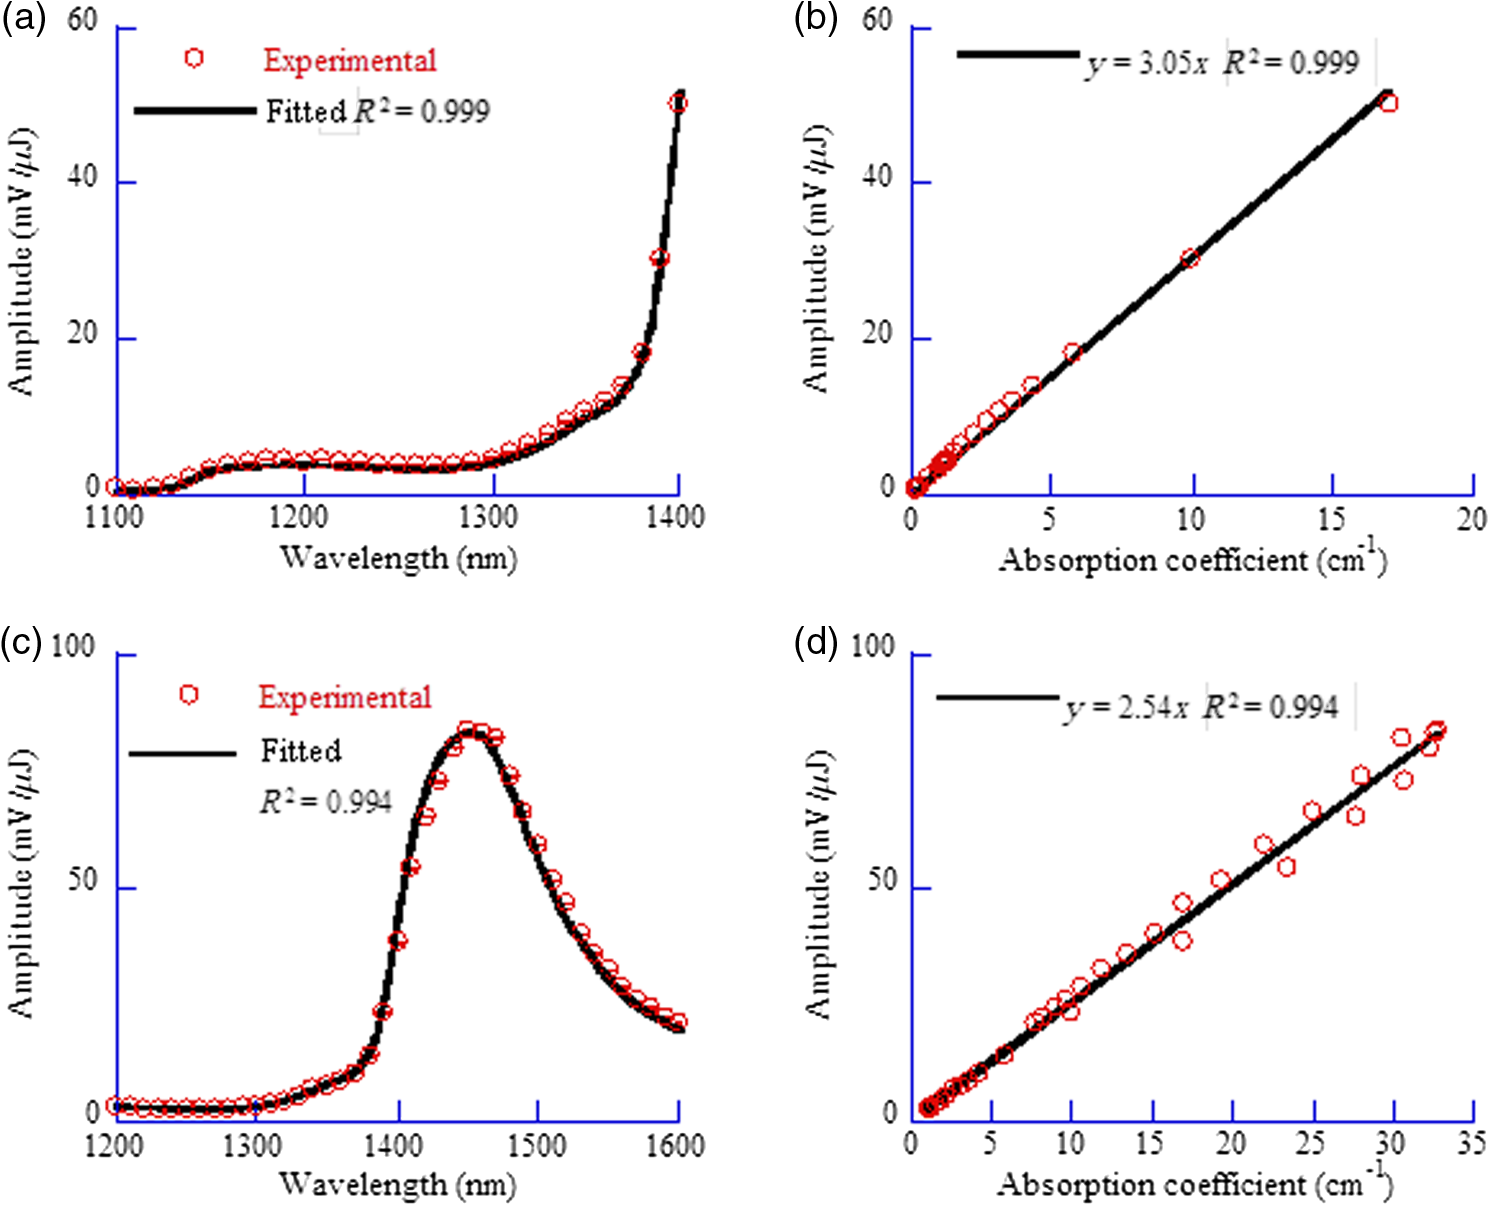 Similarly, we calibrated the PAS system with a 20-MHz ultrasonic transducer. A wavelength range from 1200 to 1600 nm was scanned with a 10-nm wavelength step size. A typical photoacoustic spectrum of water at 22°C is shown in Fig. 2(c), in which the solid curve is a fit to the absorption spectrum of water.13 We scanned five water samples, and found that the constant was (). A correlation between the normalized amplitude and the absorption coefficient is shown in Fig. 2(d), indicating the linearity of the PAS system because for a 20-MHz transducer. 3.Results3.1.Grüneisen Parameter of LipidWe used the PAS system with a 2.25-MHz ultrasonic transducer to measure the Grüneisen parameter of porcine lipid. Lard, i.e., porcine lipid, was melted at 50°C. After being injected into the front part of the chamber shown in Fig. 1, the lipid sample was cooled to room temperature (22°C). An acoustic impedance of 14 was lower than that of water, causing a transmission coefficient to water of 1.03. Photoacoustic spectra of the lipid were measured at a wavelength range from 1680 to 1800 nm, with a 10-nm scan step size. In the wavelength range, the value of the absorption coefficient of lipid is from 1.6 to ,15 and the reduced scattering coefficient is estimated to be .16 In our method, spectral fitting for the Grüneisen parameter is mainly affected by the large-amplitude data points with large , which overwhelms the scattering coefficient. A typical photoacoustic spectrum measured from a sample is shown in Fig. 3(a), in which the solid curve shows a fit to the absorption spectrum of 100% lipid, previously obtained by Anderson et al.15 with a relatively large spectral step size. Our photoacoustic spectrum matches their absorption spectrum very well at wavelengths from 1680 to 1800 nm, except at 1730 nm. Anderson et al. found that 1720 nm was a peak wavelength, but we found that the peak wavelength was 1730 nm, which is consistent with a recent report.17 Therefore, when we fitted the photoacoustic spectrum, we excluded the 1730-nm wavelength. After fitting five lipid samples, we found that the Grüneisen parameter of porcine lipid at 22°C was (). Fig. 3Photoacoustic spectrum of porcine lipid (lard). (a) Typical plot of the normalized amplitude () versus wavelength. The solid curve is a fit to the lipid absorption spectrum reported previously,15 except at the 1730-nm wavelength. (b) Plot of the normalized amplitude () versus the absorption coefficient, showing that the normalized amplitude of lard is proportional to its absorption coefficient. The absorption coefficient of lipid at 1730 nm was calculated to be ().  With the five samples, we estimated the absorption coefficient of lipid at 1730 nm. The normalized amplitude is plotted versus the absorption coefficient, as shown in Fig. 3(b), but the amplitude at 1730 nm is excluded. We found that the absorption coefficient of lipid at 1730 nm was (), instead of as reported by Anderson et al. 3.2.Grüneisen Parameter of Subcutaneous Fat TissueWe used the PAS system with a 2.25-MHz ultrasonic transducer to measure the Grüneisen parameter of fat tissue. Porcine subcutaneous fat tissue with a 16-mm thickness from the loin was cut into 1.4-mm-thick slices. After being attached to the ultrafilm in front of the ultrasonic transducer (Fig. 1), the fat tissue slice was scanned over the wavelength range from 1690 to 1800 nm, with a 10-nm scan step size, except 1730 nm. Since the absorption coefficient of fat tissue in this wavelength range is close to and the reduced scattering coefficient is ,18 the effect of scattering was negligible. Figure 4 shows a typical photoacoustic spectrum of fat tissue at 22°C. The composition of the fat tissue was measured thoroughly. By weight, the porcine subcutaneous fat was composed of () lipid, water, and collagen,19 which is equivalent to a mean volume fraction of 0.83 for lipid () and 0.13 for water () since the lipid density is .20 We calculated the absorption coefficients of fat tissue () in terms of the absorption coefficients of lipid () and water (): .18 The calculated absorption spectrum fits the photoacoustic spectra of fat tissue well. The measurement from one sample is shown in Fig. 4. Using six samples, we found that the Grüneisen parameter of the fat tissue at 22°C was (). 3.3.Grüneisen Parameter of SerumWe used the PAS system with a 20-MHz ultrasonic transducer to measure the Grüneisen parameter of bovine serum. Ten milliliters of defibrinated bovine blood (Quad Five, Ryegate, Montana) was centrifuged at for 20 min. The supernatant was collected to measure the photoacoustic spectrum of bovine serum. We scanned the serum at 22°C at wavelengths from 1100 to 1550 nm, with a 10-nm step size. A typical photoacoustic spectrum of the bovine serum is shown in Fig. 5. Using as a fitting parameter, we found that the serum photoacoustic spectrum matched the absorption spectrum of water well, as shown in Fig. 5. We dried 7.83 g of serum in an isotemp incubator (Fisher Scientific, Pittsburgh, Pennsylvania) at 65°C overnight, and found 0.64 g remaining, indicating that 92% of the serum was water. The 8% remainder consists of proteins, whose absorption coefficient is negligible in the wavelength range. By fitting the photoacoustic spectra of three serum samples to the absorption spectrum of 92% water, we found that the Grüneisen parameter of bovine serum at 22°C was (). 3.4.Grüneisen Parameter of Red Blood CellsWe used the PAS system with a 20-MHz ultrasonic transducer to measure the Grüneisen parameter of bovine red blood cells, collected from defibrinated bovine blood after centrifugation. The cells were washed two times using phosphate buffered saline (PBS; Sigma-Aldrich, St. Louis, Missouri) and then suspended in PBS. We measured the hemoglobin concentration of the cell suspension using a spectrophotometer (Varian Cary 50). After a cell sample was mixed with Drabkin’s solution (Sigma-Aldrich), the hemoglobin concentration was determined by the absorbance of the mixture, which was measured by the spectrophotometer at a 540-nm wavelength. We prepared three cell suspensions, RBC1, RBC2, and RBC3, in which the hemoglobin concentrations were 59.3, 39.6, and , respectively. To oxygenate the red blood cells, we incubated the cell suspensions with oxygen for 1 h. The oxygenated cell suspensions at 22°C were scanned in the wavelength range from 460 to 560 nm, with a 5-nm scan step size. Within the wavelength range, the mean value of the absorption coefficient of oxygenated blood with hemoglobin concentration has been reported to be and the corresponding reduced scattering coefficient is 21, indicating that the effect of scattering is negligible. Figure 6(a) shows three typical photoacoustic spectra of red blood cell suspensions at the different hemoglobin concentrations, where the solid curve, long dashed, and short dashed lines are fits to the absorption spectra of 59.3, 39.6, and oxygenated hemoglobin, respectively.22 After measuring six RBC1 samples, six RBC2 samples, and 10 RBC3 samples, we found that the Grüneisen parameters were () for the cell suspension with hemoglobin at 22°C, for that with , and () for that with , as shown in Fig. 6(b). A linear fit yields the relation of the Grüneisen parameter of red blood cell suspension to its hemoglobin concentration (): Fig. 6Photoacoustic spectra of bovine red blood cell suspension. (a) Typical plots of the normalized amplitude () versus wavelength. The hemoglobin concentrations of the red blood cell suspensions (RBC1, RBC2, and RBC3) were 59.3, 39.6, and . Each curve (solid, long dashed, and short dashed) is a fit to the absorption spectrum of oxygenized hemoglobin. (b) Plot of the Grüneisen parameter () of red blood cell suspension versus hemoglobin concentration. The solid line indicates a linear fit.  4.DiscussionOur measurement is based on the linearity of the normalized photoacoustic signal amplitude to the product of the absorption coefficient and the Grüneisen parameter. However, the linearity can easily fail due to many experimental factors, such as optical scattering,23 finite ultrasonic transducer bandwidth,24 and optical absorption saturation,25 leading to the mismatch of a photoacoustic spectrum to its absorption spectrum. We examined the linearity by fitting the photoacoustic spectrum to the absorption spectrum. In this study, the hemoglobin concentration was , and we obtained a coefficient of determination , as shown in Fig. 6. We used the photoacoustic spectrum with to determine the Grüneisen parameter, greatly reducing uncertainty in the measurement. As mentioned, it is estimated that the Grüneisen parameter of fat tissue is in a range from 0.7 to 0.9.5 We found that the Grüneisen parameter was 0.81 for subcutaneous fat tissue, consistent with the estimation. For blood with hemoglobin, the Grüneisen parameter is estimated to be between 0.152 and 0.226.6 Consistent with that estimation, we estimate using Eq. (2) that the Grüneisen parameter of the blood is 0.16. In our method, the measurement uncertainties in the normalized amplitude, the setup constant, and the absorption coefficient cause uncertainty in the measured Grüneisen parameter. The standard error in the normalized amplitude can be reduced to by averaging. The system error in the calibration can be estimated as follows. Water was used to calibrate our PAS system, but the acoustic attenuation in fat tissue, about ,26 is different from that of water. Since we used a 2.25-MHz ultrasonic transducer to measure 1.4-mm-thick fat tissue samples, the acoustic attenuation in the fat samples caused a 2% decrease in photoacoustic signal amplitude. Another system error may result from the acoustic impedance mismatch between the fat sample and water (acoustic coupling medium). Since the acoustic impedance of fat is ,27 the mismatch caused a 3% increase in photoacoustic signal amplitude, which is larger than the signal decrease caused by acoustic attenuation and partially compensates for it. Correspondingly, the largest error in the Grüneisen parameter of fat tissue is caused by the inaccuracy in the absorption coefficient. Here, the absorption coefficient of the fat tissue was calculated in terms of the absorption coefficients of lipid and water and their volume fractions. Assuming that the uncertainty in the absorption coefficient of the fat tissue comes from the uncertainties in the volume fractions, in which standard errors are 0.0074 for lipid and 0.0052 for water,19 we estimate that the standard error of the Grüneisen parameter is 2.4% for fat tissue. Similarly, the uncertainty in the normalized amplitude and acoustic attenuation is negligible in the red blood cell measurement. The attenuation coefficient of the cell suspension with 5% hematocrit is at 20 MHz,28 and at the frequency the attenuation coefficient of water is .29 We estimate that the difference in acoustic attenuation between the red blood cell sample and water is 0.5%. Therefore, the accuracy in the Grüneisen parameter of the red blood cell suspension is determined by the accuracy of the absorption coefficient of the cell suspension. In this study, we fitted the photoacoustic spectrum to published data of absorption coefficients measured by spectrophotometry, which usually yields a relative standard deviation (). From Eq. (3), we estimate that the relative standard error of the Grüneisen parameter is 2.2% for the red blood cell suspension with hemoglobin. Our results show that the Grüneisen parameter not only varies between different types of tissues, but also changes with different tissue compositions. We found that the Grüneisen parameter of subcutaneous fat tissue at 22°C was 0.81. In the human body, various adipose tissues are found within bone marrow, the brain, breast, colon, and liver, with different lipid percentages. It is very likely that these adipose tissues have different Grüneisen parameters. Precise measurement of the Grüneisen parameter of each adipose tissue will allow us to reconstruct quantitative photoacoustic images of organs. The Grüneisen parameter of blood linearly increases with the hematocrit, and it might be necessary to take this fact into account in photoacoustic imaging of the circulatory system. The Grüneisen parameter of whole subcutaneous fat tissue, 0.81, is greater than that of its either major component, lipid (0.69) and water (0.12). As water and lipid do not mix, they are compartmentalized in fat tissue. Correspondingly, at the optical wavelength at which light is absorbed by lipid, thermal expansion occurs in lipid only. As water is significantly less compressible than lipid, the surrounding water suppresses the expansion of the enclosed lipid, reducing the effective compressibility of the lipid.30 Inversely proportional to the effective compressibility, the measured Grüneisen parameter of fat becomes greater than that of pure lipid. Further, the lower the concentration of lipid is, the greater the Grüneisen parameter of the lipid-water mixture becomes. Similar to the case of lipid, the dependence of the Grüneisen parameter of RBCs on concentration [Eq. (3)] can be partially explained by the fact that the temperature rise is confined to RBCs, which have smaller compressibility ( than plasma () by a factor of 1.3. Correspondingly, the measured Grüneisen parameter must be related to the Grüneisen parameter of RBCs by a factor of ,30 where is the volume concentration of RBCs. Therefore, a higher concentration of RBCs leads to a greater Grüneisen parameter. 5.ConclusionsWe measured the Grüneisen parameter of tissue by applying PAS. Using the photoacoustic spectrum, which linearly fits to its corresponding absorption spectrum, we improved measurement accuracy by precluding nonlinear uncertainties. We found that at 22°C, the Grüneisen parameter was 0.80 for porcine subcutaneous fat tissue and 0.69 for porcine lipid. The Grüneisen parameter of red blood cell suspension was linearly related to hemoglobin concentration, and the parameter of serum was 9% greater than that of water at 22°C. Our method relies on accurate system calibration and a linear relationship between the photoacoustic amplitude and optical absorption. The accuracy of our measurement can be further improved by precisely modeling the systematic errors due to acoustic attenuation, impedance mismatch, etc. This method can potentially be applied to measure the Grüneisen parameters of many other types of tissue, where the optical wavelength ranges should be chosen carefully to ensure that absorption overwhelms scattering. AcknowledgmentsWe thank Prof. James Ballard for his close reading of the manuscript. This work was sponsored in part by National Institutes of Health grants DP1 EB016986 (NIH Director’s Pioneer Award), R01 EB016963, R01 CA134539, U54 CA136398, R01 EB010049, R01 CA157277, and R01 CA159959. L.W. has a financial interest in Microphotoacoustics, Inc. and Endra, Inc., which, however, did not support this work. K.M. has a financial interest in Microphotoacoustics, Inc., which, however, did not support this work. ReferencesM. XuL. V. Wang,
“Photoacoustic imaging in biomedicine,”
Rev. Sci. Instrum., 77
(4), 041101
–041122
(2006). http://dx.doi.org/10.1063/1.2195024 RSINAK 0034-6748 Google Scholar
C. LiL. V. Wang,
“Photoacoustic tomography and sensing in biomedicine,”
Phys. Med. Biol., 54
(19), R59
–R97
(2009). http://dx.doi.org/10.1088/0031-9155/54/19/R01 PHMBA7 0031-9155 Google Scholar
P. Beard,
“Biomedical photoacoustic imaging,”
Interface Focus, 1
(4), 602
–631
(2011). http://dx.doi.org/10.1098/rsfs.2011.0028 2042-8898 Google Scholar
B. Coxet al.,
“Quantitative spectroscopic photoacoustic imaging: a review,”
J. Biomed. Opt., 17
(6), 061202
–061201
(2012). http://dx.doi.org/10.1117/1.JBO.17.6.061202 JBOPFO 1083-3668 Google Scholar
B. T. CoxJ. G. LauferP. C. Beard,
“The challenges for quantitative photoacoustic imaging,”
Proc. SPIE, 7177 131
–139
(2009). http://dx.doi.org/10.1117/12.806788 PSISDG 0277-786X Google Scholar
E. V. Savateevaet al.,
“Optical properties of blood at various levels of oxygenation studied by time-resolved detection of laser-induced pressure profiles,”
Proc. SPIE, 4618 63
–75
(2002). http://dx.doi.org/10.1117/12.469849 PSISDG 0277-786X Google Scholar
A. A. OraevskyS. L. JacquesF. K. Tittel,
“Measurement of tissue optical properties by time-resolved detection of laser-induced transient stress,”
Appl. Opt., 36
(1), 402
–415
(1997). http://dx.doi.org/10.1364/AO.36.000402 APOPAI 0003-6935 Google Scholar
B. SoroushianW. M. WhelanM. C. Kolios,
“Study of laser-induced thermoelastic deformation of native and coagulated ex-vivo bovine liver tissues for estimating their optical and thermomechanical properties,”
J. Biomed. Opt., 15
(6), 065002
(2010). http://dx.doi.org/10.1117/1.3517455 JBOPFO 1083-3668 Google Scholar
J. LauferE. ZhangP. Beard,
“Evaluation of absorbing chromophores used in tissue phantoms for quantitative photoacoustic spectroscopy and imaging,”
IEEE J. Sel. Top. Quantum Electron., 3
(3), 600
–607
(2010). http://dx.doi.org/10.1109/JSTQE.2009.2032513 IJSQEN 1077-260X Google Scholar
Y. Zhouet al.,
“Photoacoustic microscopy of bilirubin in tissue phantoms,”
J. Biomed. Opt., 17
(12), 126019
–126019
(2012). http://dx.doi.org/10.1117/1.JBO.17.12.126019 JBOPFO 1083-3668 Google Scholar
C. Zhanget al.,
“Label-free photoacoustic microscopy of cytochromes,”
J. Biomed. Opt., 18
(2), 020504
–020504
(2013). http://dx.doi.org/10.1117/1.JBO.18.2.020504 JBOPFO 1083-3668 Google Scholar
L. V. WangH. Wu, Biomedical Optics: Principles and Imaging, Wiley, Hoboken, New Jersey
(2007). Google Scholar
L. KouD. LabrieP. Chylek,
“Refractive indices of water and ice in the 0.65- to 2.5-microm spectral range,”
Appl. Opt., 32
(19), 3531
–3540
(1993). http://dx.doi.org/10.1364/AO.32.003531 APOPAI 0003-6935 Google Scholar
G. J. Appleby-Thomaset al.,
“On the dynamic behavior of three readily available soft tissue simulants,”
J. Appl. Phys., 109
(8), 084701
–084706 http://dx.doi.org/10.1063/1.3573632 JAPIAU 0021-8979 Google Scholar
R. R. Andersonet al.,
“Selective photothermolysis of lipid-rich tissues: a free electron laser study,”
Lasers Surg. Med., 38
(10), 913
–919
(2006). http://dx.doi.org/10.1002/(ISSN)1096-9101 LSMEDI 0196-8092 Google Scholar
R. L. P. van Veenet al.,
“Determination of visible near-IR absorption coefficients of mammalian fat using time- and spatially resolved diffuse reflectance and transmission spectroscopy,”
J. Biomed. Opt., 10
(5), 054004
(2005). http://dx.doi.org/10.1117/1.2085149 JBOPFO 1083-3668 Google Scholar
P. Wanget al.,
“Mapping lipid and collagen by multispectral photoacoustic imaging of chemical bond vibration,”
J. Biomed. Opt., 17
(9), 096010
(2012). http://dx.doi.org/10.1117/1.JBO.17.9.096010 JBOPFO 1083-3668 Google Scholar
R. Nachabeet al.,
“Estimation of lipid and water concentrations in scattering media with diffuse optical spectroscopy from 900 to 1600 nm,”
J. Biomed. Opt., 15
(3), 037015
(2010). http://dx.doi.org/10.1117/1.3454392 JBOPFO 1083-3668 Google Scholar
J. D. Woodet al.,
“Backfat composition in pigs: differences between fat thickness groups and sexes,”
Livest. Prod. Sci., 22
(3), 351
–362
(1989). http://dx.doi.org/10.1016/0301-6226(89)90066-3 LPSCDL 0301-6226 Google Scholar
F. FidanzaA. KeysJ. T. Anderson,
“Density of body fat in man and other mammals,”
J. Appl. Physiol., 6
(4), 252
–256
(1953). JAPYAA 0021-8987 Google Scholar
M. Friebelet al.,
“Influence of oxygen saturation on the optical scattering properties of human red blood cells in the spectral range 250 to 2000 nm,”
J. Biomed. Opt., 14
(3), 034001
(2009). http://dx.doi.org/10.1117/1.3127200 JBOPFO 1083-3668 Google Scholar
S. Prahl,
“Optical Absorption of Hemoglobin,”
http://omlc.ogi.edu/spectra/hemoglobin/index.html Google Scholar
J. Lauferet al.,
“In vitro measurements of absolute blood oxygen saturation using pulsed near-infrared photoacoustic spectroscopy: accuracy and resolution,”
Phys. Med. Biol., 50
(18), 4409
(2005). http://dx.doi.org/10.1088/0031-9155/50/18/011 PHMBA7 0031-9155 Google Scholar
M. Sivaramakrishnanet al.,
“Limitations of quantitative photoacoustic measurements of blood oxygenation in small vessels,”
Phys. Med. Biol., 52
(5), 1349
–1361
(2007). http://dx.doi.org/10.1088/0031-9155/52/5/010 PHMBA7 0031-9155 Google Scholar
A. Danielliet al.,
“Picosecond absorption relaxation measured with nanosecond laser photoacoustics,”
Appl. Phys. Lett., 97
(16), 163701
–163703
(2010). http://dx.doi.org/10.1063/1.3500820 APPLAB 0003-6951 Google Scholar
J. R. CookR. R. BouchardS. Y. Emelianov,
“Tissue-mimicking phantoms for photoacoustic and ultrasonic imaging,”
Biomed. Opt. Express, 2
(11), 3193
–3206
(2011). http://dx.doi.org/10.1364/BOE.2.003193 BOEICL 2156-7085 Google Scholar
H. Azhari, Basics of Biomedical Ultrasound for Engineers, WileyIEEE, Hoboken, New Jersey
(2010). Google Scholar
S. H. WangK. K. Shung,
“An approach for measuring ultrasonic backscattering from biological tissues with focused transducers,”
IEEE Trans. Biomed. Eng., 44
(7), 549
–554
(1997). http://dx.doi.org/10.1109/10.594895 IEBEAX 0018-9294 Google Scholar
B. E. Treebyet al.,
“Measurement of the ultrasound attenuation and dispersion in whole human blood and its components from 0–70 MHz,”
Ultrasound Med. Biol., 37
(2), 289
–300
(2011). http://dx.doi.org/10.1016/j.ultrasmedbio.2010.10.020 USMBA3 0301-5629 Google Scholar
W. Schraderet al.,
“Compressibility of lipid mixtures studied by calorimetry and ultrasonic velocity measurements,”
J. Phys. Chem. B, 106
(25), 6581
–6586
(2002). http://dx.doi.org/10.1021/jp014029g JPCBFK 1520-6106 Google Scholar
|