
|
|
1.IntroductionOptical coherence tomography (OCT) is a well-established noninvasive imaging modality for micrometer-resolution cross-sectional visualization of retinal structures.1 Specialized extensions, such as visualization of blood flow, have been developed to enable functional imaging of biological tissues.2 In addition to traditional Doppler OCT imaging, which is sensitive to flow rate,3 techniques have recently been proposed that highlight tissue in motion, but are insensitive to rate; these include speckle variance OCT (svOCT),4 phase variance OCT (pvOCT),5 and optical microangiography.6 Please see the detailed review article on this topic for more information.7 Predominantly, the flow contrast work has been performed in postprocessing. A few notable exceptions have been presented in Refs. 8 and 9, where real-time flow contrast was demonstrated during acquisition in two dimensions as well as in three dimensions. For effective volume acquisition of flow contrast data, real-time visualizations of capillary networks via en face projections of vasculature are highly desirable. In this report, we present GPU-accelerated processing for real-time svOCT acquisition with cross-sectional (B-scan) and en face displays of flow contrast in the retina. We integrated real-time svOCT processing for visualization of mouse retinal vasculature using an 800-nm-range spectral domain OCT (SDOCT) operating at up to 200 kHz. We also incorporated the svOCT processing with a 1060-nm, 100-kHz swept-source OCT (SSOCT) for human retinal imaging, demonstrating the potential for clinical applications in ophthalmology. Last, we introduce the implementation of svOCT GPU in our ongoing open source project.10 2.MethodsReal-time flow contrast imaging requires high-speed acquisition and processing. For the SDOCT, linear interpolation was used to perform wavelength to wavenumber resampling, as detailed in Ref. 11. For the SSOCT, the data was acquired linearly in wavenumber using an external -clock provided by the Axsun source. Physical dispersion compensation was used to match the optical path length for both systems. Only the SDOCT required numerical dispersion compensation, which was implemented on the GPU using the algorithm described in Ref. 12. The software implementations are mostly common to both acquisition systems with only minor differences accounting for the system-level controls. For clarification, the term “BM-scan” is used in this article to indicate a set of multiple B-scans acquired at the same location. For speckle variance imaging, each BM-scan consists of three B-scan frames. The algorithm used to compute each speckle variance frame () from the OCT intensity BM-scans () is where , , and are the index of the frame, width, and axial position within the B-scan, respectively, and is the number of frames per BM-scan.7 In our case, the volume acquisition size was 1024 pixels per A-scan, 300 A-scans per B-scan, and for a total of 900 B-scans (300 BM-scans) per volume.2.1.Mouse ImagingThe mouse retinal data was acquired using a custom-built SDOCT system with a superluminescent diode (Superlum Inc., Moscow, Russia) centered at 810 nm and full width at half maximum of 100 nm. The spectrometer (Bioptigen Inc., Durham, North Carolina) was operated at an adjustable line rate of up to 200 kHz for 1024-point A-scans using a CMOS detector (Basler AG, Ahrensburg, Germany). The volume acquisition size for this system was and was acquired in . The axial resolution was in tissue, and the lateral resolution was in the retina using a beam diameter of 0.5 mm at the pupil. Mouse imaging was performed with ethics approval of the University Animal Care Committee at SFU. 2.2.Human ImagingThe human imaging was performed with a custom-built 1060-nm SSOCT with a line rate of 100 kHz and using a 500MSPS digitizer (AlazarTech Inc., Pointe-Claire, Québec), with 1024 points per A-scan. The details of this system have previously been reported.13 The axial resolution was in tissue, and the lateral resolution was in the retina using a beam diameter of 1.3 mm at the pupil. Retinal images in the foveal region were acquired from a healthy volunteer. The total acquisition time for an entire volume () required . 2.3.ProcessingWe used our custom GPU program, previously presented in Ref. 11, as the basis for implementing svOCT. For development, we used CUDA Toolkit 5.0 and Microsoft Visual C++ 2008 on a 64-bit Windows 7 operating system. For human imaging, we used a GeForce GTX-680 GPU and an Intel Core i7-3820 CPU. For mouse imaging, we used a GeForce GTX-Titan and an Intel Core i7-2600k CPU. The difference in hardware was solely due to the component availability at the time the systems were constructed. Our previous report described the structure of the program and GPU-processing steps for SDOCT and SSOCT, including our approach for batch processing.11 For svOCT processing, we selected a batch size of 30 frames of raw data (10 BM-scans), transferred the batch to GPU, executed the Fourier domain OCT (FDOCT) batch-processing pipeline, and launched the speckle variance kernel which batch processed the variance of the speckle intensity for the entire OCT data.14 An en face projection image was extracted from the selected region for visualizing the svOCT data. Additionally, the GPU was used for real-time display of the images including the svOCT B-scan, the original en face image, and the svOCT en face image. In order to enhance the visualization quality of the blood vessels, a Gaussian filter was implemented to smooth the en face svOCT image. For the target application of retinal imaging in both human and mouse, the program extracts flow contrast data from up to three user-selected depth regions, processes an en face projection for each region, and combines all three projections into a superimposed and R/G/B color-coded en face projection. A notch filter and single-pixel rigid registration of the BM-scans were implemented on the GPU to reduce motion artifact in the svOCT image, but was only used for human retinal imaging with a larger field of view (). Details of the complete svOCT implementation can be found in the source code.10 3.Results and DiscussionIn our previous report, we presented processing rates for the SDOCT-processing pipeline using the Geforce GTX-680 GPU.11 In this article, the later-generation GTX-Titan was used for benchmarking and provided an increase in the SDOCT-processing rate from 1.1 to 1.9 MHz and the SSOCT-processing rate from 2.2 to 3.2 MHz. The entire processing pipeline for the spectral domain svOCT was captured in NVIDIA Visual Profiler for a single batch and is shown in Fig. 1. This profiler timeline includes the standard SDOCT kernels [i.e., linear interpolation, DC subtraction, dispersion compensation, fast Fourier transform (FFT), and post-FFT], the speckle variance kernel, and the Gaussian filter kernels. For a B-scan size of and a batch size of 30 B-scans, the overall processing and display times take and equate to an overall processing and display rates of . Note from Fig. 1 that approximately one third of the overall processing timeline is used for display; this represents the required time to upload OpenGL textures from the GPU onto the monitor. For matching ultrahigh acquisition rates , a possible method to mitigate this delay is by implementing a multi-GPU solution, where one GPU is dedicated for rendering and display purposes only, whereas the other(s) are dedicated for heavy computational kernels.15 For the SSOCT pipeline, neither -resampling nor dispersion compensation was implemented; the overall svOCT processing and display rates on the GTX-Titan were . For image acquisition with a larger field of view, the added processing steps (predominantly the registration) decreased the overall processing and display rates to 460 kHz, which is still beyond the acquisition speed of most OCT systems. Fig. 1Representative NVIDIA Visual profiler timeline for a single-svOCT iteration of the SDOCT pipeline (GTX-Titan GPU) is separated into three components: a series of kernels for SDOCT processing, speckle variance kernel with en face rendering kernels, and idle time for display. 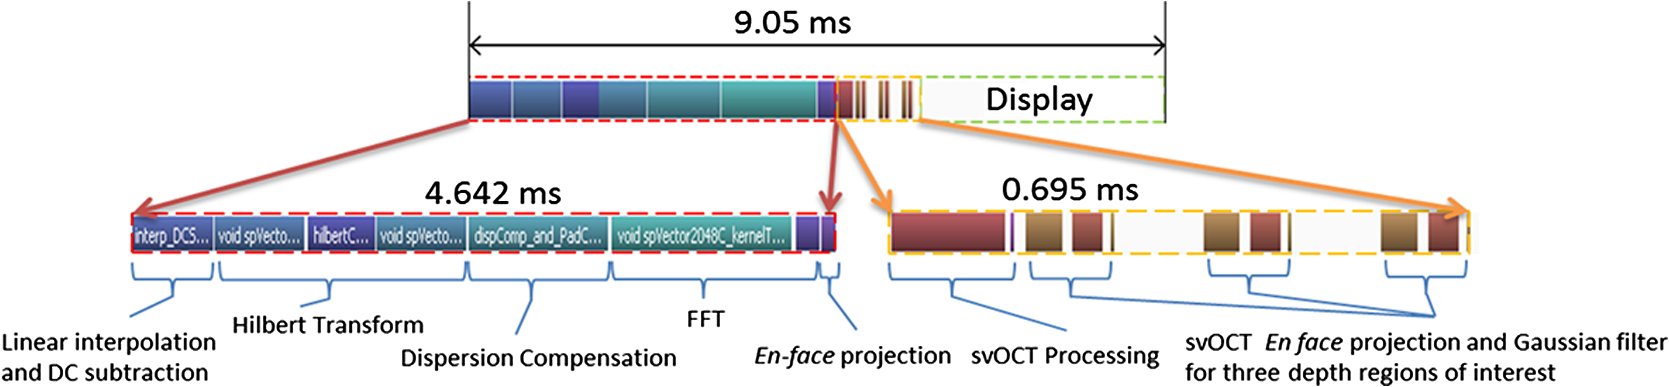 3.1.Mouse ImagingThe representative images in Fig. 2 were acquired over an area of in a mouse retina with an acquisition time of . For each row, the left column displays the cross-sectional scan at the location of the red line selected on the en face intensity image in the middle column. The user dynamically selects the regions of interest, and the corresponding intensity and svOCT en face images are generated using sum-voxel or maximum intensity projection. This approach assumes a flat field of view throughout the volume (i.e., negligible curvature). In Figs. 2(a), 2(d), and 2(g), the regions of interest were selected from the nerve fiber layer (NFL)/ganglion cell layer (GCL), the inner plexiform layer (IPL), and the outer plexiform layer (OPL), respectively. In Figs. 2(j)–2(l), three user-selected regions of interest on the svOCT B-scan are distinguished using color-coded lines, and the color-coded image represents the superimposed svOCT en face projections of all three vascular layers. Comparison of the intensity en face (center column) with the svOCT en face (right column) images reveals a significant contrast improvement for blood vessels with svOCT; for example, capillaries from the NFL/GCL are barely visible in Fig. 2(b) but are clearly distinguishable in Fig. 2(c). To demonstrate the real-time acquisition and display capabilities for spectral domain svOCT in mouse retina, the mouse alignment was adjusted during acquisition in Video 1. The color of the vascular layers in the en face images changes as they pass through the user-selected depth regions. Fig. 2The svOCT B-scan images in (a, d, g) illustrate the selected depths of interest for an area of ; the intensity en face images are presented in (b, e, h); and the svOCT images are presented in (c, f, i). The B-scan (j) presents a color-coded combination of (a, d, g), where each color represents: NFL/GCL—blue, IPL—green, and OPL—red. The combined intensity en face image of all depth regions of interest is presented in (k), and the superimposed color-coded svOCT en face image is presented in (l). Video 1 presents real-time svOCT for mouse (Video 1, QuickTime, 10.3 MB) [URL: http://dx.doi.org/10.1117/1.JBO.19.2.026001.1]. The window title bar indicates the batch processing and display rates in frames per second (FPS).  3.2.Human ImagingRepresentative flow contrast images of retina acquired on human volunteers are presented in Fig. 3. The svOCT en face images show well-defined capillary networks in the retina with depth encoded via color-coding. Video 2 is a demonstration of real-time svOCT from a healthy human subject using a four-panel display to show only a single region of interest for clarity. Fig. 3Comparison between the intensity en face images (a, c, e, g) and the color-coded svOCT en face images (b, d, f, h), respectively. Images (a–d) were acquired at the optic nerve head region, and images (e–h) were acquired in the macula. Field-of-view: (a, b) , (c, d) , (e, f) , and (g, h) . A representative video for human imaging is presented in Video 2 for an area of and (Video 2, QuickTime, 8.4 MB) [URL: http://dx.doi.org/10.1117/1.JBO.19.2.026001.2].  4.ConclusionWe have demonstrated real-time flow contrast imaging on two separate systems for human and mouse retinal imaging. This technology has high potential for clinical applications including imaging of retinal angiography. Blood vessels are often seen in OCT intensity images with difficulty, such as in the NFL and IPL; therefore, implementing svOCT enhances the contrast for visualizing both large and small vessels. The simplicity of the svOCT processing lends itself to real-time imaging, where flow contrast is important to study various diseases affecting the retinal vasculature, e.g., diabetic retinopathy, ischemia, etc. Another possible application of this code is to use svOCT to facilitate the alignment to the same location on the retina based on visualization of the blood vessels in longitudinal studies. In addition, more computationally intensive algorithms can be used in postprocessing for retrieving potentially higher-contrast images such as the pvOCT technique. We demonstrated the visualization of the capillary network in human retina with our svOCT over an area of . In order to increase the field of view, more A-scans need to be acquired at a faster rate to maintain the same resolution while mitigating motion artifact. For our current system, a simple extension of tiled acquisition and mosaicking of adjacent volumes would also permit acquisition over larger areas.16 Other simple techniques could also be used to limit subject motion such as incorporating a fixation target and a bite bar. In conclusion, we have demonstrated the overall svOCT processing and en face display rates, using 1024-point A-scans, at up to 1 MHz for SDOCT and 1.1 MHz for SSOCT with GTX-Titan. The microvasculature in the retina is clearly distinguishable with the addition of the speckle variance kernel. The ultrahigh speed processing rates that we have demonstrated provide opportunities to implement GPU-based image-processing algorithms to further enhance the visualization quality for the blood vessels in the en face images. The applications of real-time svOCT are numerous such as monitoring progressive changes to retinal vessels in diabetic retinopathy in ophthalmology and visualizing blood vessel networks in cancer research.17 The GPU used in this research is inexpensive, and the complete svOCT pipeline can easily be integrated into practical FDOCT systems for use in a clinic. The source code that includes transferring interferometric data from the host to the GPU, processing, and displaying of svOCT, is available as a part of our open source project.10 AcknowledgmentsFunding for this work was generously provided by the Michael Smith Foundation for Health Research (MSFHR), Natural Sciences and Engineering Research Council of Canada (NSERC), Canadian Institutes of Health Research (CIHR), and the Foundation Fighting Blindness (FFB). ReferencesW. DrexlerJ. G. Fujimoto,
“State-of-the-art retinal optical coherence tomography,”
Prog. Retinal Eye Res., 27
(1), 45
–88
(2008). http://dx.doi.org/10.1016/j.preteyeres.2007.07.005 PRTRES 1350-9462 Google Scholar
M. Wojtkowski,
“High-speed optical coherence tomography: basics and applications,”
Appl. Opt., 49
(16), D30
–D61
(2010). http://dx.doi.org/10.1364/AO.49.000D30 APOPAI 0003-6935 Google Scholar
M. AdhiJ. S. Duker,
“Optical coherence tomography—current and future applications,”
Curr. Opin. Ophthalmol., 24
(3), 213
–221
(2013). http://dx.doi.org/10.1097/ICU.0b013e32835f8bf8 COOTEF 1040-8738 Google Scholar
A. Mariampillaiet al.,
“Optimized speckle variance OCT imaging of microvasculature,”
Opt. Lett., 35
(8), 1257
–1259
(2010). http://dx.doi.org/10.1364/OL.35.001257 OPLEDP 0146-9592 Google Scholar
J. Fingleret al.,
“Volumetric microvascular imaging of human retina using optical coherence tomography with a novel motion contrast technique,”
Opt. Express, 17
(24), 22190
–22200
(2009). http://dx.doi.org/10.1364/OE.17.022190 OPEXFF 1094-4087 Google Scholar
R. K. Wanget al.,
“Depth-resolved imaging of capillary networks in retina and choroid using ultrahigh sensitive optical microangiography,”
Opt. Lett., 35
(9), 1467
–1469
(2010). http://dx.doi.org/10.1364/OL.35.001467 OPLEDP 0146-9592 Google Scholar
M. S. Mahmudet al.,
“Review of speckle and phase variance optical coherence tomography to visualize microvascular networks,”
J. Biomed. Opt., 18
(5), 050901
(2013). http://dx.doi.org/10.1117/1.JBO.18.5.050901 JBOPFO 1083-3668 Google Scholar
K. K. C. Leeet al.,
“Real-time speckle variance swept-source optical coherence tomography using a graphics processing unit,”
Biomed. Opt. Express, 3
(7), 1557
–1564
(2012). http://dx.doi.org/10.1364/BOE.3.001557 BOEICL 2156-7085 Google Scholar
P. Sylwestrzaket al.,
“Four-dimensional structural and Doppler optical coherence tomography imaging on graphics processing units,”
J. Biomed. Opt., 17
(10), 100502
(2012). http://dx.doi.org/10.1117/1.JBO.17.10.100502 JBOPFO 1083-3668 Google Scholar
J. Xuet al.,
“GPU open source code with svOCT implementation,”
(2014) http://borg.ensc.sfu.ca/research/svoct-gpu-code.html January ). 2014). Google Scholar
Y. Jianet al.,
“Graphics processing unit accelerated optical coherence tomography processing at megahertz axial scan rate and high resolution video rate volumetric rendering,”
J. Biomed. Opt., 18
(2), 026002
(2013). http://dx.doi.org/10.1117/1.JBO.18.2.026002 JBOPFO 1083-3668 Google Scholar
M. Wojtkowskiet al.,
“Ultrahigh-resolution, high-speed, Fourier domain optical coherence tomography and methods for dispersion compensation,”
Opt. Express, 12
(11), 2404
–2422
(2004). http://dx.doi.org/10.1364/OPEX.12.002404 OPEXFF 1094-4087 Google Scholar
M. Younget al.,
“Real-time high-speed volumetric imaging using compressive sampling optical coherence tomography,”
Biomed. Opt. Express, 2
(9), 2690
–2697
(2011). http://dx.doi.org/10.1364/BOE.2.002690 BOEICL 2156-7085 Google Scholar
A. Mariampillaiet al.,
“Speckle variance detection of microvasculature using swept-source optical coherence tomography,”
Opt. Lett., 33
(13), 1530
–1532
(2008). http://dx.doi.org/10.1364/OL.33.001530 OPLEDP 0146-9592 Google Scholar
K. ZhangJ. U. Kang,
“Real-time intraoperative 4D full-range FD-OCT based on the dual graphics processing units architecture for microsurgery guidance,”
Biomed. Opt. Express, 2
(4), 764
–770
(2011). http://dx.doi.org/10.1364/BOE.2.000764 BOEICL 2156-7085 Google Scholar
H. C. Hendargoet al.,
“Automated non-rigid registration and mosaicing for robust imaging of distinct retinal capillary beds using speckle variance optical coherence tomography,”
Biomed. Opt. Express, 4
(6), 803
–821
(2013). http://dx.doi.org/10.1364/BOE.4.000803 BOEICL 2156-7085 Google Scholar
L. Conroyet al.,
“Quantifying tissue microvasculature with speckle variance optical coherence tomography,”
Opt. Lett., 37
(15), 3180
–3182
(2012). http://dx.doi.org/10.1364/OL.37.003180 OPLEDP 0146-9592 Google Scholar
BiographyJing Xu graduated from Yangzhou University in 2005 with a BS degree in electronics engineering. She received a M.A.Sc. degree in biomedical engineering in 2010 and is currently a PhD candidate with the Biomedical Optics Research Group at Simon Fraser University. Her research interests include extending the potential of graphics processing units for accelerating functional OCT processing pipelines into clinical ophthalmic applications, such as age-related macular degeneration and diabetic retinopathy. Kevin Wong received a B.A.Sc. (honors degree) in biomedical engineering at Simon Fraser University (SFU) in 2013, and he is pursuing a master’s degree with the Biomedical Optics Research Group at SFU. He developed his interest in computing with graphics processing units during his undergraduate thesis project on the acceleration and visualization of FDOCT processing. His graduate research concentrates on further extending massively parallel processing capabilities on novel variations of OCT. Yifan Jian is currently pursuing his PhD degree in the Biomedical Research Optics Group, Simon Fraser University, under Dr. Marinko V. Sarunic’s supervision. He developed the wavefront sensorless AO-OCT and GPU accelerated real-time OCT data processing and volumetric rendering. His main research focus is novel biophotonics applications such as optical coherence tomography. He is also interested in medical image processing such as compressive sampling (CS) OCT and volumetric registration. |


