|
|
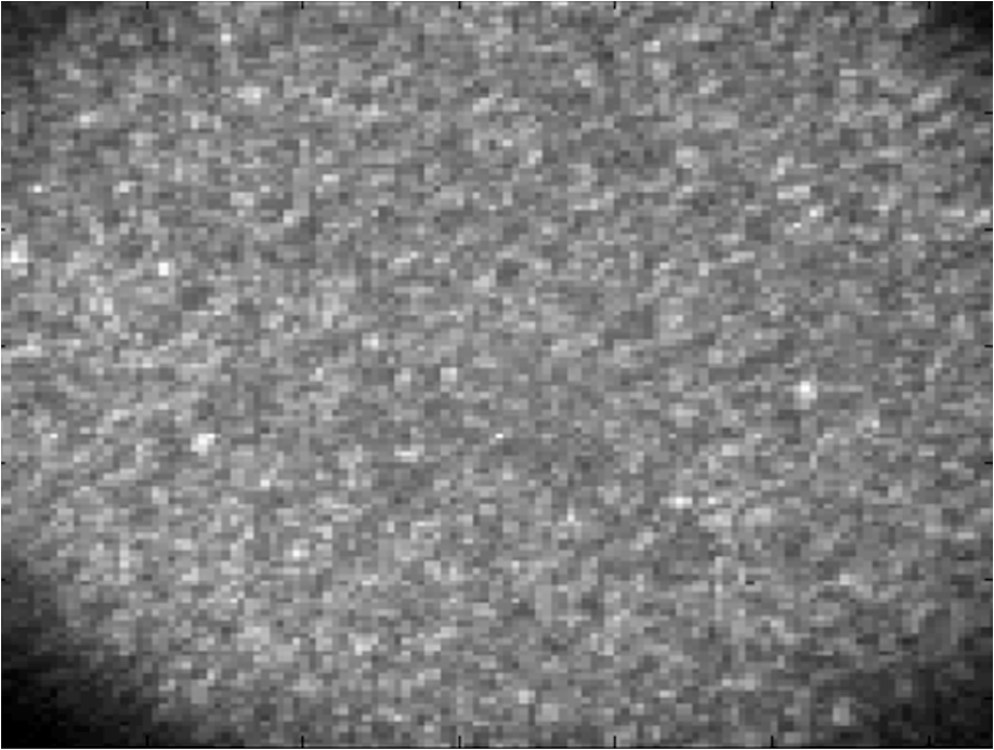
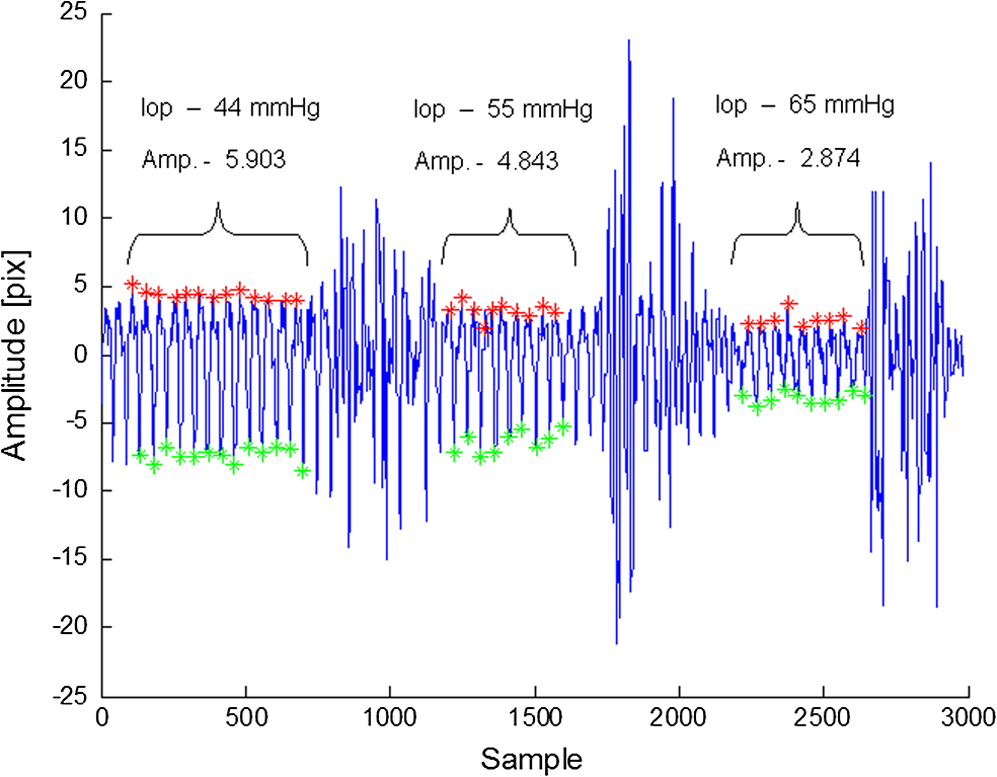
1.IntroductionGlaucoma is the second most common cause of irreversible blindness worldwide and the most common cause in Asia.1 The disease is characterized by increased intraocular pressure (IOP) that may eventually cause to irreparable damage to the optic nerves, resulting in permanent loss of vision.2,3 The only effective method for treating glaucoma involves pharmacological or surgical reduction of IOP, which rises and falls dynamically with changes in muscle tone and physiological state.4 Although a significant percentage of glaucoma patients provide normal tension values diurnal curve monitoring,5 accurate monitoring of IOP still remains as a very important clinical factor in glaucoma care. Although many significant clinical decisions rely on IOP, current methods effectively limit its measurement to only a few times daily. Though introduced decades ago,6 the applanation tonometer remains the most commonly used ophthalmic device for measuring IOP.7,8 The force required to achieve a fixed degree of applanation (3.06 mm in diameter) when the tonometer head directly applanates the cornea is converted into millimeters of mercury (mmHg), providing a measurement of the IOP resisting this deformation. Despite its accuracy and precision,9 the tonometer suffers from interindividual variations in corneal thickness and rigidity. Its invasive (contact) nature also necessitates the use of anesthetic eye drops, limiting in its ability to monitor IOP over time. One alternative involves measurement of the area of applanation when a given constant force is applied to the eye, for example by administering a standard blast of air into the eye from a given distance and measuring the time to applanation of the cornea.10 This procedure avoids physical contact but it is also impractical for monitoring IOP during extended periods of time, since it also fails to identify peaks and IOP variations between measurements. The limitations of the single measurement working principle of classical tonometers have encouraged researchers to develop ways to monitor IOP continuously. Examples include the use of contact lenses,11,12 implants with telemetric pressure transducers,13–16 and other devices based on optical principles.17–20 Recently, a special configuration has demonstrated the ability to sense remote speech signals, heart beats, and vibrations from remote objects using reflected secondary speckle patterns.21,22 The system contains a regular camera with conventional optics and a laser source. As the laser illuminates the region of interest, reflections from the illuminated surface build selfinterference speckle patterns on the camera’s detector. The camera must be slightly defocused to convert the tilting movement of the inspected surface into transversal movement of the speckle patterns.22 This is a remarkable property that causes the speckle pattern to be constantly changing in relation with the vibration of the illuminated object and distinguishes the proposed technique from other speckle-related approaches in which the patterns vary in a noncontrollable manner. Shifts in the constant speckle pattern caused by vibration of the illuminated object can be tracked using a correlation-based algorithm, allowing information regarding the object’s movement to be attained. Previous studies have shown that heartbeats,22,23 blood pulse pressure,24 and glucose25 and alcohol26 concentrations can be estimated from a distance using this secondary speckle-based photonic system. Moreover, the technology has recently been validated in preliminary experiments as a promising technique for automated high rate detection of malaria-infected red blood cells27 and for measuring the contractions of a high concentration sample of cardiac myocytes in a culture.28 In the current study, we apply our technology to validate proof of principle for using the measurement concept described above to continuously monitor IOP in a remote and noninvasive manner. Although the basic layout and underlying principle have been previously introduced,29 the proposed manuscript improves the characterization of the proposed methodology by providing more measurement points and additional graphs to enable better interpretation of the data. Essentially, the developed technology monitors the vessel pulsation of the eye’s retina through the reflection of the laser beam at the iris/sclera. Such reflected light beats with the blood supply to the eye and the IOP changes will introduce small modifications on the way that the light becomes reflected. Since our technology is able to detect nanometric scale movements,30 it will monitor very tiny modification in the secondary speckle generated by reflection in the iris/sclera. Those variations can be translated to IOP values after proper calibration. 2.Materials and Methods2.1.Brief Background of the Proposed TechnologyThe proposed technology applied here to monitor IOP was first patented21 and validated22 for dynamic extraction of remote sound signals. Following proper digital processing of the recorded images, the method enables the extraction and separation of remote sound sources from distances of up to a few hundreds of meters. Essentially, a laser illuminates the measurement area and back-reflections are captured by a CMOS camera. As the illuminated surface can be considered a rough surface, back-reflections are recorded in the form of speckle patterns (or simply speckles) of the coherent illumination beam. A speckle pattern is a random intensity pattern produced by the self-interference of a set of wavefronts of the same wavelength with different phases and amplitudes (differences are generated due to the roughness of the back-reflecting surface.) When added together on the CMOS detector plane after passing through the imaging optics, the wavefronts provide a random intensity pattern due to the interference phenomenon, resulting in speckle patterns, or randomly distributed intensity patterns containing dark and bright grains or spots. Speckles can be obtained either through free-space propagation or from an imaging system. The former type is known as a primary or objective speckle and can be obtained, for instance, when the laser beam is scattered by a first rough surface before reaching the back-reflecting surface. The latter, known as a secondary or subjective speckle, can be obtained by producing an image of the rough surface directly illuminated by the laser beam on a screen (or CMOS, in our case). The working principle underlying our proposed technology involves tracking secondary speckles that are back reflected by the inspected surface, which changes due to tilts, vibrations, and rotations generated by internal or external factors. To convert these tilts into something that can be measured and traced through analysis of recorded speckle patterns, the imaging optics must be slightly defocused; otherwise, the speckles will change very quickly in an uncorrelated manner, making it impossible to extract useful information. In the proposed method, the lack of focus allows changes in the inspected surface to be converted into transversal motions of a constant speckle pattern, such that shifts of the speckle pattern can be tracked by a correlation-based algorithm over the recorded images. Finally, the information provided by image correlation is directly associated with the change in the inspected surface. Clearly, the required temporal sampling rate of the CMOS camera must correspond with the Nyquist rule of sampling (twice the relevant bandwidth of the sampled temporal signal). 2.2.Underlying Principle of the Proposed Method for IOP MonitoringTo obtain remote estimations of IOP, both the temporal frequency and the amplitude of the movement of the speckle pattern reflected by the iris (and/or sclera) are analyzed. The camera must be focused not on the inspected surface, but rather on a close or far field, such that the object itself is not in focus. Thus, the object’s vibrations cause a lateral shift of the secondary speckles. Due to the lack of focus, instead of constantly changing the speckle pattern, the movement of the object results in the same speckle pattern moving or vibrating in the transversal plane. This feature is extremely significant, as it allows the trajectory of movement to be extracted by tracking the maximum intensity of the spots. The relative shift of speckle pattern due to the displacement of the reflecting surface (sclera or iris in our case) can be estimated as23 where is proportional to the relative shift of the speckle pattern, is the tilting angle of the iris/sclera, and is the optical wavelength. Assuming that the change in the angle is small enough, a linear proportion between the relative shift and the angle of tilting is obtained.Note that Eq. (1) is a general equation describing the change in the position of speckle pattern in far field versus the tilting angle of the back reflecting surface. The mathematical proof for this relation was shown in Ref. 23 but its explanation is that if the far field condition is fulfilled, then tilting, which is expressed as linear phase factor in the object plane, causes a shift in the far field as it is the spatial Fourier transform plane. In this study, we show that it is possible to track temporal changes in IOP using information from the relative shift of the speckle pattern and its amplitude change, i.e., the temporal variation of .29 Our basic assumption, which we previously showed with respect to the radial artery of the wrist,23,24 is that the blood pressure in the blood vessels of the retina affects the movement of the sclera and iris in a way that is correlated to the IOP. Thus, the sclera/iris slightly pulsates due to the blood supply to the eye. This movement, though extremely small, can be detected by our speckle-based measurement system, since the movement precision that our technique can allow is in the nanometric scale.30 It is important to emphasize that what we do not measure direct movements of the iris or the eye, and in fact aim to filter them out by performing measurements over sufficiently short time scales. 2.3.AnimalsSix-month old rabbits (Oryctolagus cuniculus) were selected as they are easy to handle, accessible, and inexpensive. Although not participating in the experiments, the rabbits were kept in a safe, quiet, clean, and well-ventilated room and allowed free access to food (green vegetables, leaves, and grain) and water. For the experiments, the rabbits were anesthetized using intramuscular injections of mixed ketamine () and xylazine () for the duration of 1 h per experiment. The four (8 eyes) anaesthetized rabbits involved in the study were handled in accordance with the Association for Research in Vision and Ophthalmology statement for the use of animals in ophthalmic and vision research. Due to the rabbits’ reduced blood pressure while anaesthetized and the need to measure the IOP based on pulsation of the sclera or the iris, the rabbits were tilted with their heads down. The entire process was supervised by medical eye doctors. 2.4.Experimental SetupWe conducted two different sets of experiments. The first setup involved an infusion set connected to the vitreous cavity of the rabbit’s eyes via a 25-gauge needle, allowing IOP to be controlled by raising or lowering the infusion bag with respect to the position of the inspected rabbit [see Fig. 1(a)]. The needle was inserted and fixed so as not to touch the cornea, lens, or iris. We used neutral eye drops to avoid dryness of the sclera and cornea. The second experimental setup was built to verify the results of the first. In the second setup, cotton swabs were used to stress the eye mechanically, thereby elevating IOP [see Fig. 1(b)]. The experiments were performed with different animals and on different days. Fig. 1The proposed experimental configurations for remote photonic sensing and for controlled elevation of the intraocular pressure (IOP): (a) elevating the IOP using an infusion bag and (b) elevating the IOP using mechanical pressure.  The two experimental setups required different angles between the eye, the camera, and the laser. It should also be noted that in the second setup, we experienced limitations in our ability to raise IOP to high levels without injuring the rabbits’ eyes. The optically-based monitoring device was positioned 20 cm from the rabbit’s eye. In both setups, the system used only a fast camera and a laser to monitor the secondary speckle patterns reflected from the rabbit’s iris or sclera and track the trajectory of their movement over time. To illuminate the iris, a second harmonic of a CW (continuous) Nd:YAG laser (532-nm wavelength) was used and reflections were analyzed using a “PixelLink” B-771 digital camera. The camera’s focal length was 50 or 55 mm (depending on the experiment) with an F-number of 3. The illuminating beam was 3 mm in diameter. The focusing was performed on a focal plane that fulfils the far field conditions of diffraction applied in respect to the back reflecting surface that in our case was the sclera. Specifically, in our experiment the focusing plane was a few meters away from the sclera. Each frame of the camera’s output showed a secondary speckle pattern (as shown in Fig. 2) rather than an in-focus image of the rabbit’s iris. Each frame was correlated to the next frame using a Matlab program (The MathWorks, Inc., Massachusetts). We extracted the position of the correlation peak and plotted its time varying position as depicted in Fig. 3 where amplitude (the vertical axis) denotes the shift in the position of the correlation peak in pixel units of the camera. All relative movements are cumulatively summarized for extracting the total movement vector. After performing the correlation operation, the and components of the movement of the correlation peak are extracted. The total movement includes a large (in amplitude) and slow drifting movement as well as a faster movement around the general drift trajectory. We filter out the drift using frequency domain filtering and only the faster vibrations around the general drift trajectory are taken into account. Then, we have chosen the or the component of the remaining fast movement for the plots depending on the amount of significant information (amplitude variation) included at each component. Note that the same measurement can be achieved using an eye-safe laser at a wavelength in the near infra-red range and a camera sensitive to that wavelength (the camera involved must also have sensitivity in the infra-red range). In addition and although the results presented in this article are based on illumination of the iris, we have also conducted experiments while illuminating the sclera and have obtained similar results. 2.5.Experimental ProcedureThe two previously described approaches used to modify IOP are detailed below. In the first approach, the rabbit’s IOP was varied by changing the elevation of the infusion bag. It is known that pressure difference is proportional to elevation difference and can be estimated as where is the density of the infusion liquid, the gravity acceleration, and is the elevation difference between the position of the infusion bag and the rabbit’s eye.Several measurements were performed to test and improve the performance of our photonic device. The acquisition frequency rate of the imaging device was changed between 100 and to examine the effect of frame rate on the quality of received information as e.g. seen in Fig. 4 (correlation between speckle patterns and amplitude level) and consequently on the results (see next section). In addition, some of the measurements were taken separately, i.e., not in a continuous manner along the time axis (as it is the case included in Fig. 5), while others were obtained using a continuous monitoring mode (see results included in Fig. 3). For all experiments, the current to the laser was 0.2 A, resulting in an illumination power of about 2 mW, which is higher than the required minimal power. All experiments were repeated over twenty times for each parameter. As stated above, to demonstrate the validity of our new measurement system, we considered an additional method, in which IOP was manipulated by pressing on the eye of the examined rabbits with a swab. Thus, the eye is not cannulated, allowing IOP oscillations associated with blood flow to be present in the measurements. 3.ResultsIn all experiments, we found an inverse relationship between the IOP measured by an external device and the height of the amplitude observed by our novel optical means. Please note that by height of the amplitude, we refer to peak value in respect to zero and not to peak to peak amplitude. To understanding how the amplitude values were extracted, we present an example of the readout obtained from one of the experiments in which IOP was varied by changing the height of the infusion bag (Fig. 3). The figure presents the relationship between the measured amplitude obtained using our photonic device and the IOP in mmHg units computed according to Eq. (2). The graph shows the pulsation amplitude (vertical axis) measured from the reflections from the iris while the elevation of the infusion bag was changed every samples (horizontal axis). The measured amplitude for each infusion bag height is computed as half of the average difference between the maximum (red points) and minimum (green points) values of the reflected pulsation. Note that high amplitude artefacts appear between the measurement ranges due to the elevation change of the infusion bag. Experimental results involving the comparison between our photonic device and the conventional Goldmann tonometer are presented in Fig. 4. Figure 4(a) presents measurements from an experiment in which we raised the IOP to high levels (above 40 mmHg) using an infusion bag. In this case, we used two sampling rates, 100 and , and monitored continuously. The figure shows the difference in results between the two sampling rates. In Fig. 4(b), we present the results of the second experimental method, raising the IOP with a swab. Note that the amplitude values are smaller than those presented in Fig. 4(a), as we used a lens with different focal length (55 mm instead of 50 mm). In this experiment, we used a sampling rate of . Error bars in the vertical and horizontal axis denote the standard deviation of both the values measured from our photonic device (each measurement point contains 700 frames) and the measurements provided by the Goldmann tonometer, respectively. Fig. 4Experimental results when changing the IOP (a) by elevating the infusion bag and (b) by using an external swab. In (a) the lower and the upper lines indicate a sampling rate of and , respectively, and in (b) the frame rate was fixed to .  Note that for all experiments, we compared the extracted results with absolute reference measurements coming from a conventional Goldmann tonometer, the only device available to measure IOP in anaesthetized rabbits. The pressure values obtained using the Goldmann tonometer appear in the horizontal axis of the experimental charts (see Fig. 4). In addition, simple linear regression was used to compare the relationship between the output of our measurement device and the Goldmann tonometer readings for the data included in Figs. 4(a) and 4(b). The results are presented in Table 1 where our three experiments were summarized. The experiment involving IOP modification with the infusion bag contains two set of measurements (one with a frame rate of and the other with ) while the use of a stick bar to mechanically stress the eye only includes a single frame rate (). Table 1Simple linear regression results for the comparison between our system and a conventional Goldmann tonometer, as a function of IOP, and summary of the parameters used for the measurements presented in Figs. 4(a) and 4(b).
During the experiments, we examined the influence of changes in parameters (including focal length, frame rate, laser power, etc.) on the height of the measured amplitude (as specified before the amplitude designates the shift in pixels of the correlation peak). We tried several combinations and repeated the experiments several times for each. The results of each combination provided similar values, with a standard deviation of no more than 5%, as shown in Fig. 4. This experimental procedure allowed us to select the best experimental configuration for using our photonic device to measure IOP. We concluded a focal length of 50 mm and frame rate of provide optimal results although as can be seen in Table 1 the difference is negligible and all the working points seen in the table produce good results. After selecting the best experimental configuration, we performed measurements at four additional points within the range of IOP values included in this study (between 20 and 70 mmHg, approximately). The new measurement points complete the red plot included in Fig. 4(a) and the whole set of nine measurement points can be seen in Fig. 5, which presents a comparison between the readings (in pixels) of our IOP device and the Goldmann tonometer data (in mmHg). Data from the simple linear regression (dashed black line) and square of the correlation coefficient are also included in Fig. 5. Fig. 5Repeated experiment with additional measurement points using the best experimental setup. The graph shows a comparison between our IOP device and the Goldmann tonometer. The simple linear regression equation and square of the correlation coefficient are also included.  As the square of the correlation coefficient value was high (), we used the linear regression equation to compute IOP values in mmHg from our photonic device readings for the 9 measurement points included in this experiment. Using Bland-Altman analysis,31 this procedure enables direct comparison between the two methods (the proposed photonic IOP device and the standard Goldmann tonometer). The main results are included in Table 2 while paired differences in IOP values (photonic IOP device minus Goldmann tonometer) are plotted against mean values in Fig. 6. The solid black line represents the average value of the difference for all the measurements and the dashed black lines represent the 95% limits of agreement, calculated as from the average value of the difference. The STD denotes the standard deviation of the difference for all the measurements. We selected this range instead of that suggested by Bland–Altman () due to our small sample size (less than 60 measurement points).32 We obtained good agreement between our IOP photonic device and the Goldmann tonometer: the largest difference is for an IOP value of 56 mmHg, and the scatter plot shows that almost all the points lie within the 95% limits of agreement. Note that although for values above 50 mmHg the patient will exhibit obvious symptoms of glaucoma, we have considered the whole set of measurement points (nine in total) reported in this study, because it is a common practice in trials with rabbits to report on IOP values up to 70 to 80 mmHg (or even a bit higher). In any case, note that selecting the points, which are below 50 mmHg will produce even better results (linear regression equation: , , : , : ). Table 2Statistical analysis (linear regression equation, square of the correlation coefficient, mean value of the difference between readings and 95% limits of agreement) between the IOP device and Goldmann tonometer measurements for the best experimental configuration.
Fig. 6Bland-Altman scatter plot: IOP device versus Goldmann tonometer for the nine IOP measurement points. The IOP values provided by our IOP device were computed from the linear regression equation included in Table 2. 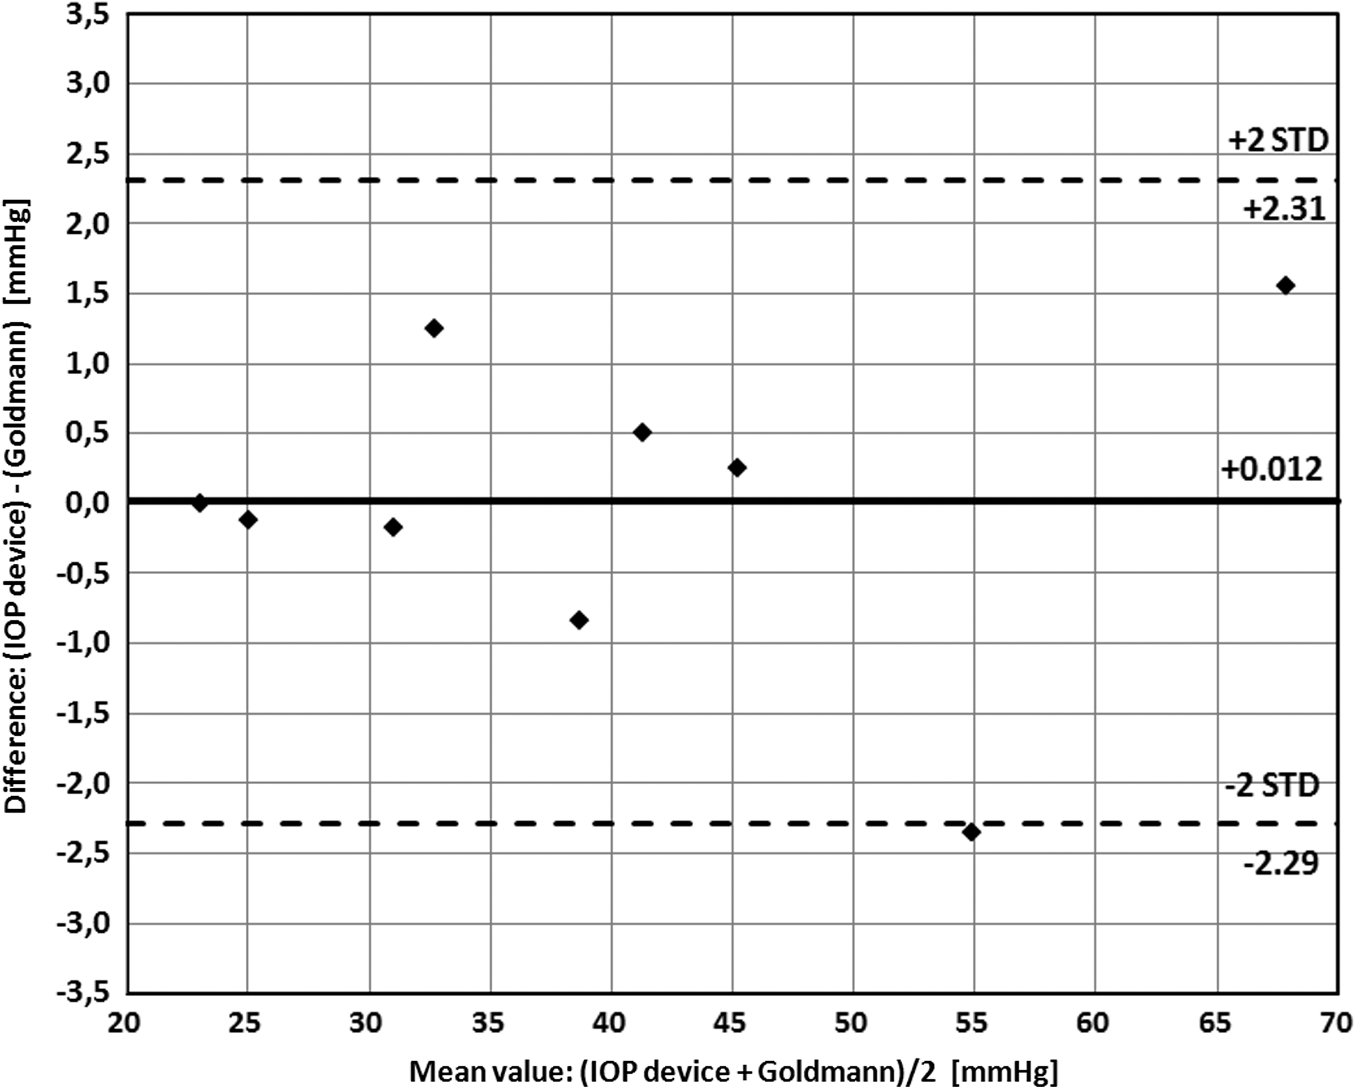 4.DiscussionThe first and most important conclusion stemming from this study is that our device can detect changes in IOP and is sensitive enough to measure IOP values. Also, the obtained results were quite similar using both methods for varying the IOP, showing that the infusion methodology does not affect the blood flow in the eye and that IOP can therefore be measured reliably using this system. Thus, the results presented here are experimentally relevant for discussion. The results show that each parameter (sampling rate, laser power, distance between the eye and the camera, and capturing angle) affects the absolute value of the amplitude being measured. For instance, as higher the laser power is, higher the reflected intensity also is and more precisely can be traced the speckle shift from one frame to the next one. Obviously, the laser power must be limited for avoiding eye damage. Another example can be obtained by the frame rate: as higher the sampling rate is, faster events can be traced but less intensity per frame is available thus making difficult to track the speckle shift. Then the lower the frame rate, the highest the image intensity and the better the obtained results. But, we cannot sample at too low frame rates due to relatively fast vibration profile of the heart beats. So the combination of those values must be optimized in order to define the best experimental configuration. A different issue concerns with the capability of measuring noncontinuously the IOP value, i.e., to measure not only the variation of the IOP (how it changes during the measurement time from a baseline) but its absolute value (which is its value, for instance, from one day to another). We have performed repeated measurements using the same experimental parameters and we have obtained highly repeatable values. Therefore, in our opinion, a proper calibration involving mapping the working area in the eye can allow an automatic recreation of the same measurement conditions, yielding a repeatable and reliable evaluation of the IOP using the proposed optical means. Nevertheless, we also identified some potential pitfalls and areas requiring troubleshooting. The first involves the fact that each eye and each point inside the eye produces a different result. Thus, the measurement and its calibration are dependent on the exact measurement position along the sclera/iris. However, as the differences are not very significant, the angle and the distance can be calibrated. The second potential drawback results from uncontrolled eye movements, including micro saccades and slow movements of the eye. Micro saccades appear at higher frequencies than those related to blood pulsations and can thus be filtered out by our postprocessing algorithm. Slower eye movements are not periodic and thus can also be filtered out. In addition, as part of the calibration process, we map the full eye surface and specify the statistics of the reflected speckle patterns as they appear from each region. Thus, when the eye moves, we can single out the information being reflected from a given region even though a larger region may be illuminated, and use only this information to extract the calibrated IOP readout. All the above is also relevant to filtering out movements resulting from other causes, such as breathing. Comparing our data with Goldmann tonometer readings, on one hand we can see an inverse linear relationship (Fig. 4; negative slope for all the cases) between the output of our device (amplitude values in pixels) and the measurements provided by the Goldmann tonometer. This negative correlation was expected, as when IOP increases, the eyeball becomes more rigid and the amplitude values of the reflected laser spot decrease. On the other hand, there are strong correlations between the IOP measurements obtained with the Goldmann tonometer and our photonic device ( values above 0.95 in all three cases). The high negative correlation between the two measurement methods means that it is possible to consistently predict IOP value using the readings provided by our new measurement device. With respect to error analysis, it is commonly accepted that Goldmann tonometers have a measurement error of about 1 mmHg.33 When comparing this with the proposed technique, while considering a standard deviation error of 5% (as we had in experiments repeated with the same configuration of our sensor) and typical IOP values in humans of 15.5 mmHg on average, we obtained an error of 0.775 mmHg, which is a highly promising result and an additional advantage, alongside the remote and continuous monitoring capability that the proposed technique offers. In terms of the device’s design, the final apparatus for the IOP measurement will enable the patient to self-check IOP without administering anesthesia or visiting a medical professional. It will be based on the proposed technique and should be constructed as a hand-held device that contains a small laser pointer and a fast digital sensor with a sampling and processing card. The device will be able to be used at any given moment, 24 h a day, and it will be possible to repeat measurements as desired. It has been demonstrated that IOP varies depending on the measurement position of the patient.34 The IOP is usually measured with the patient in sitting position but it has been found higher in supine, prone, and head-down positions.35–37 Furthermore, glaucoma patients exhibit a higher postural IOP dependence at high elevations38 and at night.39 Although Goldmann applanation tonometry is the gold standard in measuring IOP,7,8 it has to be mounted to a slit-lamp biomicroscope, restricting its availability to hospitals and doctors’ offices. This complicates and/or prevents its use in handicapped persons or patients with reduced motility. Although there are portable tonometer designs,40,41 the concept of self-tonomety42,43 is now an alternative for continuous monitoring of IOP variations over a 24-h day cycle and from day to day, as it does not require hospitalization. This is of particular importance for elderly patients, as the prevalence of primary open-angle glaucoma increases with age and hospitalization for IOP monitoring involves an expensive and impractical procedure in a foreign environment. The proposed device aims to solve these issues with its simplicity, portability, and ability to be adapted to several measurement postures and distances. 5.ConclusionsIn this study, we propose a novel, noninvasive remote technique for continuous estimation of IOP, an essential parameter for diagnosing and monitoring glaucoma, and describe its validation in rabbits. The monitoring method uses a simple, low-cost photonic device including only a laser and a rapid digital camera to process changes in the position of secondary speckle patterns reflected from the iris or sclera. Preliminary experimental results demonstrate a repeatable correlation between reductions in the measured amplitudes of speckle distribution shifts and true IOP values. Therefore, following calibration between the measured parameters and the reference IOP, the proposed optical technique can provide a quantitative estimation of IOP value. By means of mechanical and image processing, it is possible to ensure repeated accurate measurements performed on the same position along the iris or sclera. The use of a stable system with specific parameters, including sampling rate, capture angle and distance, power of the laser, and focal length of the camera lens, will enable calibration. Further experiments are needed to test the feasibility of the system on human eyes. Primary benefits of the proposed system include its simplicity and portability, low cost, and noninvasiveness, which will provide consumers with a personalized way to measure their IOP anywhere and anytime. AcknowledgmentsPart of this work has been funded by the Spanish Ministerio de Economía y Competitividad and the Fondo Europeo de Desarrollo Regional (FEDER) under the project FIS2010-16646. ReferencesH. A. QuigleyA. T. Broman,
“The number of people with glaucoma worldwide in 2010 and 2020,”
Br. J. Ophthalmol., 90
(3), 262
–267
(2006). http://dx.doi.org/10.1136/bjo.2005.081224 BJOPAL 0007-1161 Google Scholar
D. A. LeeE. J. Higginbotham,
“Glaucoma and its treatment: a review,”
Am. J. Health Syst. Pharm., 62
(7), 691
–699
(2005). http://dx.doi.org/10.2146/ajhp050311 AHSPEK 1079-2082 Google Scholar
H. A. Quigley,
“Number of people with glaucoma worldwide,”
Br. J. Ophthalmol., 80
(5), 389
–393
(1996). http://dx.doi.org/10.1136/bjo.80.5.389 BJOPAL 0007-1161 Google Scholar
J. T. Wilensky,
“Diurnal variations in intraocular pressure,”
Trans. Am. Ophthalmol. Soc., 89 758
–790
(1991). TAOSAT 0065-9533 Google Scholar
L. M. Shubaet al.,
“Diurnal fluctuation and concordance of IOP in glaucoma suspects and normal tension glaucoma patients,”
J. Glaucoma, 16
(3), 307
–312
(2007). JOGLES Google Scholar
H. Goldmann,
“Un nouveau tonometre a applanation,”
Bull. Soc. Fr. Ophthalmol., 67 474
–478
(1954). Google Scholar
K. D. EichenbaumM. MezejJ. W. Eichenbaum,
“Comparing dynamic contour tonometry to Goldmann and hand-held tonometry in normal, ocular hypertension, and glaucoma populations,”
Ann. Ophthalmol., 39
(1), 41
–49
(2007). ANOPB5 Google Scholar
A. Poostchiet al.,
“The iCare rebound tonometer: comparisons with Goldmann tonometry, and influence of central corneal thickness,”
Clin. Experiment Ophthalmol., 37
(7), 687
–691
(2009). http://dx.doi.org/10.1111/ceo.2009.37.issue-7 1442-6404 Google Scholar
D. M. Cockburn,
“Tonometry,”
Clinical Procedures in Optometry, 221
–237 Lippincott Williams & Wilkins, Philadelphia, Pennsylvania
(1991). Google Scholar
B. Grolman,
“A new tonometer system,”
Am. J. Optom. Arch. Am. Acad. Optom., 49
(8), 646
–660
(1972). http://dx.doi.org/10.1097/00006324-197208000-00005 AJOAAX 0002-9408 Google Scholar
B. Entenmannet al.,
“Contact lens tonometry—application in humans,”
Invest. Ophthalmol. Vis. Sci., 38
(12), 2447
–2451
(1997). IOVSDA 0146-0404 Google Scholar
M. Leonardiet al.,
“First steps toward noninvasive intraocular pressure monitoring with a sensing contact lens,”
Invest. Ophthalmol. Vis. Sci., 45
(9), 3113
–3117
(2004). http://dx.doi.org/10.1167/iovs.04-0015 IOVSDA 0146-0404 Google Scholar
J. W. McLarenR. F. BrubakerJ. S. FitzSimon,
“Continuous measurement of intraocular pressure in rabbits by telemetry,”
Invest. Ophthalmol. Vis. Sci., 37
(6), 966
–975
(1996). IOVSDA 0146-0404 Google Scholar
T. Kakadayet al.,
“Advances in telemetric continuous intraocular pressure assessment,”
Br. J. Ophthalmol., 93
(8), 992
–996
(2009). http://dx.doi.org/10.1136/bjo.2008.144261 BJOPAL 0007-1161 Google Scholar
J. L. Hernández-VerdejoM. A. TeusG. Bolivar,
“Simultaneous measurement of intraocular pressure in the anterior chamber and the vitreous cavity,”
Acta Ophthalmol., 88
(7), e265
–e268
(2010). http://dx.doi.org/10.1111/aos.2010.88.issue-7 ACOPAT 0001-639X Google Scholar
K. MansouriT. Shaarawy,
“Continuous intraocular pressure monitoring with a wireless ocular telemetry sensor: initial clinical experience in patients with open angle glaucoma,”
Br. J. Ophthalmol., 95
(5), 627
–629
(2011). http://dx.doi.org/10.1136/bjo.2010.192922 BJOPAL 0007-1161 Google Scholar
T. Matsumotoet al.,
“Measurement by holographic interferometry of the deformation of the eye accompanying changes in intraocular pressure,”
Appl. Opt., 17
(22), 3538
–3539
(1978). http://dx.doi.org/10.1364/AO.17.003538 APOPAI 0003-6935 Google Scholar
M. H. De la Torre-IbarraP. D. RuizJ. M. Huntley,
“Double-shot depth-resolved displacement field measurement using phase-contrast spectral optical coherence tomography,”
Opt. Express, 14
(21), 9643
–9656
(2006). http://dx.doi.org/10.1364/OE.14.009643 OPEXFF 1094-4087 Google Scholar
M. Asejczyk-WidlickaB. K. Pierscionek,
“Fluctuations in intraocular pressure and the potential effect on aberrations of the eye,”
Br. J. Ophthalmol., 91
(8), 1054
–1058
(2007). http://dx.doi.org/10.1136/bjo.2006.109793 BJOPAL 0007-1161 Google Scholar
P. Duboiset al.,
“A new method for Intra Ocular Pressure in vivo measurement: first clinical trials,”
in Conf. Proc. IEEE Eng. Med. Biol. Soc.,
5762
–5765
(2007). Google Scholar
Z. Zalevskyet al.,
“Simultaneous remote extraction of multiple speech sources and heart beats from secondary speckles pattern,”
Opt. Express, 17
(24), 21566
–21580
(2009). http://dx.doi.org/10.1364/OE.17.021566 OPEXFF 1094-4087 Google Scholar
Y. Beidermanet al.,
“Use of PC mouse components for continuous measuring of human heartbeat,”
Appl. Opt., 51
(16), 3323
–3328
(2012). http://dx.doi.org/10.1364/AO.51.003323 APOPAI 0003-6935 Google Scholar
Y. Beidermanet al.,
“Remote estimation of blood pulse pressure via temporal tracking of reflected secondary speckles pattern,”
J. Biomed. Opt., 15
(6), 061707
(2010). http://dx.doi.org/10.1117/1.3505008 JBOPFO 1083-3668 Google Scholar
Y. Beidermanet al.,
“Demonstration of remote optical measurement configuration that correlates to glucose concentration in blood,”
Biomed. Opt. Express, 2
(4), 858
–870
(2011). http://dx.doi.org/10.1364/BOE.2.000858 BOEICL 2156-7085 Google Scholar
A. Shenhavet al.,
“Optical sensor for remote estimation of alcohol concentration in blood stream,”
Opt. Commun., 289 149
–157
(2013). http://dx.doi.org/10.1016/j.optcom.2012.09.079 OPCOB8 0030-4018 Google Scholar
D. Cojocet al.,
“Toward fast malaria detection by secondary speckle sensing microscopy,”
Biomed. Opt. Express, 3
(5), 991
–1005
(2012). http://dx.doi.org/10.1364/BOE.3.000991 BOEICL 2156-7085 Google Scholar
M. Golberget al.,
“Speckle-based configuration for simultaneous in vitro inspection of mechanical contractions of cardiac myocyte cells,”
J. Biomed. Opt., 18
(10), 101310
(2013). http://dx.doi.org/10.1117/1.JBO.18.10.101310 JBOPFO 1083-3668 Google Scholar
Y. Beidermanet al.,
“Optical remote continuous sensing of intraocular pressure variations,”
Proc. SPIE, 8209 820908
(2012). http://dx.doi.org/10.1117/12.905857 PSISDG 0277-786X Google Scholar
Y. Beidermanet al.,
“A microscope configuration for nanometer 3-D movement monitoring accuracy,”
Micron, 42
(4), 366
–375
(2011). http://dx.doi.org/10.1016/j.micron.2010.05.020 MICNB2 0047-7206 Google Scholar
J. M. BlandD. G. Altman,
“Statistical methods for assessing agreement between two methods of clinical measurement,”
Lancet, I
(8476), 307
–310
(1986). http://dx.doi.org/10.1016/S0140-6736(86)90837-8 LANCAO 0140-6736 Google Scholar
K. Krippendorff, Content Analysis: An Introduction to Its Methodology, 219
–250 2nd ed.Sage, Thousand Oaks, California
(2004). Google Scholar
E. Chihara,
“Assessment of true intraocular pressure: the gap between theory and practical data,”
Surv. Ophthalmol., 53
(3), 203
–218
(2008). http://dx.doi.org/10.1016/j.survophthal.2008.02.005 SUOPAD 0039-6257 Google Scholar
T. S. Prataet al.,
“Posture-induced intraocular pressure changes: considerations regarding body position in glaucoma patients,”
Surv. Ophthalmol., 55
(5), 445
–453
(2010). http://dx.doi.org/10.1016/j.survophthal.2009.12.002 SUOPAD 0039-6257 Google Scholar
A. K. C. LamW. A. Douthwaite,
“Does the change of anterior chamber depth or/and episcleral venous pressure cause intraocular pressure change in postural variation?,”
Optom. Vis. Sci., 74
(8), 664
–667
(1997). http://dx.doi.org/10.1097/00006324-199708000-00028 OVSCET 1040-5488 Google Scholar
A. K. C. LamW. A. Douthwaite,
“The effect of an artificially elevated intraocular pressure on the central corneal curvature,”
Ophthal. Physiol. Opt., 17
(1), 18
–24
(1997). http://dx.doi.org/10.1016/S0275-5408(96)00033-6 OPOPD5 0275-5408 Google Scholar
M. S. Ozcanet al.,
“The effect of body inclination during prone positioning on intraocular pressure in awake volunteers: a comparison of two operating tables,”
Anesth. Analg., 99
(4), 1152
–1158
(2004). http://dx.doi.org/10.1213/01.ANE.0000130851.37039.50 AACRAT 0003-2999 Google Scholar
S. TsukaharaT. Sasaki,
“Postural change of IOP in normal persons and in patients with primary wide open-angle glaucoma and low-tension glaucoma,”
Br. J. Ophthalmol., 68
(6), 389
–392
(1984). http://dx.doi.org/10.1136/bjo.68.6.389 BJOPAL 0007-1161 Google Scholar
K. Wozniaket al.,
“Intraocular pressure measurement during the day and night for glaucoma patients and normal controls using Goldmann and Perkins applanation tonometry,”
Ophthalmologe, 103
(12), 1027
–1031
(2006). http://dx.doi.org/10.1007/s00347-006-1407-7 0941-293X Google Scholar
L. Quarantaet al.,
“Untreated 24-h intraocular pressures measured with Goldmann applanation tonometry vs nighttime supine pressures with Perkins applanation tonometry,”
Eye, 24
(7), 1252
–1258
(2010). http://dx.doi.org/10.1038/eye.2009.300 12ZYAS 0950-222X Google Scholar
K. C. OgbuehiT. M. Almubrad,
“Accuracy and reliability of the Keeler Pulsair EasyEye non-contact tonometer,”
Optom. Vis. Sci., 85
(1), 61
–66
(2008). http://dx.doi.org/10.1097/OPX.0b013e31815ed742 OVSCET 1040-5488 Google Scholar
S. Y-W. LiangG. A. LeeD. Shields,
“Self-tonometry in glaucoma management—past, present and future,”
Surv. Ophthalmol., 54
(4), 450
–462
(2009). http://dx.doi.org/10.1016/j.survophthal.2009.04.006 SUOPAD 0039-6257 Google Scholar
A. TarkkanenK. UlfvesT. Ulfves,
“Self-tonometry in glaucoma,”
Graefes. Arch. Clin. Exp. Ophthalmol., 248
(11), 1679
–1681
(2010). http://dx.doi.org/10.1007/s00417-010-1421-y GACODL 0721-832X Google Scholar
|