|
|
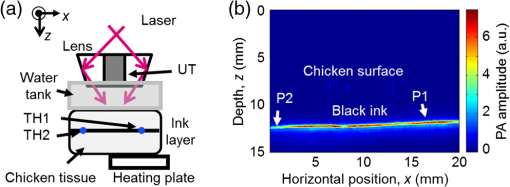
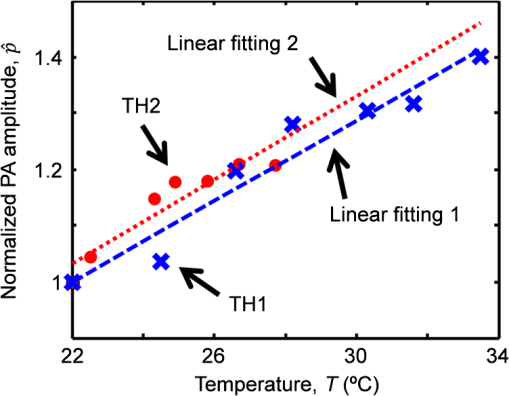
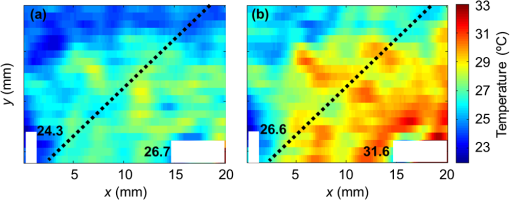
1.IntroductionHeat is an effective tool for treating cancer.1,2 In radiotherapy and chemotherapy, heat synergistically interacts with either the radiation or the cytotoxic drugs. Hyperthermia, which raises the temperature of a cancer region to 40 to 43°C, is usually applied as adjunctive treatment to improve radiosensitivity or drug delivery. Moreover, as an alternative cancer treatment, thermotherapy heats tissues to even higher temperatures (46 to 70°C) and causes tumor damage through thermoablation. In these thermal treatments, it is necessary to control the temperature in order to either maintain the desired temperature level or minimize damage to surrounding healthy tissues. Therefore, monitoring the temperature distribution around the tumor region deep in tissue in real time is critical to ensure effective treatment of the target tumor region and avoid or minimize collateral damage. Several noninvasive methods have been used to measure temperature. Infrared thermography is a real-time method with good accuracy, but it measures only superficial temperature.3 Ultrasound imaging provides good spatial resolution and penetration depth, but it has low temperature sensitivity.4 Magnetic resonance imaging offers high resolution, deep penetration, and high sensitivity, yet it is expensive, bulky, and slow.5,6 Photoacoustic (PA) tomography is capable of structural and functional imaging.7–9 Several reports have detailed the capability of PA techniques for temperature sensing as well.10–15 The temperature-sensing capability is based on the linear relationship between the amplitude of the PA signal from the medium and the temperature. Combined with the reported results of imaging tumor angiogenesis and monitoring cancer therapy,16,17 by using blood as a natural contrast, PA tomography can be a promising tool to monitor the temperature within the range for hyperthermia therapy. However, so far these studies have focused on temperature sensing at single positions, i.e., only the temperature change over the time at a given position has been monitored. In other words, measuring spatial temperature distribution over a large region using PA techniques has not been reported. We present in this paper our experimental results on imaging temperature distributions in tissue-mimicking phantom using PA tomography. We first calibrated our PA imaging system onsite by measuring both the temperature at a spot in the tissue using a thermocouple and the PA signal from that spot. The resultant linear PA– relationship was used to translate the PA image of the tissue into a temperature distribution. Our results demonstrate that it is possible to calibrate the system for a greater temperature range in amplitude () by single-point measurements over a small temperature range. Since natural blood provides the PA contrast, the calibration can be accomplished on or near the surface of the body without inserting a thermocouple deep into the body, an advantage in clinical application. In fact, with some potential loss of accuracy, calibration can be done entirely noninvasively, by imaging superficial blood vessels. Moreover, such in vivo calibration can be achieved in situ, which is more accurate than ex vivo calibration. 2.Methods and Materials2.1.Theoretical BackgroundThe amplitude of the PA signal is given by where is the optical absorption coefficient, is the local fluence, is the percentage of absorbed energy that is converted to heat, and is a calibration constant of the system. The dependency of the PA signal amplitude on temperature, , is mostly attributed to the Grueneisen coefficient, , which is a function of the thermal expansion coefficient, , the speed of sound, , and the specific heat capacity, : . Several previous studies have shown that the PA signal amplitudes of water-based solutions and some tissues are approximately linearly related to the temperature within a given range.10,11,14 Recently, we also demonstrated the linear relationship for bovine blood over quite a large temperature range from 28 to 46°C.18 Therefore, where is a constant dependent on tissue properties.Defining simplifies Eq. (2) to This normalization eliminates the spatial dependences of , , and provided these parameters are constant within the temperature range of interest. We further assume that the Grueneisen parameter is spatially homogeneous from here on. Once the constant is experimentally determined, the temperature can be calculated as follows: 2.2.Imaging System DescriptionA dark-field PA imaging system was used for the experiment.19 It uses a tunable Ti:Sapphire laser (LT-2211A; Lotis TII, Minsk, Belarus) pumped by a Q-switched Nd:YAG laser (LS-2137; Lotis TII) with a pulse width of 5 ns and a repetition rate of 10 Hz. Laser light is delivered to the sample through a lab-made optical assembly. A photodiode (DET110, Thorlabs, Newton, New Jersey) is used to compensate for pulse-to-pulse fluctuations in laser output energy. The acoustic signal is received by a spherically focused ultrasonic transducer (V308; Panametrics-NDT, Waltham, Massachusetts) with a 5-MHz central frequency and a 70% nominal bandwidth. The signal is then amplified by a low-noise amplifier (5072PR; Panametrics-NDT, Waltham, Massachusetts), and recorded using a digital storage oscilloscope (ZT 4421; ZTEC Instruments, Albuquerque, New Mexico). The incident laser fluence on the sample surface is controlled to be within the American National Standards Institute limit.20 2.3.Sample Preparation and ImagingThe sample was prepared using fresh chicken breast tissue. The surface of a piece of chicken tissue was stained with black ink to provide optical contrast. Another piece of chicken tissue was then placed atop the stained surface. A heating plate was inserted beneath a part of the bottom chicken tissue. Therefore, only part of the sample was heated directly, creating a temperature gradient across the whole sample. Two thermocouples were inserted between the two pieces of chicken tissue to measure the temperature of the ink layer at two positions during the experiment. Black ink instead of blood was used to provide optical contrast, simply because blood may dry out during the experiment. However, both ink solution and bovine blood were previously studied for PA temperature sensing.14,18 This substitution should not affect the general conclusions. The experimental setup is illustrated in Fig. 1(a). The ultrasonic transducer was immersed in water inside the water tank. The tank had an open bottom that was sealed with a thin polyethylene membrane. The sample was placed outside the tank below the membrane, and the ultrasonic coupling was secured by coupling gel between the sample and the membrane. The transducer, as well as the optical assembly, raster scanned in the planes parallel to the ink surface. The step sizes were 0.2 mm in the -direction and 0.75 mm in the -direction. (Note that points out of the paper.) Each complete scan took about 10 min and generated a three-dimensional PA image. A maximum amplitude projection (MAP) image projected along the depth direction is produced. Fig. 1(a) Schematic of the experimental setup. (b) Representative B-scan photoacoustic (PA) image of the sample acquired at the baseline (i.e., room) temperature (22°C) before heating the sample. It was used as a reference to normalize all the subsequent PA images. P1 and P2 indicate the positions of the two thermocouples. TH, thermocouple and UT, ultrasonic transducer.  First, a scan was performed when the whole sample was at the baseline temperature, , and a two-dimensional (2-D) image was acquired as a reference. Then the heating plate was turned on to increase the temperature. Another scan was performed when the temperature readings from the two thermocouples reached steady state, suggesting the temperature distribution in the sample had become stable. The same procedure was repeated several times with the heating plate set to different temperatures. The readings from one of the thermocouples and the PA signal amplitudes at the corresponding position were used to calculate the PA– curve. The curve was then used to calculate the temperature distribution of the ink layer from the 2-D PA images. 3.Results and DiscussionA PA B-scan image [Fig. 1(b)] showing a vertical cross-section of the sample was acquired by scanning the system in the -direction. Although the top surface of the chicken breast tissue was barely visible, the ink layer about 0.5 cm below the tissue surface generated strong PA signals. The PA signal amplitude was not uniform along the ink layer even though the whole sample was at the same baseline temperature. This variation was attributed to multiple factors: the ink stained on the chicken tissue was nonuniform, creating spatial fluctuation in optical absorption coefficient; the top layer of tissue had a varying thickness, causing variation in optical fluence at the ink layer; the chicken tissue was inhomogeneous, again making the fluence position-dependent. Fortunately, normalization by the reference PA amplitude in Eq. (4) removes the effects of these factors. Multiple B-scan images similar to Fig. 1(b) were acquired as the system raster-scanned the sample. An MAP image projected along the depth direction was then generated to show a 2-D image of the ink layer in the planes. In the B-scan image in Fig. 1(b), the positions of the thermocouples are indicated by arrows. Although invisible in this image, the thermocouples did show up in other B-scan images, helping us to locate the exact positions. PA signal amplitude at each of these two positions was averaged over a () window in the 2-D image. The normalized PA amplitude at each of the two positions was plotted in Fig. 2 as a function of the temperature measured by the thermocouples. The crosses show the measurements taken at position 1, the hot end. The dashed line is a linear fit of this measurement: where .Fig. 2Normalized PA amplitude versus temperature measured by the thermocouples. Blue crosses and red dots show the measurements at positions 1 and 2, respectively. The blue dashed line is the linear fit of the measurements at position 1 through and the red dotted line is the fit at position 2 through .  Obviously, measuring over a large range of temperature will yield more accurate fitting. However, as shown in Fig. 2 by the red dots and the dotted line, the measurement over a smaller temperature range at position 2, the cold end, gave which is similar to Eq. (5). This similarity demonstrated that the PA– curve can be calibrated over a smaller range of temperature, which is of practical significance. In clinical application, the temperature range can be optimized by considering the safety and comfort of the patient. The calibration result can then be used to predict the temperature at other positions away from the calibration site. This study suggested that the calibration can be implemented at an easily accessible site other than the cancer treatment region in clinical application.Figure 3 shows maps of temperature acquired sequentially at two of the seven heating plate temperatures. The distributions were calculated from the 2-D PA images using Eq. (4), where was determined by Eq. (6) from the cold end. The map was averaged over a () window at the cost of spatial resolution. Since the scanning had different step sizes in the and -directions, we chose a smaller window size in the -direction to maintain a better resolution. The dotted lines in these figures indicate the edge of the heating plate underneath the sample. The hot side of the sample was on the heating plate and the cold side was not. The heating plate was tilted intentionally to misalign the temperature gradient with both scanning directions. The areas occupied by the thermocouples are blanked because in these areas the sample was slightly deformed and the PA signals were not from the ink layer. The temperature distribution was expected showing a decrease from the heated part to the nonheated part of the chicken tissue. Along the edge of the heating plate, the temperature was higher in the middle, which was possibly due to less heat exchange between the sample and the environment. The thermocouple readings at the selected spots are shown in this figure too. Fig. 3Temperature maps acquired by translating PA amplitude into temperature at (a) a representative low heating plate temperature (35°C) and (b) a representative high heating plate temperature (50°C). The white areas in the images indicate the positions of the thermocouples, whose readings are labeled. The dashed lines in the images show the edge of the heating plate underneath the sample. The hot (lower right) side of the sample was on the heating plate while the cold side was not. Each pixel in the images was averaged over a () mm area, which is considered here as the spatial resolution for temperature mapping.  Although the measurements at position 2 (cold end), as shown in Fig. 2, were used for calibration [Eq. (6)], the seven measurements at position 1 (hot end) were then used to estimate the accuracy found to be (). The accuracy can be further improved by signal averaging. Since all the PA signals were normalized by the baseline, simply averaging the baseline signal could greatly improve the accuracy of the calibrated PA– curve, therefore improve the overall accuracy. Our imaging system has good spatial resolution.19 But the spatial resolutions of the temperature map were limited by the size of the window we used for spatial averaging and were as fine as 1.00 mm along the -axis and 2.25 mm along the -axis. Theoretically, the resolutions should be the same in both axes. However, in our experiment, we were limited by the scanning speed of the system. We chose large step sizes, especially in the -direction, to complete the scan before the chicken tissue dehydrated and changed its properties. The spatial resolution can be improved by reducing the step size of the scan with a faster scanning system. With faster scanning, the scan can be repeated at the same temperature distribution and then averaged to improve the signal-to-noise ratio. This not only improves the accuracy of the PA– curve, but also improves the spatial resolution. Since our method measures blood in the temperature range of hyperthermia, heterogeneity in the Grueneisen parameter of the surrounding tissue would not significantly change the value of the constant . Further, a study on canine liver showed that the optical properties did not change during moderate heating.12 Therefore, the optical heterogeneity is taken into account by the normalization performed in our method. Our method works within a moderate temperature range where the linearity assumption holds true. Therefore, the primary application is in hyperthermia rather than thermal ablation. 4.ConclusionsIn summary, we investigated the possibility of imaging temperature distribution in deep tissue using the PA technique. The linear relationship between the PA signal and the temperature, the PA– curve, can be determined through measurement of a small region over a small temperature range. The temperature distribution within the temperature range of hyperthermia can be calculated from the PA image using the PA– curve. We demonstrated that the method provides a good accuracy and spatial resolution. PA temperature mapping has the capability to monitor the temperature, both temporally and spatially, in deep tissue in real time during thermal treatment of cancer such as hyperthermia or thermotherapy. AcknowledgmentsThe authors appreciate James Ballard’s close reading of this paper. We thank Guo Li, Junjie Yao, and Lidai Wang for valuable discussions. This work was sponsored by NIH Grants Nos. R01 CA134539, DP1 EB016986 (NIH Director’s Pioneer Award), R01 EB016963, U54 CA136398, R01 CA157277, and R01 CA159959. L.V. Wang has a financial interest in Endra, Inc., and Microphotoacoustics, Inc., which, however, did not support this work. ReferencesB. Hildebrandtet al.,
“The cellular and molecular basis of hyperthermia,”
Crit. Rev. Oncol. Hematol., 43
(1), 33
–56
(2002). http://dx.doi.org/10.1016/S1040-8428(01)00179-2 1040-8428 Google Scholar
C. Sawyeret al.,
“Modeling of temperature profile during magnetic thermotherapy for cancer treatment,”
J. Appl. Phys., 105
(7), 07B320
(2009). http://dx.doi.org/10.1063/1.3077211 JAPIAU 0021-8979 Google Scholar
A. J. WelchM. J. C. van Gemert, Optical-Thermal Response of Laser-Irradiated Tissue, Plenum, New York
(1995). Google Scholar
R. SeipE. S. Ebbini,
“Noninvasive estimation of tissue temperature response to heating fields using diagnostic ultrasound,”
IEEE Trans. Biomed. Eng., 42 828
–839
(1995). http://dx.doi.org/10.1109/10.398644 IEBEAX 0018-9294 Google Scholar
S. J. GrahamM. J. BronskillR. M. Henkelman,
“Time and temperature dependence of MR parameters during thermal coagulation of ex vivo rabbit muscle,”
Magn. Reson. Med., 39 198
–203
(1998). http://dx.doi.org/10.1002/(ISSN)1522-2594 MRMEEN 0740-3194 Google Scholar
P. Steineret al.,
“Radio-frequency-induced thermoablation: monitoring with T1-weighted and proton-frequency-shift MR imaging in an interventional 0.5-T environment,”
Radiology, 206
(3), 803
–810
(1998). RADLAX 0033-8419 Google Scholar
G. Kuet al.,
“Thermoacoustic and photoacoustic tomography of thick biological tissues toward breast imaging,”
Technol. Cancer Res. Treat., 4
(5), 559
–566
(2005). TCRTBS 1533-0346 Google Scholar
L. V. Wang,
“Prospects of photoacoustic tomography,”
Med. Phys., 35
(12), 5758
–5767
(2008). http://dx.doi.org/10.1118/1.3013698 MPHYA6 0094-2405 Google Scholar
M. XuL. V. Wang,
“Photoacoustic imaging in biomedicine,”
Rev. Sci. Instrum., 77 041101
(2006). http://dx.doi.org/10.1063/1.2195024 RSINAK 0034-6748 Google Scholar
J. Shahet al.,
“Photoacoustic imaging and temperature measurement for photothermal cancer therapy,”
J. Biomed. Opt., 13
(3), 034024
(2008). http://dx.doi.org/10.1117/1.2940362 JBOPFO 1083-3668 Google Scholar
C. LouD. Xing,
“Temperature monitoring utilizing thermoacoustic signals during pulsed microwave thermotherapy: a feasibility study,”
Int. J. Hyperthermia, 26
(4), 338
–346
(2010). http://dx.doi.org/10.3109/02656731003592035 IJHYEQ 0265-6736 Google Scholar
I. V. LarinaK. V. LarinR. O. Esenaliev,
“Real-time optoacoustic monitoring of temperature in tissues,”
J. Phys. D: Appl. Phys., 38 2633
–2639
(2005). http://dx.doi.org/10.1088/0022-3727/38/15/015 JPAPBE 0022-3727 Google Scholar
G. Schuleet al.,
“Noninvasive optoacoustic temperature determination at the fundus of the eye during laser irradiation,”
J. Biomed. Opt., 9
(1), 173
–179
(2004). http://dx.doi.org/10.1117/1.1627338 JBOPFO 1083-3668 Google Scholar
H. Keet al.,
“Temperature mapping using photoacoustic and thermoacoustic tomography,”
Proc. SPIE, 8223 82230T
(2012). http://dx.doi.org/10.1117/12.909000 PSISDG 0277-786X Google Scholar
M. PramanikL. V. Wang,
“Thermoacoustic and photoacoustic sensing of temperature,”
J. Biomed. Opt., 14
(5), 054024
(2009). http://dx.doi.org/10.1117/1.3247155 JBOPFO 1083-3668 Google Scholar
R. I. Siphantoet al.,
“Serial noninvasive photoacoustic imaging of neovascularization in tumor angiogenesis,”
Opt. Express, 13
(1), 89
–95
(2005). http://dx.doi.org/10.1364/OPEX.13.000089 OPEXFF 1094-4087 Google Scholar
A. A. Oraevsky,
“Optoacoustic imaging of blood for visualization and diagnostics of breast cancer,”
Proc. SPIE, 4618 81
(2002). http://dx.doi.org/10.1117/12.469851 PSISDG 0277-786X Google Scholar
J. Yaoet al.,
“Absolute photoacoustic thermometry in deep tissue,”
Opt. Lett., 38
(24), 5228
–5231
(2013). http://dx.doi.org/10.1364/OL.38.005228 OPLEDP 0146-9592 Google Scholar
K. SongL. V. Wang,
“Deep reflection-mode photoacoustic imaging of biological tissue,”
J. Biomed. Opt., 12
(6), 060503
(2007). http://dx.doi.org/10.1117/1.2818045 JBOPFO 1083-3668 Google Scholar
American National Standard for Safe Use of Lasers ANSI Z136.1-2000, American National Standards Institute, Inc., New York
(2000). Google Scholar
|

