
|
|
1.IntroductionCallus formation is a critical step for successful fracture healing.1 About 5% to 10% of all fractures suffer from delayed healing or lead to a nonunion.2 Bone morphogenetic proteins (BMPs) increase callus formation3 and have been shown to be valuable in the treatment of fracture nonunions. BMPs, however, increase the speed of remodeling and thereby also induce resorption via the RANK pathway. On the other hand, bisphosphonates can be used to reduce the resorption of bone as they inhibit the osteoclast activity.4 These manipulations of the modeling and remodeling may alter the quality of the forming bone. To date, very little is known about the effect of BMPs and bisphosphonates on the molecular composition and mineral structure of the callus. Fourier transform infrared (FTIR) microspectroscopy and small angle x-ray scattering (SAXS) can be used to evaluate the molecular composition and mineral structure, respectively, of trabecular5–9 and cortical bone.5,10–13 However, the composition and mineral structure of the callus tissue during fracture healing has received little attention.14–16 Each molecular structure has its own specific IR absorption spectrum. When coupled to a microscope, FTIR imaging microspectroscopy provides a tool for fast measurements of the spatial composition of bone.10,17,18 Several compositional parameters can be calculated from the bone IR spectra, e.g., degree of mineralization, carbonate substitution, collagen maturity, crystallinity, and acid phosphate substitution (APS).19–22 In SAXS, a sample is irradiated by a narrow well-collimated x-ray beam and the intensity of x-rays scattered by the sample at small angles is measured. In bone, the scattering is related to bone mineral structure, i.e., the spatial arrangement of mineral crystals and collagen fibrils. When coupled with an automated scanning stage, spatial maps can be recorded where each pixel contains a two-dimensional (2-D) scattering pattern.13 Several parameters can be determined from the scattering pattern of bone, e.g., the mineral plate thickness, predominant orientation, and degree of orientation.8,13,23,24 Spatial distributions of these parameters provide a good insight to the variation in mineral structure in cortical bone and newly formed callus tissue. Different methods have been used to determine the mineral plate thickness. Fratzl et al. proposed a method in which a mineral phase fraction of 50% is assumed.8,23,24 This assumption might not be valid for, e.g., newly formed bone where the degree of mineralization may vary substantially. Another approach introduced by Bünger et al. evaluates the mineral plate thickness through an iterative curve fitting method where no assumptions of the mineral phase fraction are needed.13 The latter was used in this study. This study used FTIR imaging microspectroscopy and scanning SAXS to assess the molecular composition and mineral structure of newly formed callus tissue, the adjacent cortical bone, and the nonfractured contralateral cortical bone, during long bone fracture healing in a rat nonunion model. The first aim was to evaluate the feasibility of SAXS to assess the mineral structure of callus tissue and if it could provide complementary information to the compositional analyses from FTIR. The subsequent aim was to study the differences in molecular composition and mineral structure among fracture callus, fracture cortex, and control cortex. 2.Materials and Methods2.1.Experimental OverviewTwelve male Sprague–Dawley rats at 9 weeks of age were anaesthetized with ketamine HCl (, Parnell Laboratories, Roseberry, Australia) and xylazine (, Ilium, Smithfield, Australia).25,26 The right femurs of the rats were osteotomized, stripped of periosteum and muscle, and fixed with an intramedullary 1.1 mm Kirschner wire. BMP-7 was placed locally around the fracture and zoledronate (ZO) or saline (NaCl) was injected after 2 weeks. Thus, four groups were created (A) NaCl, (B) , (C) , and (D) ZO. After the operation, the rats received subcutaneous physiologic saline and buprenorphine (Temgesic, Reckitt and Colemann, Hull, UK) at twice a day. Rats were sacrificed after 6 weeks and both femurs, fractured (right), and control (left) were stripped of the soft tissue, defatted, and dehydrated in ascending series of ethanol solutions and embedded in polymethylmethacrylate (PMMA). The experimental protocol was approved by the local animal ethics committee. The experimental model results in 52% nonunions when the femur is left untreated.25 2.2.Imaging of Callus SizeThe femurs from the fracture side were imaged with a micro-CT system (Skyscan 1172, Aartselaar, Belgium) to visualize the fracture callus and cortex in each animal (Fig. 1). Images were acquired with an isotropic voxel size of 36 μm using 100 kV, 100 μA with a 0.5 mm aluminum filter, and 10 repeated scans. Image reconstruction was performed (NRecon, Skyscan, v. 1.5.1.4) by correcting for ring artifacts and beam hardening. Following reconstruction, the individual fracture lines were identified by simultaneously viewing multiple orthogonal slices (DataViewer, Skyscan, v. 1.4). The data were used to qualitatively assess and evaluate the status of healing of the fractures and the size of the calluses. 2.3.Small Angle x-ray ScatteringFrom the PMMA embedded specimens, 300 μm sections were sawed (EXAKT 400 CS, Cutting Grinding System, Hamburg, Germany). Two samples from each treatment group and one section from each sample were measured and analyzed. SAXS measurements were conducted at the I911-SAXS beamline at the 1.5 GeV ring (MAX II) of the MAX IV Laboratory (Lund University, Lund, Sweden).27 The wavelength of the monochromatic radiation obtained from a Si(111) crystal was and the size of the collimated synchrotron x-ray beam at the sample position was approximately . The used detector was a MarCCD (Rayonix, L.L.C.) with a 165 mm active area and 79 μm pixel size. It was placed at 1911 mm behind the sample and the exposure time to collect each SAXS pattern was 5 s. The -range measured at each measurement point was 0.01 to . Bone sections were mounted in a sample holder which was placed in a motorized scanning stage to map the sample with a step size of 0.2 mm in both directions. About areas of the sections including the fracture callus and cortex and areas of the control cortex were measured [Fig. 2(b)]. Fig. 2Images from the different techniques used in this study: (a) micro-CT, (b) small angle x-ray scattering (SAXS, x-ray absorbance map), and (c) Fourier transform infrared (FTIR). In the micro-CT image, the measurement area (white box) of FTIR and SAXS measurements is indicated. The yellow and red boxes inside the white box indicate the callus and the cortex, respectively.  From the anisotropic (noncircular symmetric) 2-D SAXS intensity pattern, , the size, shape, and orientation of the mineral crystals were analyzed for each measurement point [Fig. 3(a)]. Analysis of SAXS data were done by averaging the scattering pattern over 360 deg azimuthal range8,13,23,24 after masking of the beamstop and the area outside the detector [Fig. 3(a)]. This results in a one-dimensional (1-D) scattering pattern . From this pattern, the mineral plate thickness was evaluated following the approach suggested by Bünger et al.13 Shortly, it is based on a curve fitting where the mineral crystals are assumed to be plates with a finite thickness, , in 1-D and infinite size in the other 2-D. The scattering from one plate is Fig. 3(a) Typical SAXS two-dimensional-scattering spectrum of bone with the detector edges and beamstop masked away. (b) Q-averaged scattering intensity as a function of the scattering angle . 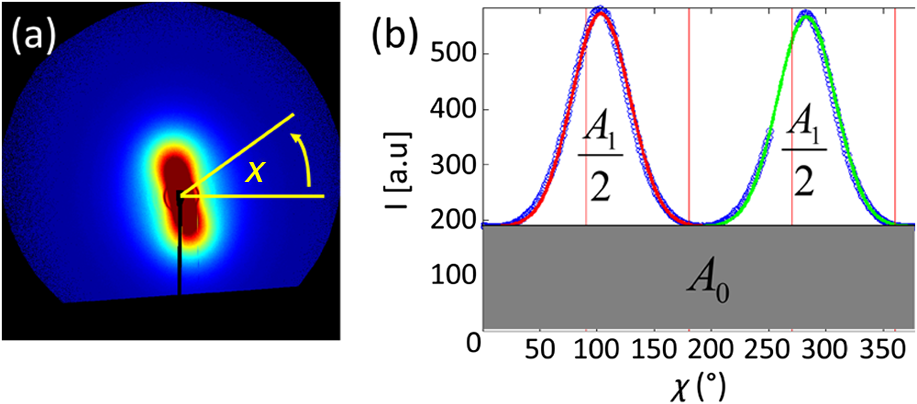 Here, is the scattering vector magnitude, where is the x-ray wave length and is the scattering angle. The variation of the thickness of the mineral plates is taken into account by assuming that the thickness variation follows a Schultz–Zimm distribution . The average scattering then reads Equation (1) represents the single particle scattering function. In bone, the mineral content is high and we also need to take into account the spatial arrangement of mineral platelets, through a structure factor. Bünger et al.13 suggested a structure factor that includes both short range and long range interparticle correlations. To describe the short range repulsive interactions, they considered the random phase approximation (RPA), where the effective RPA structure factor can be written as where is an adjustable parameter depends on the strength of the interactions and that typically increases with increasing concentrations. In addition, the increasing scattering intensity at lower suggests a long range fractal arrangement of the mineral particles that is described by where is the fractal dimension of the fluctuations. The total intensity , i.e., model curve, is then given by where is a variable scale factor that depends on the sample thickness, the mineral content, and the scattering contrast. Finally, the model curve [Eq. (5)] is fitted to the measured data by iterative weighted nonlinear least squares adjusting the mineral plate thickness , the width of the mineral plate thickness distribution, the RPA value, and , and . The model curves were fitted by automated custom-made scripts using MATLAB (MATLAB R2011b, The MathWorks, Inc., Natick, Massachusetts).Predominant orientation and degree of orientation were determined by calculating the -averaged scattering intensity as a function of azimuthal angle [Fig. 3(b)]. Predominant orientation was calculated as , where is the angle , where the intensity reaches its maximum.8,28 Gaussian curves were fitted to both peaks [Fig. 3(b)]. Degree of orientation was calculated as where is the area under the two Gaussian curves and is the background area.8 Thus, gets values between 0 and 1, where 0 means that there is no predominant orientation within the plane of the section and 1 means that all mineral crystals are aligned perfectly in the same directions. These parameters were calculated for each measurement point (Fig. 4). A threshold of the integrated intensity of the 1-D scattering pattern was used to mask the background (PMMA) and each analyzed area contained the whole measured cortex or callus.Fig. 4Point-by-point measured SAXS maps of (a) fracture callus and cortex and (b) control cortex. In each pixel, the colormap indicates the mineral plate thickness (nm), the line orientation indicates the orientation of the crystals, and the length of the line indicates the degree of orientation of the crystals.  2.4.Fourier Transform Infrared MicrospectroscopyThree-micrometers thick longitudinal sections of bone were cut (Polycut S, Reichert-Jung, Germany) from the PMMA plugs, and placed on ZnSe windows. Three samples of each treatment group and two sections of each sample from the control cortex, fracture cortex, and callus tissue were measured and analyzed. Analysis of bone composition was conducted with a PerkinElmer Instrument (Spectrum Spotlight 300, Perkin Elmer Inc., Wellesley, Massachusetts) in transmission mode. A 25 μm spatial resolution and spectral resolution of with eight repeated scans per pixels were used. The background spectrum was recorded on a clean area of the ZnSe window by using the same measurement parameters but with an average of 75 scans. Data were collected at the wavenumber range of 2000 to . Areal measurements () were performed on the fractured femurs, including both the cortex and callus [Fig. 2(c)], and on the control cortex of the intact femur. In addition, one areal measurement of only PMMA was measured and averaged. The bone spectra were normalized by using the averaged PMMA spectrum.29 Subsequently, the PMMA spectrum was subtracted from the bone spectra. From the preprocessed bone spectra, the areas of linearly baseline corrected amide I (1720 to ), phosphate (1200 to ), and carbonate (890 to ) peaks were calculated.17,19–21 These peak areas were used to determine the mineral/matrix (phosphate/amide I) and carbonate/phosphate ratios. Mineral/matrix ratio is an indicator of the degree of mineralization, whereas carbonate/phosphate ratio describes the carbonate substitution.19 Collagen maturity and crystallinity of the hydroxyapatite (HA) crystals were evaluated through second derivative peak fitting. The ratio of areas of the subpeaks under the amide I peak at 1660 and was used to describe the collagen maturity (collagen cross-linking ratio—XLR),21 whereas the ratio of areas of the subpeaks at 1030 and under the phosphate peak was used as an indicator of crystallinity,20 i.e., the size and perfection of HA crystals. APS, which is associated with new mineral deposition, was determined as a ratio of intensities at 1127 and .22 The total absorption of the background corrected (PMMA subtracted) spectra was used for masking out the bone and each analyzed area contained the whole measured cortex or callus. All preprocessing and analyses of the FTIR and SAXS data were performed using MATLAB (MATLAB R2011b, The MathWorks, Inc., Natick, Massachusetts). 2.5.StatisticsMicro-CT images were only evaluated qualitatively due to the small number of samples per group. Wilcoxon signed rank test was used to compare the molecular composition and mineral structure between paired samples (each rat) from the control cortex, fracture cortex, and fracture callus. For this test, all the rats were pooled into one group. Paired -test was performed by comparing all the data points from the callus tissue and the cortices in the same animal.30 3.ResultsBased on the micro-CT images, only small amounts of callus tissue were found in the NaCl group. Some mineralized callus tissue was forming between the fracture ends but union was not completed [Fig. 1(a)]. All fractures in the BMP-7 groups were judged to be completely healed based on the micro-CT images [Figs. 1(b) and 1(c)]. Callus size was larger in group than in other groups (Fig. 1). Based on the FTIR data with all samples pooled, the mineral/matrix ratio [Fig. 5(a)] and XLR [Fig. 5(c)] were significantly lower in fracture callus than in fracture cortex ( and , respectively) and control cortex ( and , respectively), whereas crystallinity [Fig. 5(d)] of the control cortex was significantly lower than that in the fracture cortex and callus ( in both). APS [Fig. 5(e)] was significantly higher in the fracture callus compared to control and fracture cortices ( and , respectively). Fig. 5FTIR compositional analyses of (a) mineral/matrix ratio, (b) carbonate/phosphate ratio, (c) collagen cross-linking ratio, (d) crystallinity, and (e) acid phosphate substitution in control cortex, fracture cortex, and fracture callus for all samples together and in different treatment groups. Nonparametric Wilcoxon signed rank test for all samples: and . 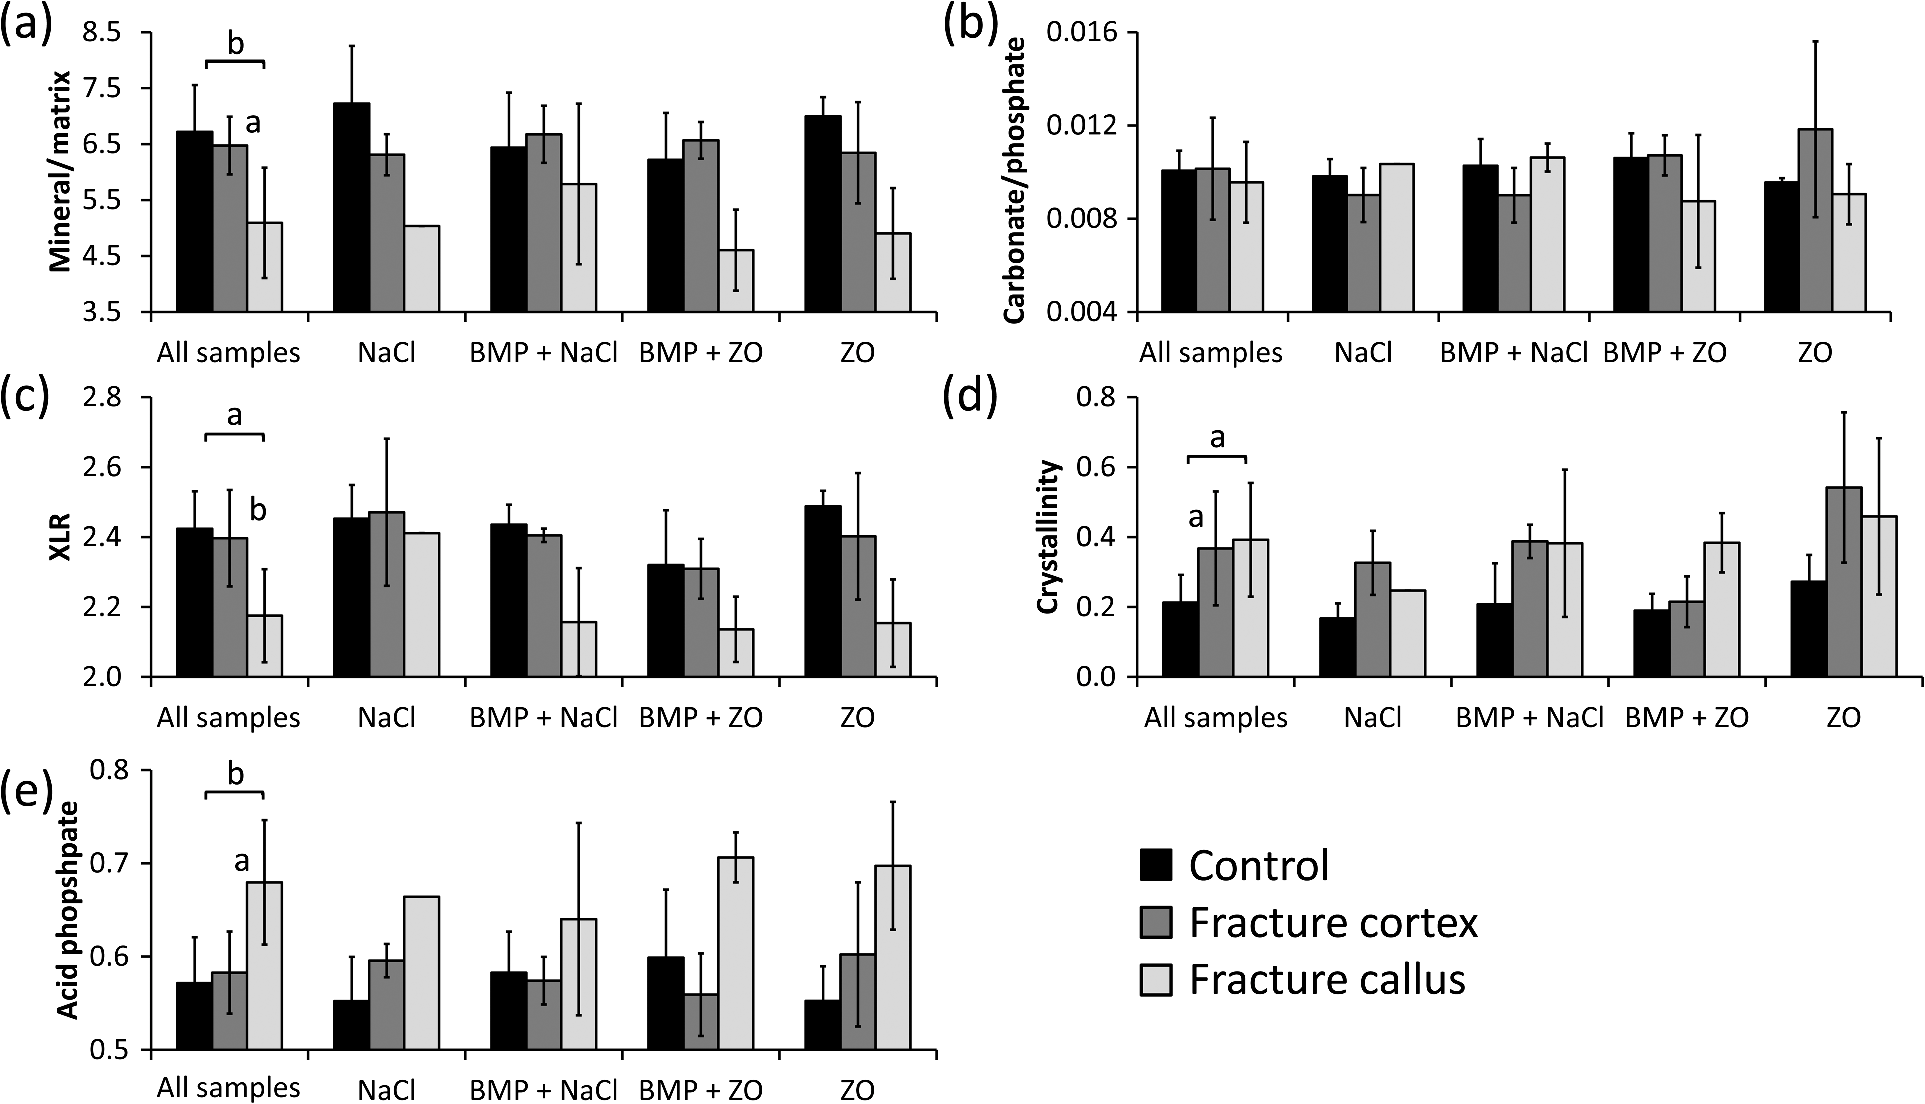 When comparing all data points within one animal in each sample, the mineral/matrix ratio was lower in the callus tissue than in the cortices () [Table 1 and Fig. 5(a)]. Carbonate/phosphate ratio was significantly higher in callus tissue compared to cortices in all samples in the and ZO groups () [Table 1 and Fig. 5(b)], but not in the other two groups. XLR was significantly lower in callus tissue compared to cortices in all the individual samples from all treatment groups [Table 1 and Fig. 5(c)]. Significantly higher crystallinity values were observed in fracture callus compared to cortices in the NaCl and ZO groups (), but not in the BMP-7 or treated samples [Table 1 and Fig. 5(d)]. APS was significantly higher in callus tissue than in fracture cortex in all samples from all treatment groups () [Table 1 and Fig. 5(e)]. Table 1Comparison of composition and mineral structure parameters in callus tissue and fracture cortex when comparing all data points within one animal. Significantly decreased (↓), increased (↑), or no systematic change (–) in values from all samples are indicated, when callus tissue is compared to fracture cortex tissue. Alterations in mineral/matrix ratio (M/M), carbonate/phosphate ratio (C/P), collagen maturity (XLR), crystallinity (Cryst), acid phosphate substitution (APS), mineral plate thickness (T), orientation, and degree of orientation (DoO) are indicated.
Based on the SAXS data with all samples pooled, the fracture cortex had a lower mineral plate thickness than the control cortex and the callus tissue [Fig. 6(a)]. The difference between the fracture cortex and callus tissue was significant (). The predominant orientation was significantly different in the callus tissue compared to the fracture and control cortices (, in both) [Fig. 6(b)]. The predominant orientation of the mineral crystals in the cortices was clearly along the long bone axis, whereas the orientation was more random in the calluses. Degree of orientation was higher in control cortex than in the fracture cortex and callus ( in both) [Fig. 6(c)]. Fig. 6SAXS analyses of (a) mineral plate thickness, (b) predominant orientation, and (c) degree of orientation in control cortex, fracture cortex, and fracture callus for all samples together and in different treatment groups. Nonparametric Wilcoxon signed rank test for all samples: . 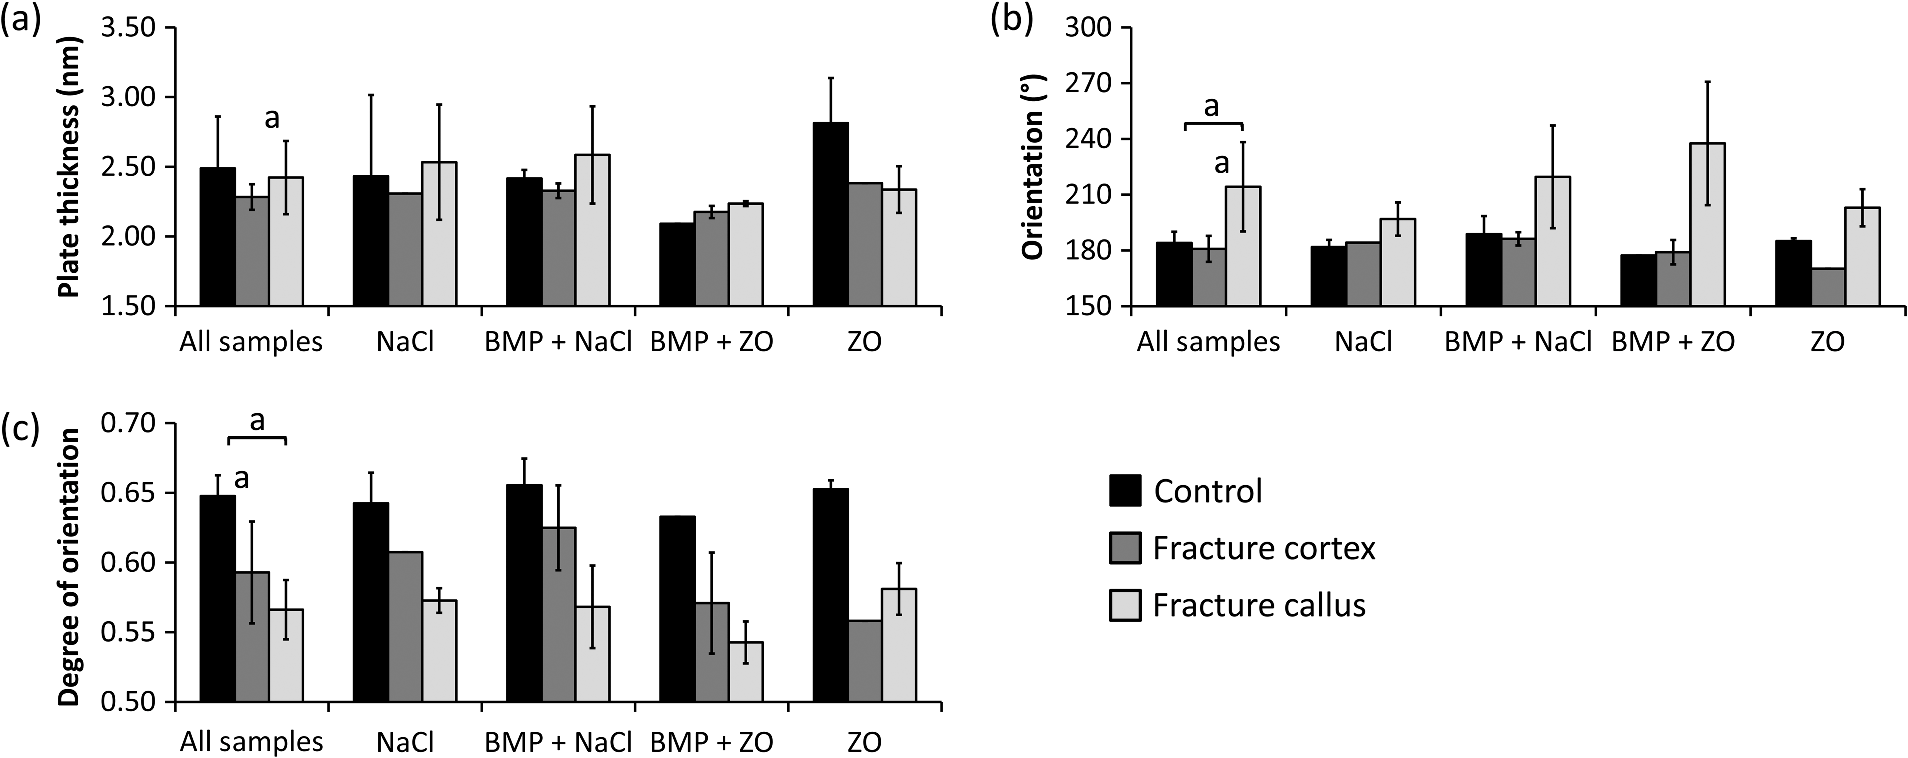 When comparing all data points within one animal, the mineral plate thickness was significantly higher in callus tissue than in the fracture cortex in and ZO treated groups [Table 1 and Fig. 6(a)]. In NaCl and treated samples, no systematic differences between callus tissue and fracture cortex were observed. The mineral plate thickness was significantly higher in control cortex than in callus tissue in samples in NaCl and ZO groups. Significantly higher predominant orientation values were evident in callus tissue compared to cortices in all samples () [Table 1 and Fig. 6(b)]. Additionally, the degree of orientation was significantly higher in cortices than in callus tissue () in all samples regardless of the treatment [Table 1 and Fig. 6(c)]. 4.DiscussionIn this study, we demonstrate that FTIR and SAXS combined can be used to identify the differences in composition and mineral structure between the newly formed callus tissue and cortical bone tissue. Moreover, we initiated an investigation of the effect of treatment with BMPs and bisphosphonates on the composition and mineral structure of newly formed callus tissue. FTIR has been widely used to evaluate the composition of bone. However, studies on composition of newly formed fracture callus bone are limited.14,15 Yang et al. used FTIR to study the composition of callus and cortex during fracture healing in wild type and interleukin-6 knockout mice.14 They found a higher mineral/matrix ratio in the cortex compared to callus whereas crystallinity did not differ between the callus and cortex. The authors did not report other FTIR parameters. Their finding regarding the mineral/matrix ratio is consistent with our study. However, in contrast to their results, we found a higher crystallinity in the callus and fracture cortex compared to control cortex. The difference might originate from the different analysis methods, as they calculated the crystallinity from the intensity ratio in the spectra whereas we used the peak fitting method. Ouyang et al. studied the effects of estrogen and estrogen deficiency in fracture callus in rat femurs.15 They found a lower mineral/matrix ratio, higher carbonate/phosphate ratio, lower XLR, and slightly reduced crystallinity in the fracture callus when compared to the fracture cortex at a distance from the fracture site in the estrogen deficient rats. After 8 weeks from the start of the treatment, the estrogen sufficient rats showed similar mineral/matrix ratio and crystallinity as the estrogen deficient rats, and a slightly higher XLR and lower carbonate/phosphate ratio near the fracture. These results are generally consistent with the data presented in this study. However, they did not report statistical significance. APS is associated with new mineral deposition22,31,32 and high amount of APS has been shown to indicate areas of new bone formation.33,34 However, it has not been reported earlier in fracture callus tissue. Our results showed a higher APS in the fracture callus compared to the cortices, which seem highly reasonable. The mineral plate thickness has traditionally been evaluated using a method by Fratzl et al.8,9,23,24,35,36 It is based on a two-phase assumption, in which the mineral plate thickness is determined from the ratio of the integrated intensity and the Porod constant. Further, it is assumed that the fraction of mineral phase is 50%. This approach has been successful when a relatively constant mineral phase fraction could have been assumed in bone. The calculated mineral plate thickness increases with increasing mineral phase fraction. Thus, the method may underestimate the mineral plate thickness if the real mineral phase fraction , and in new formed bone with a lower mineral phase fraction, it might overestimate it. Moreover, the mineral fraction has been found to vary within dentin.37 Similar variation could be expected also in bone. Bünger et al. introduced a curve fitting method in which assumption of the fraction of the mineral phase is not needed,13 which may be more accurate especially when determining the mineral plate thickness in bones with clearly different degrees of mineralization. SAXS has been used to determine the mineral structure of trabecular5,8,9 and cortical bone.5,13 However, fracture callus tissue has received only minor attention in SAXS studies. Liu et al. evaluated the mineral plate thicknesses in fracture callus and fracture cortex in sheep undergoing fracture healing.16 Using the method proposed by Fratzl et al., they found a lower mineral plate thickness in fracture callus than in fracture cortex after 2 to 6 weeks, but no difference at 9 weeks after the fracture. Our study evaluated the healing after 6 weeks in a rat model. That is roughly comparable to 9 weeks healing time in a sheep model. In the present study, the mineral plate thickness tended to be higher in control cortex compared to the fracture cortex and callus, however, no significant differences were observed. Hypothetically, with a higher number of samples this may reach a significantly higher mineral plate thickness in control cortex than in fracture cortex and callus even at this stage of fracture healing. The number of studies combining measurements of composition and mineral structure of bone in the same samples is highly limited. Pleshko-Camacho et al. used FTIR and SAXS to study the composition and mineral structure of cortical and trabecular bone of one L-4 vertebra of a 14-month-old girl.5 They mapped the trabeculae with both techniques and compared the results between trabecular and cortical bone. They also compared the parameter outcome from the two techniques. They found that the total mineral content and mineral/matrix ratio were lower in trabecular bone than in cortical bone, whereas mineral plate thickness and degree of orientation were lower in cortical bone than in trabecular bone. Trabecular bone has a more irregular orientation than in cortical bone, and in some stages of fracture healing, callus tissue can be described to be of trabecular-like. Therefore, we compare these findings to those in the present study. We also found a higher mineral/matrix ratio in cortical bone than in callus. Degree of orientation was lower in callus tissue than in cortex. In the study by Pleshko-Camacho et al.,5 they also found a significant correlation between crystallinity, determined from IR spectra, and mineral plate thickness, determined by SAXS. In our study, no correlation was found. However, this is not surprising, since crystallinity is suggested to be related to the HA crystal length.20 Thickness of the crystals is different from their length and may thus diverge from crystallinity without contradiction. Lower degree of mineralization (mineral/matrix ratio), collagen maturity, and degree of orientation of the mineral crystals and higher APS are indicators of new, immature, and less organized bone. As expected, this was found in our study when the callus tissue was compared with the cortices. Also, the larger spread of angles in the callus tissue reflects the disordered nature of the forming bone. This would be expected, since the orientation of the collagen fibers18 and mineral crystals38,39 in cortical lamellar bone are oriented primarily in the direction of the long axis of the bone, i.e., the main loading direction. During bone healing, new bone formation occurs primarily through endochondral ossification resulting in quick formation of immature and less organized bone. Some calcified cartilage in the callus area could still be present at this stage of fracture healing,40 but the classification would require histology not available in this study. From the compositional data, the separation of woven bone and calcified cartilage is difficult, or even impossible. Immature bone has a more random orientation, which is reflected by the orientation parameters. With time, this immature and less organized bone tissue remodels into lamellar bone with a more organized structure, and finally, the cortex is restored. In our study, only one time point of 6 weeks was chosen. In our previous studies, this time point has corresponded to bridging of the fracture but not yet full remodeling.25,26,30 The amount of unremodeled callus depends both on the chosen time point and on the treatment given to the rats, which in this case was different combinations of BMP-7 and the bisphoshponate zolendronate. Based on the findings from our previous studies using the same open fracture healing model and time point,26 we assume that no or very little calcified cartilage remains in the callus areas. To confirm this, histological assessment would be necessary, which unfortunately was not available. In the NaCl group, the calluses were smaller compared to, e.g., BMP-treated calluses. This seems to be reflected in the orientation parameters, where the NaCl treated samples showed more similar orientation to the cortical bone compared to the large callus formations in the BMP-treated calluses. When comparing all data points within one animal, significant differences were found between the callus tissue and the cortices. These differences were identified in some treatment groups, but not all. In all treatment groups, the mineral/matrix ratio, collagen maturity, and degree of orientation of the mineral plates were lower in the callus tissue than in the cortices. Additionally, the APS and orientation were higher in callus tissue than in the cortices in all samples and groups. However, when comparing the treatments in this manner, some differences between the treatments could also be detected. In and ZO treated samples, the mineral plate thickness was higher in callus tissue than in the fracture cortex. Also, crystallinity was higher in callus tissue compared to the fracture cortex in ZO treated samples. It might be postulated, that since bisphosphonates inhibit osteoclast activity and since the degree of bone resorption decreases, the mineral crystals are allowed to grow more freely and become larger, which could be seen in increasing mineral plate thickness and crystallinity. We found that union was not achieved in the NaCl group, despite some sparse bone formation in the gap area. On the contrary, all samples in the groups were judged to be completely healed. These findings are consistent with our previous studies using the same animal model with larger number of animals per group.25,26,40 In this study, the most noticeable limitation is the small number of samples. However, the current results are encouraging and suggest clear and significant differences in composition and mineral structure between the control cortex and fracture callus. Small number of samples is generally used in SAXS studies of bone.5,8,13,16 For example, Pleshko-Camacho et al. had one sample in their study,5 whereas Rinnerthaler et al. used two samples8 and in a more recent study Bünger et al. has 12 samples divided into four treatment groups.13 In the study by Liu et al., the callus tissue of four different aged sheep was investigated using SAXS.16 The main reason for the small number of samples is that the measurements are time consuming and that synchrotron beam time is highly limited. Another limitation is the spatial resolution of the SAXS scanning, which was 200 μm in this study. A more focused beam would allow better spatial resolution, which in turn would be beneficial when measuring the fine structured callus tissue. Additionally, the data were averaged over the sample thickness. The optimal thickness of SAXS samples ranges from below 100 up to 600 μm.24 The thickness in this study was 300 μm and although it is somewhat thicker than the beam size used (200 μm), it is still within these limits. 5.ConclusionThe current study contributes to the highly limited data on FTIR and SAXS on fracture healing and hard callus development and discusses important aspects of the use of SAXS on the newly formed bone. The methods indeed provide complementary information. Although FTIR enables reporting of the composition, the SAXS data enable assessment of mineral plate orientation and thickness, as well as the orientation of the collagen fibers. In conclusion, significant differences were found in the molecular composition and mineral structure between the fracture callus, fracture cortex, and control cortex. These techniques may also prove to be useful for the evaluation of effects of therapies on fracture healing. Taken together, the results indicate that SAXS is feasible when evaluating the mineral structure of the bone fracture callus and highlight the complementary nature of the two techniques. AcknowledgmentsThis work was supported by the European Commission (FRACQUAL-293434), the Swedish Agency for Innovation Systems, the Swedish Research Council through the Linnaeus Center Organizing Molecular Matter, MAX IV Laboratory, the Foundation of Greta and Johan Kock, the strategic funding of the University of Eastern Finland, and the National Doctoral Programme of Musculoskeletal Disorders and Biomaterials (TBDP). ReferencesA. Schindeleret al.,
“Bone remodeling during fracture repair: the cellular picture,”
Semin. Cell Dev. Biol., 19
(5), 459
–466
(2008). http://dx.doi.org/10.1016/j.semcdb.2008.07.004 1084-9521 Google Scholar
T. A. Einhorn,
“The science of fracture healing,”
J. Orthop. Trauma, 19
(10 Supplement), S4
–S6
(2005). http://dx.doi.org/10.1097/00005131-200511101-00002 JORTE5 0890-5339 Google Scholar
S. Govenderet al.,
“Recombinant human bone morphogenetic protein-2 for treatment of open tibial fractures: a prospective, controlled, randomized study of four hundred and fifty patients,”
J. Bone Joint Surg. Am., 84-A
(12), 2123
–2134
(2002). Google Scholar
A. K. Hardinget al.,
“Manipulating the anabolic and catabolic response in bone graft remodeling: synergism by a combination of local BMP-7 and a single systemic dosis of zoledronate,”
J. Orthop. Res., 26
(9), 1245
–1249
(2008). http://dx.doi.org/10.1002/jor.v26:9 JOREDR 0736-0266 Google Scholar
N. Pleshko-Camachoet al.,
“Complementary information on bone ultrastructure from scanning small angle X-ray scattering and Fourier-transform infrared microspectroscopy,”
Bone, 25
(3), 287
–293
(1999). http://dx.doi.org/10.1016/S8756-3282(99)00165-9 8756-3282 Google Scholar
H. Isakssonet al.,
“Infrared spectroscopy indicates altered bone turnover and remodeling activity in renal osteodystrophy,”
J. Bone Miner. Res., 25
(6), 1360
–1366
(2010). http://dx.doi.org/10.1002/jbmr.10 JBMREJ 0884-0431 Google Scholar
E. P. Paschaliset al.,
“FTIR microspectroscopic analysis of normal human cortical and trabecular bone,”
Calcif. Tissue Int., 61
(6), 480
–486
(1997). http://dx.doi.org/10.1007/s002239900371 CTINDZ 0171-967X Google Scholar
S. Rinnerthaleret al.,
“Scanning small angle X-ray scattering analysis of human bone sections,”
Calcif. Tissue Int., 64
(5), 422
–429
(1999). http://dx.doi.org/10.1007/PL00005824 CTINDZ 0171-967X Google Scholar
P. Fratzlet al.,
“Effects of sodium fluoride and alendronate on the bone mineral in minipigs: a small-angle X-ray scattering and backscattered electron imaging study,”
J. Bone Miner. Res., 11
(2), 248
–253
(1996). http://dx.doi.org/10.1002/jbmr.5650110214 JBMREJ 0884-0431 Google Scholar
M. J. Turunenet al.,
“Comparison between infrared and Raman spectroscopic analysis of maturing rabbit cortical bone,”
Appl. Spectrosc., 65
(6), 595
–603
(2011). http://dx.doi.org/10.1366/10-06193 APSPA4 0003-7028 Google Scholar
E. Donnellyet al.,
“Effects of tissue age on bone tissue material composition and nanomechanical properties in the rat cortex,”
J. Biomed. Mater. Res. A, 92
(3), 1048
–1056
(2010). http://dx.doi.org/10.1002/jbm.a.32442 Google Scholar
E. P. Paschaliset al.,
“FTIR microspectroscopic analysis of human osteonal bone,”
Calcif. Tissue Int., 59
(6), 480
–487
(1996). http://dx.doi.org/10.1007/BF00369214 CTINDZ 0171-967X Google Scholar
M. H. Büngeret al.,
“Strontium and bone nanostructure in normal and ovariectomized rats investigated by scanning small-angle X-ray scattering,”
Calcif. Tissue Int., 86
(4), 294
–306
(2010). http://dx.doi.org/10.1007/s00223-010-9341-8 CTINDZ 0171-967X Google Scholar
X. Yanget al.,
“Callus mineralization and maturation are delayed during fracture healing in interleukin-6 knockout mice,”
Bone, 41
(6), 928
–936
(2007). http://dx.doi.org/10.1016/j.bone.2007.07.022 8756-3282 Google Scholar
H. Ouyanget al.,
“Fourier transform infrared microscopic imaging: effects of estrogen and estrogen deficiency on fracture healing in rat femurs,”
Appl. Spectrosc., 58
(1), 1
–9
(2004). http://dx.doi.org/10.1366/000370204322729405 APSPA4 0003-7028 Google Scholar
Y. Liuet al.,
“Size and habit of mineral particles in bone and mineralized callus during bone healing in sheep,”
J. Bone Miner. Res., 25
(9), 2029
–2038
(2010). http://dx.doi.org/10.1002/jbmr.84 JBMREJ 0884-0431 Google Scholar
A. BoskeyR. Mendelsohn,
“Infrared analysis of bone in health and disease,”
J. Biomed. Opt., 10
(3), 031102
(2005). http://dx.doi.org/10.1117/1.1922927 JBOPFO 1083-3668 Google Scholar
M. J. Turunenet al.,
“Age-related changes in organization and content of the collagen matrix in rabbit cortical bone,”
J. Orthop. Res., 30
(3), 435
–442
(2012). http://dx.doi.org/10.1002/jor.v30.3 JOREDR 0736-0266 Google Scholar
A. BoskeyN. Pleshko Camacho,
“FT-IR imaging of native and tissue-engineered bone and cartilage,”
Biomaterials, 28
(15), 2465
–2478
(2007). http://dx.doi.org/10.1016/j.biomaterials.2006.11.043 BIMADU 0142-9612 Google Scholar
N. PleshkoA. BoskeyR. Mendelsohn,
“Novel infrared spectroscopic method for the determination of crystallinity of hydroxyapatite minerals,”
Biophys. J., 60
(4), 786
–793
(1991). http://dx.doi.org/10.1016/S0006-3495(91)82113-0 BIOJAU 0006-3495 Google Scholar
E. P. Paschaliset al.,
“Spectroscopic characterization of collagen cross-links in bone,”
J. Bone Miner. Res., 16
(10), 1821
–1828
(2001). http://dx.doi.org/10.1359/jbmr.2001.16.10.1821 JBMREJ 0884-0431 Google Scholar
L. Spevaket al.,
“Fourier transform infrared spectroscopic imaging parameters describing acid phosphate substitution in biologic hydroxyapatite,”
Calcif. Tissue Int., 92
(5), 418
–428
(2013). http://dx.doi.org/10.1007/s00223-013-9695-9 CTINDZ 0171-967X Google Scholar
P. Fratzl,
“Statistical model of the habit and arrangement of mineral crystals in the collagen of bone,”
J. Stat. Phys., 77
(1–2), 125
–143
(1994). http://dx.doi.org/10.1007/BF02186835 JSTPSB 0022-4715 Google Scholar
P. FratzlS. SchreiberK. Klaushofer,
“Bone mineralization as studied by small-angle x-ray scattering,”
Connect. Tissue Res., 34
(4), 247
–254
(1996). http://dx.doi.org/10.3109/03008209609005268 CVTRBC 0300-8207 Google Scholar
M. Tagilet al.,
“Intermittent PTH(1-34) does not increase union rates in open rat femoral fractures and exhibits attenuated anabolic effects compared to closed fractures,”
Bone, 46
(3), 852
–859
(2010). http://dx.doi.org/10.1016/j.bone.2009.11.009 8756-3282 Google Scholar
P. Bosemarket al.,
“Augmentation of autologous bone graft by a combination of bone morphogenic protein and bisphosphonate increased both callus volume and strength,”
Acta Orthop., 84
(1), 106
–111
(2013). http://dx.doi.org/10.3109/17453674.2013.773123 1745-3674 Google Scholar
A. Labradoret al.,
“The yellow mini-hutch for SAXS experiments at MAX IV Laboratory,”
J. Phys.: Conf. Ser., 425 072019
(2013). http://dx.doi.org/10.1088/1742-6596/425/7/072019 1742-6588 Google Scholar
P. Fratzlet al.,
“Mineral crystals in calcified tissues: a comparative study by SAXS,”
J. Bone Miner. Res., 7
(3), 329
–334
(1992). http://dx.doi.org/10.1002/jbmr.5650070313 JBMREJ 0884-0431 Google Scholar
J. Rieppoet al.,
“Reference sample method reduces the error caused by variable cryosection thickness in Fourier transform infrared imaging,”
Appl. Spectrosc., 58
(1), 137
–140
(2004). http://dx.doi.org/10.1366/000370204322729577 APSPA4 0003-7028 Google Scholar
F. L. Bach-Gansmoet al.,
“Calcified cartilage islands in rat cortical bone,”
Calcif. Tissue Int., 92
(4), 330
–338
(2013). http://dx.doi.org/10.1007/s00223-012-9682-6 CTINDZ 0171-967X Google Scholar
C. Reyet al.,
“Resolution-enhanced Fourier transform infrared spectroscopy study of the environment of phosphate ion in the early deposits of a solid phase of calcium phosphate in bone and enamel and their evolution with age: 2. Investigations in the domain,”
Calcif. Tissue Int., 49
(6), 383
–388
(1991). http://dx.doi.org/10.1007/BF02555847 CTINDZ 0171-967X Google Scholar
K. Verdeliset al.,
“DSPP effects on in vivo bone mineralization,”
Bone, 43
(6), 983
–990
(2008). http://dx.doi.org/10.1016/j.bone.2008.08.110 8756-3282 Google Scholar
J. E. Robertset al.,
“Characterization of very young mineral phases of bone by solid state 31phosphorus magic angle sample spinning nuclear magnetic resonance and X-ray diffraction,”
Calcif. Tissue Int., 50
(1), 42
–48
(1992). http://dx.doi.org/10.1007/BF00297296 CTINDZ 0171-967X Google Scholar
L. M. Milleret al.,
“In situ analysis of mineral content and crystallinity in bone using infrared micro-spectroscopy of the nu(4) PO(4)(3–) vibration,”
Biochim. Biophys. Acta, 1527
(1–2), 11
–19
(2001). http://dx.doi.org/10.1016/S0304-4165(01)00093-9 BBACAQ 0006-3002 Google Scholar
M. H. Büngeret al.,
“Bone nanostructure near titanium and porous tantalum implants studied by scanning small angle X-ray scattering,”
Eur. Cells Mater., 12 81
–91
(2006). ECMUBB 1473-2262 Google Scholar
P. Fratzlet al.,
“Nucleation and growth of mineral crystals in bone studied by small-angle X-ray scattering,”
Calcif. Tissue Int., 48
(6), 407
–413
(1991). http://dx.doi.org/10.1007/BF02556454 CTINDZ 0171-967X Google Scholar
A. Martenet al.,
“On the mineral in collagen of human crown dentine,”
Biomaterials, 31
(20), 5479
–5490
(2010). http://dx.doi.org/10.1016/j.biomaterials.2010.03.030 BIMADU 0142-9612 Google Scholar
J. A. Buckwalteret al.,
“Bone biology. I: Structure, blood supply, cells, matrix, and mineralization,”
J. Bone Joint Surg. Am., 77
(8), 1256
–1275
(1995). Google Scholar
J. A. Buckwalteret al.,
“Bone biology. II: Formation, form, modeling, remodeling, and regulation of cell function,”
J. Bone Joint Surg. Am., 77
(8), 1276
–1289
(1995). Google Scholar
N. Mathavanet al.,
“Investigating the synergistic efficacy of BMP-7 and zoledronate on bone allografts using an open rat osteotomy model,”
Bone, 56
(2), 440
–448
(2013). http://dx.doi.org/10.1016/j.bone.2013.06.030 8756-3282 Google Scholar
BiographyMikael J. Turunen is a postdoctoral researcher at the University of Eastern Finland, Kuopio, Finland, where he also received his PhD degree in medical physics in 2013. He has studied the composition, microstructure, and mineral structure of bone using a variety of analytical methods including spectroscopy, microscopy, tomography, and x-ray scattering. Sebastian Lages received his PhD degree from the University of Paderborn, Paderborn, Germany, and was a postdoctoral researcher at the Department of Physical Chemistry, Lund University, Lund, Sweden. He studies the behavior of polymer-, colloid-, and nanoparticle formulations using scattering, calorimetric, and rheological methods. Ana Labrador is a researcher at the SAXS beamline at the MAX IV Laboratory, Lund, Sweden. She received her PhD in physics from Aarhus University, Denmark, in 2001. Since then she has worked on synchrotron diagnostic system in Barcelona, and construction and operation of BM16 beamline at ESRF, France, as well as involved in Spanish synchrotron science in small molecules, cultural heritage, metallic glasses, and high pressure. Ulf Olsson is a professor in physical chemistry at Lund University. His research is focused on soft matter, mainly applying various scattering methods to the study of structure, interactions, and dynamics of self-assembly colloids. Magnus Tägil is a consultant and professor at the Department of Orthopedic Surgery at Lund University, Lund, Sweden. He has been active in bone research, both clinically and experimentally with the main focus on fractures and how to improve fracture healing. Jukka S. Jurvelin is a professor of medical physics at the Department of Applied Physics, University of Eastern Finland. He received his PhD degree in 1993 from the University of Kuopio, Finland, and worked as a postdoctoral researcher from 1993 to 1995 at the Mueller Institute for Biomechanics, Bern, Switzerland. His research interests include development of quantitative biomechanical and imaging methods for sensitive diagnostics of osteoporosis and osteoarthritis. Hanna Isaksson is an associate professor in biomechanics at Lund University, Lund, Sweden. She received her PhD degree in biomedical engineering from Eindhoven University of Technology in 2007, and was thereafter a postdoctoral researcher at the University of Eastern Finland, Kuopio, Finland (2008 to 2011). Her research focuses on the assessment of bone quality using imaging, spectroscopic, and diffraction methods in combination with computational modeling. |
||||||||||||||||||||||||||||||||||||||||||||||||||||||


