|
|
1.IntroductionBiochemical composition,1–3 biomechanical properties,4 and grade of osteoarthritis5,6 of articular cartilage (AC) have been evaluated with Fourier transform infrared (FT-IR) spectroscopic methods. There has been increasing interest toward multivariate analysis methods in FT-IR spectroscopic studies of AC. These methods include, e.g., principal component regression,2,7 partial least squares (PLS) regression,8,9 and cluster analysis.10–14 Multivariate regression methods are attractive because they can utilize overlapping data, i.e., it is not necessary to find a characteristic absorption peak for each compound in the sample. Instead, multivariate models can be built using the whole acquired wavenumber range. However, some of the variables may be irrelevant, noisy, or otherwise unreliable in the situation of interest.15 Therefore, the model may benefit, if unnecessary variables are removed from the data before conduction of multivariate regression analysis. In a recent study, genetic algorithm (GA) was applied for variable selection when compressive stiffness of AC was predicted from FT-IR spectra.4 Direct application of GA is problematic if the data contains lots of variables because the probability of finding chance correlation and overfitting increases. Therefore, in that study, the variables were averaged using a spectral window to decrease the number of variables. Averaging effectively reduces the possibility of overfitting. Unfortunately, some narrow peaks can be lost as a result of averaging, which can decrease the prediction accuracy. Alternative means to reduce the number of variables are needed to obtain best results with GA. Backward interval PLS (biPLS) is an algorithm that can be used to remove unnecessary spectral windows from the spectra before PLS regression.15 In biPLS, the spectral data is divided into equal-sized spectral windows. The effect of removal of each spectral window to the model prediction is calculated. After finding the best PLS regression model, the corresponding window is removed. The process can be repeated until there is only one window left or until enough windows have been removed. The PLS regression model could then be built using the best combination of spectral windows found from biPLS. Alternatively, variable selection can be further continued by applying GA to the variables that are left after biPLS. Thus far, the biPLS method has not yet been applied to FT-IR studies of AC. The aim of this study was to predict the collagen and proteoglycan contents in bovine AC using FT-IR spectroscopy and PLS regression. Biochemical analysis of collagen and proteoglycan contents served as reference. As a second aim, it was evaluated whether the variable selection algorithms biPLS and GA can further improve the prediction results. 2.Materials and Methods2.1.Sample PreparationThe samples used in this study were originally collected in earlier studies.16,17 Briefly, osteochondral samples () were drilled from healthy and osteoarthritic bovine patellae (). The samples were split into two halves. A smaller cylindrical () sample was taken from the other half for other analyses, while the remaining cartilage was used for biochemical reference measurements. The other half was fixed with 10% formalin, decalcified with EDTA, dehydrated, and embedded in paraffin. 2.2.FT-IR Spectroscopic ImagingNew 5-μm-thick sections were cut from the paraffin blocks for the FT-IR spectroscopic measurements. The sections were dewaxed prior to placing them onto 2-mm-thick ZnSe windows. Measurements were conducted with the Perkin Elmer Spotlight 300 FT-IR imaging system (Perkin Elmer, Shelton, Connecticut) in transmission mode using spectral and pixel resolutions of and 25 μm, respectively. A dry air purge (Parker Balston, Haverhill, Massachusetts) was used to minimize the variation in the measurement conditions. A 400-μm-wide area was imaged from cartilage surface to cartilage-bone junction from each section. The spectra of each section were first averaged to obtain one mean spectrum. Subsequently, extended multiplicative signal correction was used to remove the scattering-related baseline variations from the spectra.18 2.3.PLS RegressionSpectral region of 800 to was used in the analysis. Optimal number of PLS components for the models was chosen by performing a leave-one-out cross-validation and calculating the root-mean-square error of cross-validation (RMSECV). Minimum RMSECV value indicated the best model. Leave-one-out cross-validation was used for validation of all PLS regression models. 2.4.biPLS RegressionThe spectra were divided into 20 equal-sized spectral windows. The effect of removal of each spectral window to the model prediction was evaluated by calculating the RMSECV for each PLS regression model built using the combination of remaining 19 spectral windows. The window whose removal resulted in the lowest RMSECV was removed. The procedure was repeated until 12 out of 20 spectral windows were removed. GA was applied to the remaining eight windows. The biPLS procedure was continued until there was only one window remaining. Thereafter, the combination of spectral windows that resulted in the best model achievable by biPLS was searched and compared with other models in the study. 2.5.GA for Wavenumber Selection after biPLSGAs are optimization methods based on the principles of natural evolution.19 GA is described in more detail in our previous article.4 It has been reported that the variables-to-objects ratio should be less than 5 to obtain the best performance when GAs are used.15 To obtain a reasonable variables-to-object ratio for GA, the eight remaining spectral windows after biPLS were averaged using a spectral window. Consequently, the number of variables was 100 and the variables-to-objects ratio was less than 4. The parameters used in the GA were as follows. The population size: 100, gene initialization probability: 5%, cross-over method: one-point, cross-over probability: 80%, mutation probability: 1%, number of generations: 100, response (to be minimized): RMSECV of the prediction. The number of PLS components for proteoglycans and collagen were chosen based on the full-spectrum model. GA was run 100 times, and the frequency with which each variable was selected in the best chromosome was calculated. When the final model was built, variables were added to the model according to the frequency of selections. The variable combination that resulted in minimal prediction error was chosen as the final model. 2.6.Biochemical AnalysisUronic acid20 and hydroxyproline21 contents were determined to serve as reference information for proteoglycan and collagen contents, respectively. Uronic acid content was determined for all samples (), whereas hydroxyproline content could be determined for 28 samples.16,17 2.7.Statistical AnalysisLinear correlation coefficients between the biochemically determined proteoglycan or collagen content and the content predicted from the FT-IR spectra by different multivariate regression models were calculated. The statistical significance of the difference between the correlation coefficients was tested by using Steiger’s Z-test.22 The test utilizes Fisher’s -to- transformation for comparing two dependent correlation coefficients.22 3.Results3.1.Models Using Full SpectrumThree and four PLS components were found to be optimal for proteoglycan and collagen contents, respectively. The correlation coefficient between the uronic acid (proteoglycan) content and the content predicted by the full-spectrum PLS regression model was (). The correlation coefficient between the hydroxyproline (collagen) content and the content predicted by the full-spectrum PLS regression model was (). 3.2.biPLSThe spectral regions that were selected for the prediction of the proteoglycan content by biPLS are shown in Fig. 1(a). The correlation coefficient between the uronic acid content and the content predicted by the biPLS regression model was () [Fig. 1(b)]. The correlation coefficient was statistically significantly higher than that of the full-spectrum model. The spectral regions that were selected for the prediction of the collagen content are shown in Fig. 2(a). The correlation coefficient between the hydroxyproline content and the content predicted by the biPLS regression model was () [Fig. 2(b)]. This correlation coefficient was also statistically significantly higher than that of the full spectrum model. Figure 3 shows the correlation coefficients as a function of the number of windows used in biPLS. Fig. 1(a) Spectral regions selected by biPLS for the prediction of the uronic acid content in AC are marked by a gray fill. (b) A scatter plot between the reference values of uronic acid content and the content predicted by the biPLS regression model. 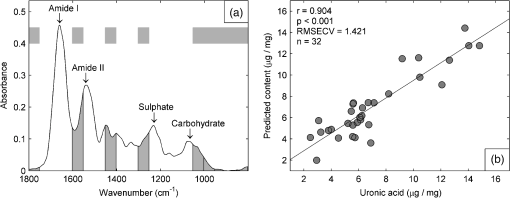 Fig. 2(a) Spectral regions selected by biPLS for the prediction of the hydroxyproline content in AC are marked by a gray fill. (b) A scatter plot between the reference values of hydroxyproline content and the content predicted by the biPLS regression model. 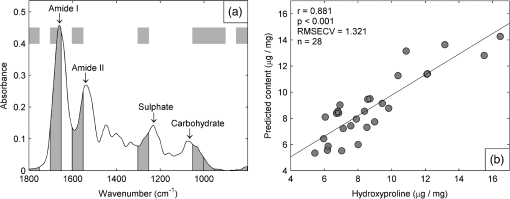 Fig. 3Correlation coefficient between the reference values of uronic acid (white circles) and hydroxyproline (black squares) contents and biPLS regression models as a function of the number of windows used in biPLS. Correlation coefficients for the models using only the last windows are not visible in the plot as they were significantly smaller ( and 0.30 for uronic acid and hydroxyproline, respectively) than the other values. 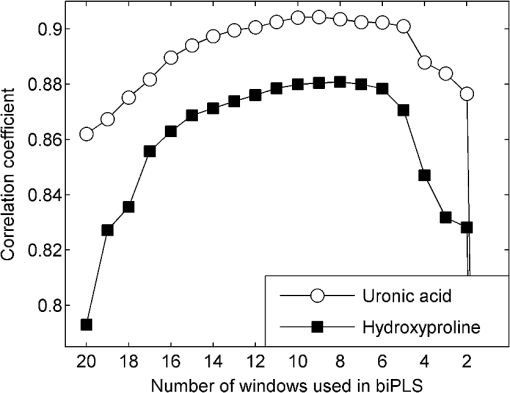 3.3.GA after biPLSbiPLS was first used to remove 12 out of 20 spectral windows. The remaining eight spectral windows are shown in light gray shading in Figs. 4(a) and 5(a) for proteoglycans and collagen, respectively. GA was applied to the remaining spectral windows. The 11 spectral variables that were selected for the prediction of the proteoglycan content by the GA are shown in Fig. 4(a). The correlation coefficient between the uronic acid content and the content predicted by the PLS regression model was () [Fig. 4(b)]. The correlation coefficient was statistically significantly higher than that of the full-spectrum model. The 21 spectral variables that were selected for the prediction of the collagen content by the GA are shown in Fig. 5(a). The correlation coefficient between the hydroxyproline content and the content predicted by the PLS regression model was () [Fig. 5(b)]. The correlation coefficient was statistically significantly higher than that of the full-spectrum model. The results are summarized in Table 1. Fig. 4(a) The eight spectral regions remaining after biPLS for the prediction of the uronic acid content in AC are marked by a light gray fill. The spectral variables selected by GA for the prediction of the uronic acid content in AC are marked by a black fill. (b) A scatter plot between the reference values of uronic acid content and the content predicted by the PLS regression model that used the variables selected by GA. 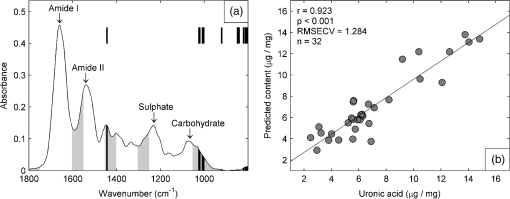 Fig. 5(a) The eight spectral regions remaining after biPLS for the prediction of the hydroxyproline content in AC are marked by a light gray fill. The spectral variables selected by GA for the prediction of the hydroxyproline content in AC are marked by a black fill. (b) A scatter plot between the reference values of hydroxyproline content and the content predicted by the PLS regression model that used the variables selected by GA. 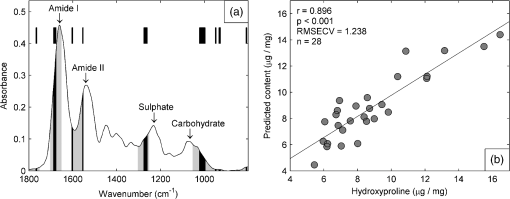 Table 1Linear correlation coefficients (r) between the different PLS regression models and biochemical reference information. 4.DiscussionThe aim of this study was to predict the biochemical composition of AC using FT-IR spectroscopy, PLS regression, and variable selection algorithms. The major components of AC, proteoglycans, and collagen were successfully determined from FT-IR spectra using multivariate regression. The results of the study demonstrate that variable selection algorithms significantly improve the multivariate regression models when predicting uronic acid and hydroxyproline contents in AC. biPLS with or without GA showed improved correlation with the biochemically determined reference information as compared with the full-spectrum PLS regression models. GA seemed to improve the results as compared with biPLS but the difference did not reach the limit of statistical significance. The spectral regions selected by the biPLS were very similar for both uronic acid [Fig. 1(a)] and hydroxyproline [Fig. 2(a)]. Both used the carbohydrate region (950 to ), sulfate region (1250 to ), and amide II region (1550 to ). Hydroxyproline used fraction of amide I region (1650 to ), while the spectral region of 1400 to was included in the uronic acid model. The similarities in the spectral regions between these two are not that surprising, considering that the spectra of collagen and proteoglycans overlap each other.1 Because there are no specific absorption peaks for either of these components, the multivariate regression model requires information on both collagen and proteoglycans. There are more significant differences between uronic acid and hydroxyproline in spectral variables selected by the GA. The uronic acid model heavily utilizes the carbohydrate region [Fig. 4(a)], which is known to be linked to proteoglycans.1,23,24 In addition to the carbohydrate and the sulfate regions, the hydroxyproline model also uses amide I and amide II regions which are traditionally used for the analysis of collagen content1 [Fig. 5(a)]. Collagen and proteoglycan contents in AC have earlier been predicted from FT-IR spectra using multivariate regression models.2,7–9 These studies used a wide spectral region in the multivariate models but still indicated superior performance compared with traditional univariate methods. Collagen and proteoglycans form the majority of the dry matrix of AC. Therefore, it is not that critical to select the optimal spectral regions when predicting collagen and proteoglycan contents in AC. Although the earlier results have been good, the variable selection algorithms can be used to further improve the models. In this study, it was found that biPLS provides a relatively easy and objective way to select optimal spectral regions for PLS regression. The results could still be further optimized by testing different spectral window sizes in biPLS.15 GA is a more complicated and time-consuming method for variable selection, but it may improve the prediction accuracy over that of biPLS alone. Multivariate regression models may be built to predict smaller molecular components of AC such as collagen cross-links or different collagen types. Furthermore, these models may also be useful to predict more complex phenomena such as biomechanical function of AC or progress of osteoarthritis. As these are not expected to be the origins of main features of AC FT-IR spectra, the variable selection algorithms may become even more important in the future. We used 10-year-old formalin-fixed paraffin-embedded (FFPE) samples in this study. In general, FFPE samples are highly stable.25 Fixation and storage time of FFPE samples have been shown to hinder the analysis of ribonucleic acids. On the other hand, proteomic investigations of abundant proteins in FFPE samples have been successfully conducted even from older samples without problems.26 There exists large number of FFPE samples in different laboratories, and some of these samples are decades old.25 Therefore, it would be beneficial if the composition of old FFPE samples could be analyzed accurately. The results of this study show that the macromolecular composition of AC can be accurately determined from 10-year-old FFPE samples. However, we cannot say if the current models work equally well in case of FFPE samples of different ages. Further studies comparing FFPE samples of different ages are needed to clarify this matter. AcknowledgmentsThe financial support from the University of Eastern Finland (Strategic funding); Kuopio University Hospital (EVO Grant 5041724); Academy of Finland (project 268378); North Savo Regional Fund of The Finnish Cultural Foundation; National Doctoral Programme of Musculoskeletal Disorders and Biomaterials; and University of Oulu (Strategic funding) is acknowledged. The funders had no role in the study design, data collection, data analysis, or interpretation of data. ReferencesN. P. Camachoet al.,
“FTIR microscopic imaging of collagen and proteoglycan in bovine cartilage,”
Biopolymers, 62
(1), 1
–8
(2001). http://dx.doi.org/10.1002/(ISSN)1097-0282 BIPMAA 0006-3525 Google Scholar
J. YinY. XiaM. Lu,
“Concentration profiles of collagen and proteoglycan in articular cartilage by Fourier transform infrared imaging and principal component regression,”
Spectrochim. Acta A Mol. Biomol. Spectrosc., 88 90
–96
(2012). http://dx.doi.org/10.1016/j.saa.2011.12.002 SAMCAS 1386-1425 Google Scholar
K. Potteret al.,
“Imaging of collagen and proteoglycan in cartilage sections using Fourier transform infrared spectral imaging,”
Arthritis Rheum., 44
(4), 846
–855
(2001). http://dx.doi.org/10.1002/(ISSN)1529-0131 2326-5191 Google Scholar
L. Rieppoet al.,
“Prediction of compressive stiffness of articular cartilage using Fourier transform infrared spectroscopy,”
J. Biomech., 46
(7), 1269
–1275
(2013). http://dx.doi.org/10.1016/j.jbiomech.2013.02.022 JBMCB5 0021-9290 Google Scholar
A. Hanifiet al.,
“Clinical outcome of autologous chondrocyte implantation is correlated with infrared spectroscopic imaging-derived parameters,”
Osteoarthritis Cartilage, 20
(9), 988
–996
(2012). http://dx.doi.org/10.1016/j.joca.2012.05.007 OSCAEO 1063-4584 Google Scholar
A. Hanifiet al.,
“Infrared fiber optic probe evaluation of degenerative cartilage correlates to histological grading,”
Am. J. Sports Med., 40
(12), 2853
–2861
(2012). http://dx.doi.org/10.1177/0363546512462009 AJSMDO 0363-5465 Google Scholar
J. YinY. Xia,
“Macromolecular concentrations in bovine nasal cartilage by Fourier transform infrared imaging and principal component regression,”
Appl. Spectrosc., 64
(11), 1199
–1208
(2010). http://dx.doi.org/10.1366/000370210793335124 APSPA4 0003-7028 Google Scholar
L. Rieppoet al.,
“Fourier transform infrared spectroscopic imaging and multivariate regression for prediction of proteoglycan content of articular cartilage,”
PLoS One, 7
(2), e32344
(2012). http://dx.doi.org/10.1371/journal.pone.0032344 1932-6203 Google Scholar
A. Hanifiet al.,
“Fourier transform infrared imaging and infrared fiber optic probe spectroscopy identify collagen type in connective tissues,”
PLoS One, 8
(5), e64822
(2013). http://dx.doi.org/10.1371/journal.pone.0064822 1932-6203 Google Scholar
A. M. Croxfordet al.,
“Specific antibody protection of the extracellular cartilage matrix against collagen antibody-induced damage,”
Arthritis Rheum., 62
(11), 3374
–3384
(2010). http://dx.doi.org/10.1002/art.27671 2326-5191 Google Scholar
A. M. Croxfordet al.,
“Chemical changes demonstrated in cartilage by synchrotron infrared microspectroscopy in an antibody-induced murine model of rheumatoid arthritis,”
J. Biomed. Opt., 16
(6), 066004
(2011). http://dx.doi.org/10.1117/1.3585680 JBOPFO 1083-3668 Google Scholar
A. M. Croxfordet al.,
“Type II collagen-specific antibodies induce cartilage damage in mice independent of inflammation,”
Arthritis Rheum., 65
(3), 650
–659
(2013). http://dx.doi.org/10.1002/art.37805 2326-5191 Google Scholar
Y. Kobrinaet al.,
“Clustering of infrared spectra reveals histological zones in intact articular cartilage,”
Osteoarthritis Cartilage, 20
(5), 460
–468
(2012). http://dx.doi.org/10.1016/j.joca.2012.01.014 OSCAEO 1063-4584 Google Scholar
Y. Kobrinaet al.,
“Cluster analysis of infrared spectra can differentiate intact and repaired articular cartilage,”
Osteoarthritis Cartilage, 21
(3), 462
–469
(2013). http://dx.doi.org/10.1016/j.joca.2012.12.005 OSCAEO 1063-4584 Google Scholar
R. LeardiL. Nørgaard,
“Sequential application of backward interval partial least squares and genetic algorithms for the selection of relevant spectral regions,”
J. Chemom., 18
(11), 486
–497
(2004). http://dx.doi.org/10.1002/(ISSN)1099-128X JOCHEU 0886-9383 Google Scholar
S. Saarakkalaet al.,
“Ultrasound indentation of normal and spontaneously degenerated bovine articular cartilage,”
Osteoarthritis Cartilage, 11
(9), 697
–705
(2003). http://dx.doi.org/10.1016/S1063-4584(03)00154-7 OSCAEO 1063-4584 Google Scholar
J. Toyraset al.,
“Speed of sound in normal and degenerated bovine articular cartilage,”
Ultrasound Med. Biol., 29
(3), 447
–454
(2003). http://dx.doi.org/10.1016/S0301-5629(02)00708-1 USMBA3 0301-5629 Google Scholar
N. K. AfsethA. Kohler,
“Extended multiplicative signal correction in vibrational spectroscopy: a tutorial,”
Chemom. Intell. Lab. Syst., 117
(0), 92
–99
(2012). http://dx.doi.org/10.1016/j.chemolab.2012.03.004 CILSEN 0169-7439 Google Scholar
C. M. AndersenR. Bro,
“Variable selection in regression: a tutorial,”
J. Chemom., 24
(11–12), 728
–737
(2010). http://dx.doi.org/10.1002/cem.v24.11/12 JOCHEU 0886-9383 Google Scholar
N. BlumenkrantzG. Asboe-Hansen,
“New method for quantitative determination of uronic acids,”
Anal Biochem., 54
(2), 484
–489
(1973). http://dx.doi.org/10.1016/0003-2697(73)90377-1 ANBCA2 0003-2697 Google Scholar
D. E. Schwartzet al.,
“Quantitative analysis of collagen, protein and DNA in fixed, paraffin-embedded and sectioned tissue,”
Histochem. J., 17
(6), 655
–663
(1985). http://dx.doi.org/10.1007/BF01003517 HISJAE 0018-2214 Google Scholar
J. H. Steiger,
“Tests for comparing elements of a correlation matrix,”
Psychol. Bull., 87
(2), 245
–251
(1980). http://dx.doi.org/10.1037/0033-2909.87.2.245 PSBUAI 0033-2909 Google Scholar
L. Rieppoet al.,
“Application of second derivative spectroscopy for increasing molecular specificity of Fourier transform infrared spectroscopic imaging of articular cartilage,”
Osteoarthritis Cartilage, 20
(5), 451
–459
(2012). http://dx.doi.org/10.1016/j.joca.2012.01.010 OSCAEO 1063-4584 Google Scholar
M. Kimet al.,
“Fourier transform infrared imaging spectroscopic analysis of tissue engineered cartilage: histologic and biochemical correlations,”
J. Biomed. Opt., 10
(3), 031105
(2005). http://dx.doi.org/10.1117/1.1922329 JBOPFO 1083-3668 Google Scholar
S. M. Hewittet al.,
“Tissue handling and specimen preparation in surgical pathology: issues concerning the recovery of nucleic acids from formalin-fixed, paraffin-embedded tissue,”
Arch. Pathol. Lab. Med., 132
(12), 1929
–1935
(2008). APLMAS 0003-9985 Google Scholar
S. MagdeldinT. Yamamoto,
“Toward deciphering proteomes of formalin-fixed paraffin-embedded (FFPE) tissues,”
Proteomics, 12
(7), 1045
–1058
(2012). http://dx.doi.org/10.1002/pmic.201100550 PROTC7 1615-9853 Google Scholar
|

