
|
|
1.IntroductionOver the past decade, fluorescence microscopy has provided visual insight into the temporal and spatial interactions of molecules at a cellular and subcellular level. Continuing advancements into fluorescence microscopy have led to imaging that is less damaging to biological material, thus enabling visualization of living tissues at a greater penetration depth. Multiphoton microscopy (MPM) is such a technology. It has brought the visualization and localization of cellular interactions, typically seen only in cell culture models, to living animals. Conventional confocal microscopy relies on a stream of single photons to procure two- and three-dimensional (3-D) images, whereas MPM uses rapidly pulsed photons at half of the single photon energy required to excite the fluorophore. MPM is sometimes referred to as two-photon excitation microscopy or two-photon fluorescence. The simultaneous absorption of two lower-energy photons excites the fluorophore, reduces background fluorescence due to a narrow focal volume, and minimizes toxicity to the biological material due to photo bleaching. The use of lower-energy photons together with infrared lasers increases the effective tissue depth of imaging. MPM imaging has been used to study the structure and function in numerous systems, including liver,1–3 skin,4–8 cornea,9,10 thymus,11,12 and kidney.13–16 The kidney has a complex internal three-dimensional structure and a heterogeneous cell population, with glomeruli, tubules, interstitial space, and vasculature interacting in the vital kidney, an organ that is ideal for imaging with MPM. The renal interstitium, situated between the basement membranes of nephrons and the vessels, contains interstitial fibroblasts, dendritic cells, and occasional macrophages that quickly react to stress and damage of the intrinsic functioning tissues of the kidney. Developments in image reconstruction and analysis software have provided additional advancement to bring MPM imaging to its potential for analyzing the kidney in health and disease. This review will present an overview of the principles of MPM, MPM techniques for imaging the kidney, and examples of instances where MPM has been able to explain novel aspects of renal pathophysiology. 2.Principles and Advantages of Multiphoton MicroscopyThe basic principles of fluorescence apply to MPM imaging. Fluorescence occurs by the absorption of a photon by a fluorophore that brings an electron from the fluorophore to an excited state. The electron returning to its ground state causes the release of a photon (fluorescence emission photon), which is then efficiently detected.17,18 The initial excitation photon is typically of a high energy. This is known as single-photon fluorescence. MPM fluorescence is based on the simultaneous absorption of two low-energy, near-infrared wavelength photons by a fluorophore, and hence, the alternative name two-photon fluorescence (Fig. 1). Three-photon excitation and second harmonic generation work on similar principles and can also be used to visualize fluorescent optical sections.19 Fig. 1Pictorial representation of one-photon and two-photon fluorescence. Two-photon excitation demonstrates simultaneous absorption of infrared laser pulses at a single point compared to one-photon excitation, which uses visible or ultraviolet light lasers that excite photons throughout the biological material. Adapted from Ref. 20. 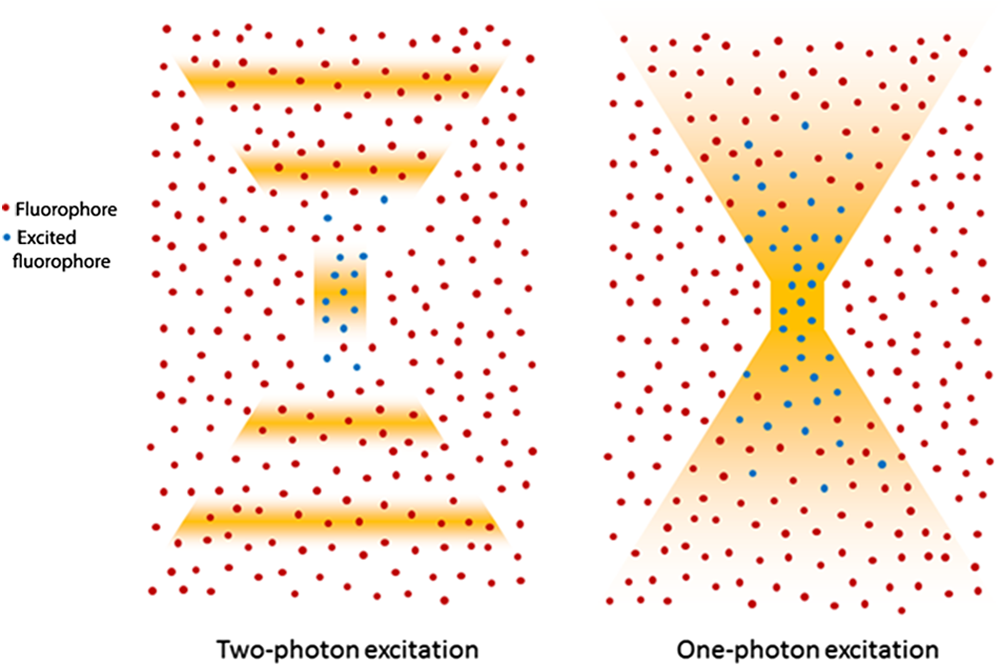 Although the energy of either of these photons is too low to raise an electron to an excited state, it is the combination of the two energies that is sufficient to excite and thus release a fluorescence emission photon. However, the two photons must meet the fluorophore at exactly the same time, within approximately an attosecond () of one another. During the early stages of development of MPM, this was difficult to achieve since simultaneous electronic stimulation at a single specified point was very unlikely. It was not until the development of higher-powered lasers () that could produce the necessary photon flux,21,22 as well as ultrashort pulsed laser systems22 that greatly reduced the power, that MPM became possible with biological material. A further advantage of using near-infrared wavelengths, instead of ultraviolet light, for fluorescence excitation was the reduction of scattering and increase in imaging penetration depth in the sample (from to 500 to 600 μm). Additionally, single-photon microscopy uses a pinhole detection device to remove out-of-focus and out-of-plane light. Removal of the pinhole allows fluorescence emission detectors to be placed closer to the microscope objective to optimize collection of scattered light, as well as enhance imaging depth. 3.Techniques for Imaging the KidneyVarious MPM approaches have been utilized to analyze the functioning kidney at the subcellular level. These include in vitro imaging,23,24 imaging of live isolated microperfused preparations of tubules, vessels, and glomeruli,25,26 and live perfused kidney slice preparations.27 Although MPM can produce significant information from in vitro experimental models, it is the whole live kidney where MPM techniques are used to their full potential. The interplay between segments of the nephron (glomeruli, tubule segments), the vasculature, and its contents, and the interstitium can be observed in detail. The choice of animal, microscope settings, surgical or pharmacological methods, autofluorescence and fluorescent dyes are all important considerations for the application of MPM to normal and diseased kidney. Limitations that have been discovered in other tissues apply equally in kidney research, and in some cases, the kidney presents its own set of problems. For example, early studies in neural tissue had demonstrated that the maximal tissue depth for two-photon excitation was 500 to 600 μm.28,29 The main problem of MPM in the kidney was that the depth was limited to a maximum of 150 to 200 μm. This is primarily due to substantial scattering of emission photons from the high refractive index and heterogeneity of kidney tissue. In addition, the ability of cytochrome c oxidase and hemoglobin to absorb light, and the spherical aberration (a deviation of rays of light through a spherical lens from the expected focal point) seen in the kidney, all contributed to a reduction in the maximal excitation depth.30,31 Another important consideration of intravital MPM is the possibility of photodamage and cytotoxicity due to extended periods of excitation, and adequate controls need to be included. The limitation in maximal excitation depth is important since glomerular depth from the renal capsule differs among rodents. For example, the kidneys of Munich-Wistar rats possess superficial glomeruli that are easily imaged with MPM. The afferent and efferent capillaries and Bowman’s space, as well as the contiguous S1 segment of the proximal tubule, can be seen in this model.32 In comparison, imaging of mouse kidneys is usually restricted to tubular and vascular structures because of the depth of their glomeruli. A quantitative analysis of glomerular depths from 10 commonly used mouse strains was performed by Schiessl and colleagues,33 who found that the BALB/c and C57Bl6 mouse strains contained the most superficial glomeruli at both 4 and 10 weeks of age, regardless of sex. However, it still remains challenging to visualize glomeruli in mice, and the use of MPM for studying the functional significance of certain glomerular genes or proteins, in specific gene knock-in and knockout strains of mice, is limited. Khoury and colleagues34 demonstrated podocyte biology in female nephrin knockout/green fluorescent protein (GFP) knock-in heterozygote () mice using superficially located glomeruli. Close-to-surface glomeruli have also been imaged using MPM in C57Bl6 mice;35 however, this was only possible in three- to four-week-old mice of weight. These mice have smaller kidneys and some glomeruli are sufficiently superficial in the cortex to be visualized via MPM. Another approach for visualizing glomeruli in mice is to use the posthydronephrosis model.36 In this model, one kidney undergoes ureteric ligation for 12 weeks to allow dilatation of the renal pelvis and marked tubulointerstitial atrophy. The remaining thin rim of transparent cortical tissue has clear glomeruli, and these can be visualized by both transmission and confocal microscopy. This approach also allows assessment of numerous glomeruli in the same animal and is particularly amendable for assessment of leukocyte recruitment during models of glomerular inflammation2–4 (Fig. 2). We have found that glomeruli in the C57Bl6 mouse kidney, made atrophic and fibrotic after ischemia-reperfusion injury (IRI), may be located superficially and visualized using MPM because of the atrophy of the tubulointerstitium (unpublished data). Thus, MPM offers enhanced knowledge of kidney pathophysiology from experimental studies, especially where modulation of mouse genetics is also used. Fig. 2Close-to-surface glomeruli from hydronephrotic mouse kidneys. Capillary endothelium is stained with isolectin B4-conjugated to Alexa Fluor 488 (green), neutrophils are stained using anti-Gr1-conjugated to phycoerythrin (arrows—orange/red), and surface myeloperoxidase (MPO) is stained with polyclonal anti-MPO-conjugated to Alexa-647 (arrow—blue) demonstrating activated neutrophils. Bright autofluorescence from remnants of the tubulointerstitium can be seen outside of glomeruli. Excitation wavelength was 810 nm and emitted signal was collected by three nondescanned detectors: 500 to 550 nm (Alexa 488), 575 to 605 nm (phycoerythrin), and 625 to 675 nm (Alexa 647). A 1.0 NA water immersion objective (Leica) was used. Scale bar represents 30 μm. Methods of glomerular preparation have been described within text and in detail elsewhere.35  The infusion of fluorescent, or fluorescence-conjugated, probes for live cell imaging allows differentiation of structures in the kidney, as well as study of the function at the single nephron level. Table 1 identifies common MPM probes that will be discussed here. The spatial organization of the nucleus in the cell is paramount not only as a point of reference for cellular subcompartments, but also for detailed information on internal kidney structure when used in conjunction with endogenous autofluorescence. Hoechst 33342 is a membrane permeable dye that may be used to stain nuclei blue. Gene delivery with adenovirus-cDNA constructs containing GFP have been microinfused successfully into the tubule or vascular space of the rat kidney and visualized with MPM imaging.37 Although this approach has not had wide application, it offers a unique way to study the behavior of any fluorescently tagged protein in the kidney. Intrarenal blood flow, both glomerular and peritubular, has an intimate relationship with tubular function and glomerular filtration. The renal microvasculature can now be imaged at greater depth in real time with MPM. This technique relies on performing a line scan along the central axis of a vessel of interest in conjunction with a high molecular weight nonfilterable fluorescent dextran (70 kDa).32 Red blood cells do not take up fluorescent dye and, therefore, present apparent dark areas for which movement can be measured through time. This technique has been utilized to study the electronic vascular signal conduction with nephron synchronization.38 Furthermore, Kang and colleagues39 have confirmed a significantly higher flow rate occurs in intraglomerular capillaries compared with peritubular capillaries with similar diameters and the same systolic blood pressure. The measured red blood cell speed in the kidney was found to be higher than in most other vascular beds, which is consistent with the higher blood flow to the kidneys.28 Table 1Types of fluorescent probes, their characteristics, and functions.
3.1.Practical Considerations of In Vivo MPMThe commercialization of MPM has provided a greater degree of automation compared to earlier models that were based on a conventional confocal microscope equipped with a secondary laser. Current systems can be either inverted or upright. Upright systems need to employ a stabilization device, such as a kidney cup, to prevent respiratory movement distorting live images. Inverted systems limit the need for kidney stabilization devices, however, these devices may still be necessary. Two excellent step-by-step protocols provide a detailed description of effective preparation of the rat kidney and microscope stage for MPM imaging.32,60 The first decision is whether to image using objectives in the inverted or conventional mode. Subsequently, high-quality image acquisition and data reproducibility of kidney imaging require two important considerations: (1) the size of the inner muscle layer incision and (2) the implementation of a kidney stabilization device. Three layers must be incised to reach the peritoneal cavity to externalize the kidney in both the rat and mouse: skin, thin outer muscle layer, and thick inner muscle layer. The incision of the inner muscle layer should be smaller than the length of the kidney, so that externalization of the kidney through the incision stabilizes the kidney without stretching the renal pedicle and reducing renal perfusion. In some cases (for example, with the objective set to image from below the animal), a kidney stabilization device may not be needed because the body weight of the animal effectively stabilizes the kidney. However, where the body weight of the animal is small, as for a mouse, stabilization devices may still be needed. The devices can range in complexity from a simple cue-tip cotton bud placed near the renal pedicle to a custom-made kidney cup (for example, for imaging from above the kidney). Suturing the kidney capsule to a fixed point has also been used to stabilize the kidney. Effective temperature control devices are also essential for real-time imaging of anaesthetized animals. Figure 3 gives an example of a setup for intravital MPM, visualizing from below the kidney and employing a coverslip-bottom dish to stabilize the kidney. Fig. 3Schematic diagram showing a common setup for intravital imaging of a mouse or rat kidney. The animal is placed on its side with the exposed kidney lying in a shallow coverslip dish. Appropriate stabilization devices may need to be employed (depicted here are small pieces of autoclave tap stacked upon each other). The coverslip dish is filled with warm physiological saline, and a heated blanket is placed over the animal to maintain physiological temperature. Further temperature control devices may be employed, such as heating pads underneath the animal’s torso and hind limbs and around the microscope objective. Adapted from Ref. 60.  3.2.Quantifying Kidney FunctionMPM provides an alternate technique to quantify kidney function during physiological and diseased states. An important measure of kidney function is its ability to filter molecules, which may also provide information regarding the site of damage. Quantifying renal permeability of any macromolecule with intravital MPM requires conjugation of a fluorphore to a known molecule and identification of kidney microstructure compartments. Two excellent descriptions of methods are available: ratiometric determination of glomerular filtration rate (GFR) was applied during physiological and acute kidney injury conditions,61 and similar use has been made of the glomerular sieving coefficient (GSC).60 When quantiying changes in fluorescence from specific compartments, it is important to compensate for background fluorescence for each image by subtracting the average fluorescence intensity within the compartment of interest prior to injection of fluorescent biomarkers from the average intensity from the same region taken after infusion. The fundamental principle for assessing GFR using intravital MPM is to monitor the decay of a fluorescent reporter molecule from the vascular lumen or extracellular space over time following a bolus injection, and not neccesarily only from within the glomerulus and Bowman’s space. The procedure relies on the use of one compartment, and one reporter molecule, and is known as a one-compartent model. The process is greatly enhanced by incorporating a second, larger (kDa), species of fluorescently labeled conjugate infused into the aminal at the same time, thereby having the larger-size conjugate confined to the vascular space and the other freely filterable by the kidney. Measuring the fluorescence ratio of the larger to the smaller molecule, rather than purely relying on measuring the fluorescence only from the freely filterable smaller molecule, significantly enhances the accuracy of GFR measurment by reducing the fluctuation of the signal caused by movement of the focal point.62 Using this method, GFR may be rapidly quantified; however, a large number of data points are needed to assess the kinetics of conjugated molecules adequately. GFR values obtained via this method using fluorescein isothiocyanate (FITC)-inulin (reporter) and 500-kDa Texas Red-dextran (large molecule) were found to have a Pearson correlation coefficient of 0.85 when compared to GFR values obtained via standard inulin clearance from blood and urine.61 Determining the GSC is another useful quantitative measure based on the fundamental concept of fluorescence decay between compartments. This method requires 3-D data sets acquired from glomeruli, and localization of glomerular capillary loops, Bowman’s space, and the S1 segment of the proximal tubule. Serum albumin, conjugated to Texas Red, has been used extensively to quantify the GSC of albumin in rats, and preparation of the conjugated fluorphore has been described.60 During rat intravital MPM preparations, prior to infusion of reporter molecules, glomeruli appear as dark circular spaces surrounded by autofluorescent proximal tubules, and these should be demarcated in situ to allow ease of transition between glomeruli. Following infusion of the fluorescent reporter, an appropriate time is allowed for systemic distribution of the fluorophore before aquiring 3-D volumes of selected glomeruli at intervals. 3-D data image analysis software (for example, MetaMorph Microscopy Automation and Image Analysis Software; Volocity 3D Image Analysis Software; and Imaris Scientific 3D/4D Processing and Analysis Software) is available and often free, and facilitates export of 3-D volumetric data. To obtain the volumetric data, the capillary loop containing the fluorescent marker and the empty space (Bowman’s space) between its margins and Bowman’s capsule need to be identified, taking note of the average intensity reading within the capillary loop and the average intensity reading in Bowman’s space from the same focal plane. Adequate background readings prior to fluorescence marker infusion are necessary. The GSC can then be determined using the equation Similar principles can be applied to the reabsorption of the fluorescent marker within the S1 segment of the proximal tubule. Four-dimensional cell tracking over time, combined with MPM, has also produced novel data in the field of immunology and immune cell tracing,5,63,64 and has been used in the kidney to describe a new paradigm of leukocyte recruitment in the glomerulus.35 A detailed methodology for the data acquisition and analysis is available.65 The possibility of the visualization and quantitation of kidney myofibroblast proliferation during profibrotic processes in the kidney presents an interesting opportunity that remains untapped. 3.3.Significance of Endogenous FluorescenceAutofluorescence is commonly a hindrance of routine fluorescence microscopy, yet it is used to advantage in MPM. The reduced form of nicotinamide adenine dinucleotide (NADH) is a useful and plentiful endogenous fluorophore in the kidney due to the high density of mitochondria of which NADH is a metabolic substrate.27 Images captured without the infusion of fluorescent dyes can rely on this signal for basic information of tubular structure. As the fluorescence excitation, emission, and fluorescence lifetime of NADH and NADPH overlap, these two molecules are measured together and referred to as NAD(P)H.66 Hall and colleagues40 have demonstrated that the mitochondrial membrane-dependent fluorophore tetremethyl rhodamine methyl ester (TMRM) colocalizes with the endogenous fluorescence pattern of NAD(P)H. Changes in the intensity of NAD(P)H fluorescence can provide valuable information regarding cell metabolism, given that the oxidized form () is nonfluorescent (see Fig. 4, comparing the healthy kidney with ischemia-reperfused kidney; our data). NAD(P)H is a respiratory substrate for complex I of the mitochondrial electron transport chain. The total emitted fluorescence is, therefore, equal to the total NAD pool in a reduced state. A quantitative measure of this fluorescence provides information of the mitochondrial redox state, which is dependent on factors such as substrate supply and mitochondrial respiratory chain function. Detailed measurements can also be made using fluorescence lifetime imaging (FLIM) techniques, which are discussed in more detail below. Flavins, which only fluoresce in their oxidative state, can provide further information of the cellular redox state. The autofluorescent properties of NAD(P)H can also be a problem when using MPM, especially in proximal tubules, as it can interfere with quantitative analysis when using some fluorophores that have overlapping excitation/emission. Fig. 4Endogenous fluorescence of NAD(P)H excited at 740 nm (green) in the healthy (a) and ischemia-reperfused mouse kidney (b). Seven-week-old C57Bl6 mice were anesthetized, a lateral flank incision made, and 20 min ischemia-reperfusion performed. Images were captured using a Lavision Biotec Nikon multiphoton microscope to a depth of 71 μm from the kidney capsule. Imaris 7.6.0 software was used to adjust images to normalized fluorescence. 740-nm two-photon excitation clearly demonstrates the cortical tubular network with distal tubules, proximal tubules with associated brush border, and interstitial space (a). In (b), tubular pathology during the 20 min following renal ischemia demonstrates tubular cell effacement (white arrow), formation of cast material (*), and epithelial cell striations (black arrow). Excitation wavelength was 740 nm and emission was detected using three nondescanned filters: 447 to 460 nm (blue), 485 to 550 nm (green), and 593 to 600 nm (red). A 0.95 NA water immersion objective (Olympus) was used. Scale bar represents 50 μm.  Functional autofluorescent markers have also been used to detect accumulation of the so-called aging or wear and tear pigment, lipofuscin, in retinal pigment epithelial cells and the brain.67,68 To our knowledge, this has not been carried out in the kidney, despite the presence of lipofuscin in the atrophic kidney. In addition, aberrant indoleamines, such as serotonin (5-HT) and melatonin, under conditions of oxidative stress can form dimerized indolamine oxidation products producing intrinsic fluorescence that can be detected by three-photon excitation. This approach has been used to image 5-HT granules induced in mucosal mast cells by oxidative stress.19 3.4.Multiphoton Microscopy and FLIMThe fluorescence lifetime of a fluorophore is the mean time a fluorophore remains in an excited state before emitting a photon (fluorescence) and returning to the initial ground state. The fluorescence lifetime of a fluorophore, either endogenous or synthetic, depends on the type of molecule, its conformation, and the way the molecule interacts with the surrounding microenvironment.69 FLIM constructs a spatial distribution map of fluorescence lifetimes of a sample imaged by confocal, multiphoton, endoscopic, or wide-field microscopy.70 Importantly, FLIM microscopy can be used to measure molecular environmental parameters, the metabolic state of cells and tissues via endogenous autofluorescence, drug distribution and interactions, and protein-interactions by fluorescence resonance energy transfer (FRET). There are two major approaches used to measure the fluorescence lifetime of a sample: time-domain and frequency-domain. For time-domain FLIM, the fluorescence of a sample is acquired by time-correlated single-photon counting (TCSPC) to generate a lifetime decay curve. The lifetime curve is generated by repeatedly measuring the appearance of an emitted photon following an excitation pulse from the confocal or multiphoton laser source. This approach allows for the direct measurement of the decay curve, which is modeled to an exponential function according to the number of estimated components (i.e., independent physiochemical states of one or more fluorophores). The advantages of time-domain FLIM include the direct measurement of the decay curve, calculation of fluorescence lifetimes of the major components (typically a maximum of three to four), and relatively simple analysis compared to frequency-domain FLIM. Time-domain FLIM in multiphoton microscopy may require longer acquisition times compared to frequency-domain in order to generate an accurate decay curve. However, time-domain FLIM by TCSPC delivers excellent signal-to-noise ratio for weak signal samples.70,71 For frequency-domain FLIM, the intensity of the excitation light source is modulated sinusoidally at a radio frequency. The resulting emission fluorescence has the same frequency as the excitation light, but demonstrates changes in phase and amplitude (demodulation) relative to the incident light depending on the fluorescence lifetime.72 For multiphoton frequency-domain FLIM, an image intensifier is used to modulate the gain of the detector at the same frequency as the incidence light. Ideally, the fluorescence lifetime of a single molecule with one physiochemical state will be identical to both the phase and modulation lifetimes.71,72 The advantage of the frequency-domain FLIM is comparatively better signal-to-noise ratio than time-domain FLIM via TCSPC for complex systems with multiple fluorophores. 3.5.Multiphoton FLIM ApplicationsA useful application of FLIM in conjunction with MPM in the kidney is measuring the fluorescence lifetime of NAD(P)H. NAD(P)H lifetime measurements are widely used for metabolic and redox imaging in vitro and in vivo.2,7,73–76 The lifetime of NAD(P)H is resolved as a two-component system with the short ( to 4 ns) and long () lifetimes represented as the free and protein-bound conformations, respectively.72,77,78 As previously mentioned, the reduced form of NADH, NAD+, is not fluorescent and the ratio of NADH:NAD+ has been used previously as a measure of the redox state of the cell. Bird and colleagues demonstrated that the free-to-bound ratio of NAD(P)H, represented by the ratio of the amplitude coefficients for the short and long lifetimes (i.e., ), is related to the NADH/NAD+ ratio and can be used as an indicator for redox changes within the cell.73 While the free-to-bound ratio of NAD(P)H can be used to measure redox changes within the cells, this ratio should not be confused with the widely used redox ratio that is calculated by measuring the ratio of flavin adenine dinucleotide (FAD) to NADH intensity.79 FAD is also examined routinely by FLIM for intracellular metabolic and redox analysis. While FAD can be found in a free and protein-bound conformation, the former has a significantly higher quantum yield with a lifetime of 2.91 ns.72 In contrast to NAD(P)H, only the oxidized form of FAD is fluorescent and is used to measure changes in the redox state of the cell in combination with NADH.79 Figure 5 shows a depth- and spectrally resolved stack of multiphoton FLIM images and corresponding lifetime histograms measured from a healthy mouse kidney. TCSPC was used to generate the lifetime decay curve for each image (depth range: 120 μm) and fit to a two-component exponential function. Two spectral windows were used to simultaneously isolate the fluorescence lifetimes of NAD(P)H (350 to 450 nm) and FAD (515 to 620 nm). The data show a relatively consistent average lifetime of NAD(P)H as the imaging depth increases. Similarly, the FAD lifetime shows a tendency for a minimal decrease in average lifetime with depth. As expected, the total fluorescence intensity decreased with depth. This figure demonstrates that multiphoton FLIM yields consistent lifetime data, which can be used to assess changes in the metabolic and redox states of the tissue, with increasing depth imaging of the kidney. Fig. 5Fluorescence lifetime imaging (FLIM) of (a) NAD(P)H and (b) flavin adenine dinucleotide (FAD) in healthy mouse kidney. Seven-week-old C57BI6 mice were sacrificed and the kidney excised prior to multiphoton FLIM imaging on the JenLab DermaInspect microscope at an excitation wavelength of 740 nm. Endogenous fluorescence was separated into two emission channels, (a) 350 to 450 nm and (b) 515 to 620 nm, corresponding to NAD(P)H and FAD, respectively. Z-stack FLIM images were taken from a depth of below the kidney surface and are pseudo-colored according to average weighted lifetime (0 to 2000 ps; blue-green-red). Scale bare represents 40 μm.  Cellular autofluorescence lifetime has also been used to distinguish between normal, dysplastic, and cancerous tissues, including oral,74 breast,80 basal cell carcinoma,81 and head and neck squamous cell carcinoma.82 In addition, FLIM was used to characterize morphological features of basal cell carcinoma within in vivo human skin.83,84 The fluorescence lifetime properties of FAD and porphyrin were used to distinguish between normal kidney and renal cell carcinoma within the living rat kidney.85 The fluorescence lifetime of NAD(P)H and FAD is a viable indicator of IRI within the liver1,2 and kidney86 in vivo. The fluorescence lifetime changes associated with necrosis76 and apoptosis87,88 have also been described and can be used to measure tissue responses to drug treatments and disease states89 within the kidney. FRET describes the energy transfer from a donor to an acceptor fluorophore with overlapping emission and excitation spectra, respectively.90 However, the two substrates must be within a critical distance of each other so that the donor energy is quenched by the acceptor.91 Therefore, measuring the fluorescence lifetime of the donor substrate can provide quantitation of protein–protein proximity and interactions.92,93 This technique has been harnessed in conjunction with MPM and FLIM in studies of renin synthesis in the kidney: by utilizing fluorescence-based fluorogenic renin substrates, the direct visualization of the enzyme activity of renin in vivo, rather than only the granular content, has been seen.24,41 These fluorogenic renin substrates contain donor and acceptor fluorophores connected by a sequence of rodent angiotensinogen, which includes the renin cleavage site. In the absence of renin activity, the donor fluorescence is quenched by the acceptor molecule due to its close proximity and FRET. In the presence of renin and subsequent cleavage of angiotensinogen producing separation of the donor and acceptor, fluorescence is recovered and can be visualized. This technology potentially offers unique insight into disease models of altered renin-angiotensin-aldosterone system (RAAS) activation. More recently, Baird and coworkers have developed a quantitative FRET system using MPM to investigate the interaction of NF-E2 p45-related factor 2 (Nrf2) and its inhibitor Kelch-like erythroid-cell-derived protein with CNC homology [ECH]-associated protein 1 (Keap1).94 The Nrf2/Keap1 complex is a master regulator of cytoprotective genes95 and has been shown to play a role in both acute and chronic kidney pathologies.96–98 4.Utilization of Multiphoton Fluorescence Microscopy in the Kidney4.1.Multiphoton Microscopy and Renal PhysiologyThe ability of MPM to provide high-resolution real-time optical sections that can produce 3-D images has led to significant improvements in our understanding of kidney physiology. Interactions between hormones, tubular cells, and vessels can all be observed. In particular, our understanding of the functions of the juxtaglomerular apparatus (JGA), tubular transport, and glomerular filtration have all improved. Powerful studies have utilized single nephrons to demonstrate tubulovascular interactions, the intrarenal RAAS, renal vascular flow rate, and permeability. Subsequently, this has uncovered subcellular processes that can also be visualized and include apoptosis, necrosis, mitochondrial dynamics, reactive oxygen species (ROS) production, cytosolic ion concentrations, pH, signal propagation, and protein expression.32,42 Some of the first insights into kidney function using MPM were found after imaging of the JGA.26 The JGA is a critical structure that regulates renal blood flow and glomerular filtration for a single nephron, and the multiple cell types of the JGA make real-time MPM 3-D reconstruction of living kidney preparations an ideal tool for studying the structure. The cell types include mesangial cells, secretory granular epithelioid cells, vascular smooth muscle cells, vascular endothelium, and macula densa tubular epithelial cells. Macula densa cells in the thick ascending limb detect changes in fluid osmolality and/or NaCl concentration via specific transport mechanisms and send signals through mesangial cells to the glomerulus (tubuloglomerular feedback), resulting in vascular resistance and renin release by granular mesangial cells.99 Initial MPM approaches utilized in situ isolation of glomeruli with attached afferent and efferent arterioles, S1 segments of the proximal tubule, and the cortical thick ascending limb of the loops of Henle. By increasing the osmolality and NaCl concentration of tubular perfusate, this approach allowed direct visualization of the tubuloglomerular feedback mechanism. It was noted that macula densa cells swelled significantly, most likely due to increased NaCl transport, and that membrane blebbing of the apical membrane of the macula densa also occurred, resulting in afferent arteriole constriction.26 The inclusion of angiotensin II (AngII) in the perfusate also decreased the glomerular capillary diameter and increased the calcium concentration in cells of the JGA.26 Liu and Persson100 then demonstrated that macula densa cells could regulate their volume and that calcium elevation, due to decreased tubular NaCl and osmolarity, was not dependent on cell volume. Furthermore, physiological increases in luminal NaCl concentration and osmolality could result in macula densa cell shrinkage, a change that may have implications for cell signaling.101 Studies using MPM fully show the integrated nature of cell-to-cell communication in the kidney. MPM on live kidney tissue and confocal microscopy on fixed kidney tissue have combined to give a novel understanding of JGA physiology. MPM allowed the visualization of endothelial fenestrations of the JGA portion of the afferent arteriole for the first time.25 The release of renin into the JGA interstitium, a common and integral component for endocrine function, was therefore demonstrated. Using techniques similar to that of MPM, standard confocal microscopy has highlighted that tubuloglomerular feedback relies on a calcium-dependent vasoconstriction caused by extracellular ATP and gap junction communication in the JGA.56 Electronic vascular signal propagation in isolated JGA preparations has also been visualized with a fluorescent voltage-sensitive dye loaded into tubular-vascular preparations highlighting nephron synchronization.38 Recently, Peppiatt-Wildman and colleagues55 have taken a subcellular approach to calcium handling in the kidney to complement these studies. Using calcium-sensitive fluorophores and transgenic mice expressing the GCaMP2-calcium sensor, they were able to record calcium dynamics from endothelial, glomerular, and tubular origins. Another primary role of JGA cells is to release renin into the vasculature to activate the RAAS, which maintains body salt and water balance. Renin release is slow and, therefore, is the rate-limiting step of the RAAS pathway. As such, the temporal information that MPM provides adds value onto more conventional methods of analysis. Specific labeling of JGA granular cells containing renin with acidotrophic fluorophores that are highly membrane-permeant, therefore accumulating in acidic cellular organelles, allows temporal and spatial tracking of renin activity at a cellular level. The JGA is the classic anatomical site of renin synthesis and its biosynthetic precursor prorenin; however, significant amounts of renin have been found in the principal cells of the connecting tubule as well as the cortical and medullary collecting ducts.16,102,103 The study of renin dynamics using acidotrophic fluorophores, such as quinacrine and Lyso Tracker-Red, must be interpreted with caution given that these studies rely on surrogate molecules being observed rather than renin itself. 4.2.New Paradigms in Renal PhysiologyThe postglomerular uptake of selected glomerular filtrates contributes to the complex process of urine production. The simultaneous visualization of tubular uptake and glomerular filtration provided by MPM has allowed direct quantification of single nephron filtration. These measurements utilize dextrans of varying molecular weights conjugated to fluorophores. The approach has already challenged our understanding of the etiology of albuminuria. Russo and colleagues43 used a puromycin aminonucleoside nephrosis rodent model. They administered fluorescent serum albumin to rats and demonstrated that the glomeruli filter albumin at nephrotic levels in both controls and rats with nephrosis (albumin excretion rate ); however, a rapid retrieval of almost all albumin occurred at the epithelium of the S1 segment of the proximal tubule in control rats, but not nephrotic rats. This result is in direct contrast with previous studies that measured glomerular-tubular filtration using micropuncture techniques.104,105 The proximal tubule apical endocytotic machinery megalin, vacuolar H+-ATPase A subunit, and clathrin were shown to decrease in expression in nephrotic rats, and this provides a possible mechanism for albuminuria.43,106 Quantitative MPM studies were performed to validate the result, with some finding the GSC of albumin much lower than reported.44,53,107 However, the issue remains controversial,108–111 with debate on the ability of MPM to identify multiple factors that influence glomerular albumin permeability, including the depth of image acquisition, the selection of fluorophore, genetic strain of rat, and dietary status.53,112 The generalized polarity concept, whereby the intensity difference between two fluorescent molecules is normalized to the total intensity of the two dyes, has revealed further differences in proximal tubule uptake following glomerular filtration. Specifically, negatively charged 40-kDa dextran is more readily absorbed in the proximal tubule than neutral 40-kDa dextran.45 4.3.Multiphoton Microscopy and Renal PathophysiologySignificant advancements have been achieved using MPM in experimental models of kidney disease. Possibly, the most valuable aspect of the utilization of MPM in models of kidney pathophysiology is the temporal and spatial imaging of subcellular processes, such as apoptosis, necrosis, and mitochondrial dynamics. Renal IRI,14,27,40,113,114 kidney cyst development,57 diabetic nephropathy,16,39,44,115 renal inflammation,35,116,117 and gentamicin toxicity14 have been investigated using MPM. Renal IRI is the most common form of acute kidney injury and has been studied extensively. As an experimental model, this has a translational focus for transplant nephrology and is a useful model to study cellular responses to IRI. IRI is characterized by tubular swelling, cell death (apoptosis and necrosis), mitochondrial dysfunction, inflammatory responses, and deregulated vascular function.46 Microvascular and tubular components of the kidney have mutual, as well as unique, responses to IRI, which contribute to decreased kidney function. Given that IRI is potentially reversible, MPM can be used to image these cellular processes and then determine the success, or failure, of novel interventions. Recently, Hall and colleagues14 have used MPM to demonstrate the role of redox alterations occurring as a result of IRI. By using endogenous NADH fluorescence, mitochondrial selective probes (TMRM), ROS-sensitive dyes [dihydroethidium (DHE)], and glutathione indicators, they have shown that IRI mainly affects the distribution of mitochondria in the proximal tubular epithelium, with increased superoxide levels. Although increased ROS have been implicated in the pathophysiology of IRI before, MPM has allowed direct visualization of ROS in conjunction with cell damage. MPM image analysis of IRI during two models of kidney transplantation has revealed cast formation in the tubular profiles, mainly from increased tubular injury, necrosis, and apoptosis.51 This study also assessed the efficacy of p53 siRNA during rodent kidney transplantation and found that it significantly improved kidney function and decreased cast formation, perhaps by increasing blood flow through the vasculature. Inflammation within the kidney may be reparative or profibrotic; however, the underlying mechanisms remain poorly understood. Routine histological analysis, of necessity at a single point in time, often fails to uncover important cellular interactions given the high motility of circulating inflammatory cells in a time-dependent manner. Recently, MPM revealed a new leukocyte recruitment paradigm in the glomerulus of the inflamed kidney.35 This has implications for glomerular basement membrane disease and other forms of immune cell-mediated glomerulonephritis, common causes of end-stage kidney disease, associated with inflammatory cell recruitment to the glomerulus. Devi et al.35 used MPM of glomeruli in mice in combination with fluorescence-based approaches for labeling leukocytes to demonstrate that even in the absence of inflammation, neutrophils and monocytes undergo transient () periods of retention and migration in the glomerular capillaries before returning to the bloodstream. In addition, in three separate models of glomerular inflammation, neutrophils increased their dwell time in the glomerulus in response to inflammation. This model also spatially tracked neutrophils and monocytes, separating them into static and crawling groups. In addition, of intravascular neutrophils in the inflamed glomeruli generated ROS that were detected by DHE, which also displayed increased dwell time.35 The manipulability of mouse genetics combined with intravital microscopy is especially useful in the field of renal immunology. Soos and colleagues118 used conventional intravital confocal microscopy in the mouse in the normal kidney to examine interstitial macrophages and dendritic cells in the normal kidney. This demonstrated the contiguous network and probing dendritic behavior throughout the entire kidney. Using a robust model of kidney inflammation and fibrosis [unilateral ureteral obstruction (UUO)] and MPM, renal dentritic cells identified via endogenous expression of yellow fluorescent protein (YFP) in CD11c-YFP mice were seen to adapt to a proinflammatory phenotype to activate T-cells. However, following dentritic cell depletion, UUO mice continued to develop fibrosis, indicating that these cells do not directly contribute to fibrosis.116 Fluorescently labeled Escherichia Coli has been used in a model of upper urinary tract infection and visualized using MPM. This study revealed the initial stages of neutrophil infiltration with the Hoechst 33342 fluorophore and morphology as well as vascular, tubular, and lymphatic structural interactions.117 The use of GFP-labeled immune components in these murine models, as well as fluorophore-conjugated antibodies, have fully utilized immunological analyses using MPM. Diabetic nephropathy is the leading cause of chronic kidney disease worldwide and comprises a large proportion of nephrology research. The progressive nature of diabetes-induced kidney damage, coupled with the quantitative aspects of MPM image acquisition and analysis, allows structural and functional relationships to be explored. The previously mentioned controversy of the nonglomerular origin of albuminuria has been further supported in models of streptozotocin-induced diabetes in rats.44,115 The GSC of albumin was found to be unaltered in 12-week-old diabetic rats compared to controls. Infusion of a 69-kDa FITC-dextran (which has the same GSC as albumin) in control rats was not retained in the plasma following 24 h; however, albumin-Alexa568 (used to image albumin with MPM) was well retained in the plasma.44 This supported the theory that filtered albumin was reabsorbed by the proximal tubule epithelium and returned to the circulation. This system of reabsorption appears to be disturbed early in diabetes within the proximal tubular cells captured in vivo using MPM, showing a marked reduction in intracellular uptake of albumin-Alexa568. However, despite albuminuria being an outcome in diabetic nephropathy, the question still remains as to what causes a disruption of the proximal tubule endocytosis machinery. Studies have shown that proximal tubule albumin uptake relies on clathrin- and receptor-mediated mechanisms.119,120 Proximal tubule endocytosis is modulated by AngII through AngII (type 2) receptor mediated protein kinase B activation and may present a target for albuminuria.121 Diabetes also increases collecting duct prorenin levels, observed by quinacrine-labeled renin/prorenin granules and MPM, suggesting that prorenin content and release from collecting duct cells may be more important than the JGA when regulating levels of AngII in diabetes.16 This alternate pattern of AngII renin stimulation makes MPM an ideal tool, compared with fixed whole kidney or cortex preparations, and provides a theoretical pathway for inhibiting proximal tubular albumin endocytosis early in diabetes. Using the same rodent model of diabetes (streptozotocin-induced diabetic rat), Satoh and colleagues115 demonstrated early morphological changes in glomeruli at four and eight weeks, including glomerular hypertrophy and an increased diameter ratio of afferent and efferent arterioles, which correlated to hyperfiltration of a 40-kDa dextran fluorophore. However, the hyperfiltration of the glomeruli had already occurred before the diabetic rats developed albuminuria. A novel finding relating to established proteinuric kidney disease has shown significant alterations to endothelial surface layer of the glomerulus.122 This endothelial glycocalyx composed of glycosaminoglycans, proteoglycans, absorbed plasma components, and a loose matrix is significantly reduced in old spontaneously proteinuric kidney disease rats. This technique utilized MPM in conjunction with various fluorochrome-conjugated lectins to specifically label the glomerular glycocalyx in conjunction with physiological microvascular permeability measurements. Polycystic kidney disease is an autosomal dominant genetic disorder that often leads to destructive renal cyst development. Studies into the pathophysiology of autosomal dominant polycystic kidney disease (ADPKD) using MPM are limited, yet provide an untapped opportunity, given that the tubule-derived cysts often lack important transport functions. Sulfonefluorescein, which is a fluorescent organic anion that has been shown to be secreted from kidney proximal tubular cells,58 provides a useful tool to study tubule-derived cysts. Tanner and colleagues57 have demonstrated in heterozygous Han:SPRD rat with ADPKD that sulfonefluorescein accumulation in proximal tubules was diminished compared with control proximal tubules in control rats. However, the proximal tubule epithelial cells of cysts were variable in accumulating sulfonefluorescein, suggesting a broad deficiency in transport functions. 5.Conclusion: Future Advances in Multiphoton Microscopy in the KidneyThe use of MPM imaging has rapidly increased over the past decade and with this comes an unprecedented possibility for advancements in our knowledge in live cell physiology and pathophysiology. A major limitation to current MPM technologies in the kidney is the limitation of imaging depth in the cortex. Continuing efforts toward imaging at greater depths, possibly into the medulla, are needed. New infrared dyes with longer wavelengths that penetrate deeper due to less absorption and scattering appear to be the next step. Researchers are also continuing to find new applications for MPM technology. The use of a compact and flexible microendoscope utilizing multiphoton excitation has been used to visualize rodent colon, kidney, and liver in vivo.123 This opens the possibility of in vivo imaging in human organs. MPM has already been applied in a clinical setting to assess skin diseases124 and gastric cancer.125 Peti-Peterdi and colleagues42 have now demonstrated the unconventional use of multiphoton lasers as micromanipulators in the kidney. By focusing the multiphoton excitation laser beam at a small site, such as the capillary wall in the glomerulus, the local tissue damage can cause a disruption and may help to study the local effects of this damage. Recently, Corridon and colleagues126 developed a method to facilitate and monitor the expression of exogenous genes in the rat kidney using plasmid and viral vectors, which can be visualized with MPM. In conclusion, the ability to visualize and quantify cellular and intracellular processes in multiple dimensions in living animals offers endless rewards in experimental nephrology research. MPM provides an avenue to answer some unknown kidney processes both in terms of physiology and pathophysiology. ReferencesC. A. Thorlinget al.,
“Multiphoton microscopy can visualize zonal damage and decreased cellular metabolic activity in hepatic ischemia-reperfusion injury in rats,”
J. Biomed. Opt., 16
(11), 116011
(2011). http://dx.doi.org/10.1117/1.3647597 JBOPFO 1083-3668 Google Scholar
C. A. Thorlinget al.,
“Intravital multiphoton microscopy can model uptake and excretion of fluorescein in hepatic ischemia-reperfusion injury,”
J. Biomed. Opt., 18
(10), 101306
(2013). http://dx.doi.org/10.1117/1.JBO.18.10.101306 JBOPFO 1083-3668 Google Scholar
M. Hondaet al.,
“Intravital imaging of neutrophil recruitment in hepatic ischemia-reperfusion injury in mice,”
Transplantation, 95
(4), 551
–558
(2013). http://dx.doi.org/10.1097/TP.0b013e31827d62b5 TRPLAU 0041-1337 Google Scholar
M. YuryevL. Khiroug,
“Dynamic longitudinal investigation of individual nerve endings in the skin of anesthetized mice using in vivo two-photon microscopy,”
J. Biomed. Opt., 17
(4), 046007
(2012). http://dx.doi.org/10.1117/1.JBO.17.4.046007 JBOPFO 1083-3668 Google Scholar
J. L. Liet al.,
“Intravital multiphoton imaging of immune responses in the mouse ear skin,”
Nat. Protoc., 7
(2), 221
–234
(2012). http://dx.doi.org/10.1038/nprot.2011.438 NPARDW 1750-2799 Google Scholar
W. Y. Sanchezet al.,
“Changes in the redox state and endogenous fluorescence of in vivo human skin due to intrinsic and photo-aging, measured by multiphoton tomography with fluorescence lifetime imaging,”
J. Biomed. Opt., 18
(6), 061217
(2013). http://dx.doi.org/10.1117/1.JBO.18.6.061217 JBOPFO 1083-3668 Google Scholar
V. R. Leite-Silvaet al.,
“The effect of formulation on the penetration of coated and uncoated zinc oxide nanoparticles into the viable epidermis of human skin in vivo,”
Eur. J. Pharm. Biopharm., 84
(2), 297
–308
(2013). http://dx.doi.org/10.1016/j.ejpb.2013.01.020 EJPBEL 0939-6411 Google Scholar
W. Y. Sanchezet al.,
“Dichloroacetate inhibits aerobic glycolysis in multiple myeloma cells and increases sensitivity to bortezomib,”
Br. J. Cancer, 108
(8), 1624
–1633
(2013). http://dx.doi.org/10.1038/bjc.2013.120 BJCAAI 0007-0920 Google Scholar
W. Loet al.,
“Fast Fourier transform-based analysis of second-harmonic generation image in keratoconic cornea,”
Invest. Ophthalmol. Vis. Sci., 53
(7), 3501
–3507
(2012). http://dx.doi.org/10.1167/iovs.10-6697 IOVSDA 0146-0404 Google Scholar
U. Gehlsenet al.,
“Two-photon fluorescence lifetime imaging monitors metabolic changes during wound healing of corneal epithelial cells in vitro,”
Graefes. Arch. Clin. Exp. Ophthalmol., 250
(9), 1293
–1302
(2012). http://dx.doi.org/10.1007/s00417-012-2051-3 GACODL 0721-832X Google Scholar
Y. Chenet al.,
“Automated 5-D analysis of cell migration and interaction in the thymic cortex from time-lapse sequences of 3-D multi-channel multi-photon images,”
J. Immunol. Methods, 340
(1), 65
–80
(2009). http://dx.doi.org/10.1016/j.jim.2008.09.024 JIMMBG 0022-1759 Google Scholar
S. S. CaetanoT. TeixeiraC. E. Tadokoro,
“Intravital imaging of the mouse thymus using 2-photon microscopy,”
J. Vis. Exp., 59 e3504
(2012). http://dx.doi.org/10.3791/3504 Google Scholar
B. A. MolitorisR. SandovalT. A. Sutton,
“Endothelial injury and dysfunction in ischemic acute renal failure,”
Crit. Care Med., 30
(Suppl. 5), S235
–240
(2002). http://dx.doi.org/10.1097/00003246-200205001-00011 CCMDC7 0090-3493 Google Scholar
A. M. Hallet al.,
“In vivo multiphoton imaging of mitochondrial structure and function during acute kidney injury,”
Kidney Int., 83
(1), 72
–83
(2013). http://dx.doi.org/10.1038/ki.2012.328 KDYIA5 0085-2538 Google Scholar
J. Peti-PeterdiA. Sipos,
“A high-powered view of the filtration barrier,”
J. Am. Soc. Nephrol., 21
(11), 1835
–1841
(2010). http://dx.doi.org/10.1681/ASN.2010040378 JASNEU 1046-6673 Google Scholar
J. J. Kanget al.,
“The collecting duct is the major source of prorenin in diabetes,”
Hypertension, 51
(6), 1597
–1604
(2008). http://dx.doi.org/10.1161/HYPERTENSIONAHA.107.107268 HPRTDN 0194-911X Google Scholar
I. C. Ghiran, Introduction to Fluorescence Microscopy, 93
–136 Humana Press, New York, NY
(2011). Google Scholar
D. ColingB. Kachar,
“Principles and application of fluorescence microscopy,”
Current Protocols in Molecular Biology, John Wiley & Sons Inc., Hoboken, NJ
(2001). Google Scholar
W. R. Zipfelet al.,
“Live tissue intrinsic emission microscopy using multiphoton-excited native fluorescence and second harmonic generation,”
Proc. Natl. Acad. Sci. U S A, 100
(12), 7075
–7080
(2003). http://dx.doi.org/10.1073/pnas.0832308100 PNASA6 0027-8424 Google Scholar
K. W. DunnP. A. Young,
“Principles of multiphoton microscopy,”
Nephron Exp. Nephrol., 103
(2), e33
–40
(2006). http://dx.doi.org/10.1159/000090614 1660-2129 Google Scholar
W. KaiserC. G. B. Garrett,
“2-photon excitation in ,”
Phys. Rev. Lett., 7
(6), 229
–231
(1961). http://dx.doi.org/10.1103/PhysRevLett.7.229 PRLTAO 0031-9007 Google Scholar
W. DenkJ. H. StricklerW. W. Webb,
“Two-photon laser scanning fluorescence microscopy,”
Science, 248
(4951), 73
–76
(1990). http://dx.doi.org/10.1126/science.2321027 SCIEAS 0036-8075 Google Scholar
J. Peti-Peterdi,
“Multiphoton imaging of renal tissues in vitro,”
Am. J. Physiol. Renal Physiol., 288
(6), F1079
–1083
(2005). http://dx.doi.org/10.1152/ajprenal.00385.2004 0363-6127 Google Scholar
J. Peti-Peterdiet al.,
“Real-time imaging of renin release in vitro,”
Am. J. Physiol. Renal Physiol., 287
(2), F329
–335
(2004). http://dx.doi.org/10.1152/ajprenal.00420.2003 0363-6127 Google Scholar
L. Rosivallet al.,
“Fluid flow in the juxtaglomerular interstitium visualized in vivo,”
Am. J. Physiol. Renal Physiol., 291
(6), F1241
–1247
(2006). http://dx.doi.org/10.1152/ajprenal.00203.2006 0363-6127 Google Scholar
J. Peti-Peterdiet al.,
“Two-photon excitation fluorescence imaging of the living juxtaglomerular apparatus,”
Am. J. Physiol. Renal Physiol., 283
(1), F197
–201
(2002). 0363-6127 Google Scholar
A. M. Hallet al.,
“Multiphoton imaging reveals differences in mitochondrial function between nephron segments,”
J. Am. Soc. Nephrol., 20
(6), 1293
–1302
(2009). http://dx.doi.org/10.1681/ASN.2008070759 JASNEU 1046-6673 Google Scholar
D. Kleinfeldet al.,
“Fluctuations and stimulus-induced changes in blood flow observed in individual capillaries in layers 2 through 4 of rat neocortex,”
Proc. Natl. Acad. Sci. U S A, 95
(26), 15741
–15746
(1998). http://dx.doi.org/10.1073/pnas.95.26.15741 PNASA6 0027-8424 Google Scholar
F. Helmchenet al.,
“In vivo dendritic calcium dynamics in deep-layer cortical pyramidal neurons,”
Nat. Neurosci., 2
(11), 989
–996
(1999). http://dx.doi.org/10.1038/14788 NANEFN 1097-6256 Google Scholar
P. A. Younget al.,
“The effects of spherical aberration on multiphoton fluorescence excitation microscopy,”
J. Microsc., 242
(2), 157
–165
(2011). http://dx.doi.org/10.1111/jmi.2011.242.issue-2 JMICAR 0022-2720 Google Scholar
P. A. Younget al.,
“The effects of refractive index heterogeneity within kidney tissue on multiphoton fluorescence excitation microscopy,”
J. Microsc., 242
(2), 148
–156
(2011). http://dx.doi.org/10.1111/jmi.2011.242.issue-2 JMICAR 0022-2720 Google Scholar
K. W. DunnT. A. SuttonR. M. Sandoval,
“Live-animal imaging of renal function by multiphoton microscopy,”
Current Protocols in Cytometry, John Wiley & Sons Inc., Hoboken, NJ
(2012). Google Scholar
I. M. SchiesslS. BardehleH. Castrop,
“Superficial nephrons in BALB/c and C57BL/6 mice facilitate in vivo multiphoton microscopy of the kidney,”
PLoS One, 8
(1), e52499
(2013). http://dx.doi.org/10.1371/journal.pone.0052499 1932-6203 Google Scholar
C. C. Khouryet al.,
“Visualizing the mouse podocyte with multiphoton microscopy,”
Biochem. Biophys. Res. Commun., 427
(3), 525
–530
(2012). http://dx.doi.org/10.1016/j.bbrc.2012.09.089 BBRCA9 0006-291X Google Scholar
S. Deviet al.,
“Multiphoton imaging reveals a new leukocyte recruitment paradigm in the glomerulus,”
Nat. Med., 19
(1), 107
–112
(2013). http://dx.doi.org/10.1038/nm.3024 1078-8956 Google Scholar
M. Steinhausenet al.,
“Hydronephrosis: a new method to visualize vas afferens, efferens, and glomerular network,”
Kidney Int., 23
(6), 794
–806
(1983). http://dx.doi.org/10.1038/ki.1983.98 KDYIA5 0085-2538 Google Scholar
G. A. Tanneret al.,
“Micropuncture gene delivery and intravital two-photon visualization of protein expression in rat kidney,”
Am. J. Physiol. Renal Physiol., 289
(3), F638
–643
(2005). http://dx.doi.org/10.1152/ajprenal.00059.2005 0363-6127 Google Scholar
D. J. Marshet al.,
“Electrotonic vascular signal conduction and nephron synchronization,”
Am. J. Physiol. Renal Physiol., 296
(4), F751
–761
(2009). http://dx.doi.org/10.1152/ajprenal.90669.2008 0363-6127 Google Scholar
J. J. Kanget al.,
“Quantitative imaging of basic functions in renal (patho)physiology,”
Am. J. Physiol. Renal Physiol., 291
(2), F495
–502
(2006). http://dx.doi.org/10.1152/ajprenal.00521.2005 0363-6127 Google Scholar
A. M. Hallet al.,
“Multiphoton imaging of the functioning kidney,”
J. Am. Soc. Nephrol., 22
(7), 1297
–1304
(2011). http://dx.doi.org/10.1681/ASN.2010101054 JASNEU 1046-6673 Google Scholar
J. Peti-Peterdiet al.,
“Multiphoton imaging of renal regulatory mechanisms,”
Physiology (Bethesda), 24
(2), 88
–96
(2009). http://dx.doi.org/10.1152/physiol.00001.2009 PHYSCI 1548-9213 Google Scholar
J. Peti-PeterdiJ. L. BurfordM. J. Hackl,
“The first decade of using multiphoton microscopy for high-power kidney imaging,”
Am. J. Physiol. Renal Physiol., 302
(2), F227
–233
(2012). http://dx.doi.org/10.1152/ajprenal.00561.2011 0363-6127 Google Scholar
L. M. Russoet al.,
“The normal kidney filters nephrotic levels of albumin retrieved by proximal tubule cells: retrieval is disrupted in nephrotic states,”
Kidney Int., 71
(6), 504
–513
(2007). http://dx.doi.org/10.1038/sj.ki.5002041 KDYIA5 0085-2538 Google Scholar
L. M. Russoet al.,
“Impaired tubular uptake explains albuminuria in early diabetic nephropathy,”
J. Am. Soc. Nephrol., 20
(3), 489
–494
(2009). http://dx.doi.org/10.1681/ASN.2008050503 JASNEU 1046-6673 Google Scholar
W. YuR. M. SandovalB. A. Molitoris,
“Quantitative intravital microscopy using a generalized polarity concept for kidney studies,”
Am. J. Physiol. Cell Physiol., 289
(5), C1197
–1208
(2005). http://dx.doi.org/10.1152/ajpcell.00197.2005 0363-6143 Google Scholar
J. V. BonventreJ. M. Weinberg,
“Recent advances in the pathophysiology of ischemic acute renal failure,”
J. Am. Soc. Nephrol., 14
(8), 2199
–2210
(2003). http://dx.doi.org/10.1097/01.ASN.0000079785.13922.F6 JASNEU 1046-6673 Google Scholar
G. Camirandet al.,
“Multiphoton intravital microscopy of the transplanted mouse kidney,”
Am. J. Transplant., 11
(10), 2067
–2074
(2011). http://dx.doi.org/10.1111/ajt.2011.11.issue-10 AJTMBR 1600-6135 Google Scholar
I. TomaJ. J. KangJ. Peti-Peterdi,
“Imaging renin content and release in the living kidney,”
Nephron Physiol., 103
(2), p71
–74
(2006). http://dx.doi.org/10.1159/000090622 1660-2137 Google Scholar
J. J. Kanget al.,
“Imaging the renin-angiotensin system: an important target of anti-hypertensive therapy,”
Adv. Drug Deliv. Rev., 58
(7), 824
–833
(2006). http://dx.doi.org/10.1016/j.addr.2006.07.006 ADDREP 0169-409X Google Scholar
A. ProkaiJ. Peti-Peterdi,
“Recent advances in tissue (pro)renin imaging,”
Front. Biosci. (Elite Ed)., E2
(4), 1227
–1233
(2010). http://dx.doi.org/10.2741/E182 1093-9946 Google Scholar
R. Imamuraet al.,
“Intravital two-photon microscopy assessment of renal protection efficacy of siRNA for p53 in experimental rat kidney transplantation models,”
Cell Transplant., 19
(12), 1659
–1670
(2010). http://dx.doi.org/10.3727/096368910X516619 CTRAE8 0963-6897 Google Scholar
K. W. Dunnet al.,
“Functional studies of the kidney of living animals using multicolor two-photon microscopy,”
Am. J. Physiol. Cell Physiol., 283
(3), C905
–916
(2002). http://dx.doi.org/10.1152/ajpcell.00159.2002 0363-6143 Google Scholar
J. Peti-Peterdi,
“Independent two-photon measurements of albumin GSC give low values,”
Am. J. Physiol. Renal Physiol., 296
(6), F1255
–1257
(2009). http://dx.doi.org/10.1152/ajprenal.00144.2009 0363-6127 Google Scholar
A. Siposet al.,
“Advances in renal (patho)physiology using multiphoton microscopy,”
Kidney Int., 72
(10), 1188
–1191
(2007). http://dx.doi.org/10.1038/sj.ki.5002461 KDYIA5 0085-2538 Google Scholar
C. M. Peppiatt-WildmanC. CrawfordA. M. Hall,
“Fluorescence imaging of intracellular calcium signals in intact kidney tissue,”
Nephron Exp. Nephrol., 121
(1–2), e49
–58
(2012). http://dx.doi.org/10.1159/000342812 1660-2129 Google Scholar
J. Peti-Peterdi,
“Calcium wave of tubuloglomerular feedback,”
Am. J. Physiol. Renal Physiol., 291
(2), F473
–480
(2006). http://dx.doi.org/10.1152/ajprenal.00425.2005 0363-6127 Google Scholar
G. A. TannerR. M. SandovalK. W. Dunn,
“Two-photon in vivo microscopy of sulfonefluorescein secretion in normal and cystic rat kidneys,”
Am. J. Physiol. Renal Physiol., 286
(1), F152
–160
(2004). http://dx.doi.org/10.1152/ajprenal.00264.2003 0363-6127 Google Scholar
G. A. Tanneret al.,
“Organic anion secretion in polycystic kidney disease,”
J. Am. Soc. Nephrol., 8
(8), 1222
–1231
(1997). JASNEU 1046-6673 Google Scholar
S. L. Ashworthet al.,
“Two-photon microscopy: visualization of kidney dynamics,”
Kidney Int., 72
(4), 416
–421
(2007). http://dx.doi.org/10.1038/sj.ki.5002315 KDYIA5 0085-2538 Google Scholar
R. M. SandovalB. A. Molitoris,
“Quantifying glomerular permeability of fluorescent macromolecules using 2-photon microscopy in Munich Wistar rats,”
J. Vis. Exp., 74
(2013). http://dx.doi.org/10.3791/50052 Google Scholar
E. Wanget al.,
“Rapid diagnosis and quantification of acute kidney injury using fluorescent ratio-metric determination of glomerular filtration rate in the rat,”
Am. J. Physiol. Renal Physiol., 299
(5), F1048
–1055
(2010). http://dx.doi.org/10.1152/ajprenal.00691.2009 0363-6127 Google Scholar
W. YuR. M. SandovalB. A. Molitoris,
“Rapid determination of renal filtration function using an optical ratiometric imaging approach,”
Am. J. Physiol. Renal Physiol., 292
(6), F1873
–1880
(2007). http://dx.doi.org/10.1152/ajprenal.00218.2006 0363-6127 Google Scholar
M. J. Milleret al.,
“Two-photon imaging of lymphocyte motility and antigen response in intact lymph node,”
Science, 296
(5574), 1869
–1873
(2002). http://dx.doi.org/10.1126/science.1070051 SCIEAS 0036-8075 Google Scholar
M. J. Milleret al.,
“Autonomous T cell trafficking examined in vivo with intravital two-photon microscopy,”
Proc. Natl. Acad. Sci. U. S. A., 100
(5), 2604
–2609
(2003). http://dx.doi.org/10.1073/pnas.2628040100 PNASA6 0027-8424 Google Scholar
M. KitanoT. Okada,
“Four-dimensional tracking of lymphocyte migration and interactions in lymph nodes by two-photon microscopy,”
Methods in Enzymology, 437
–454 Academic Press, Amsterdam, Netherlands
(2012). Google Scholar
S. HuangA. A. HeikalW. W. Webb,
“Two-photon fluorescence spectroscopy and microscopy of NAD(P)H and flavoprotein,”
Biophys. J., 82
(5), 2811
–2825
(2002). http://dx.doi.org/10.1016/S0006-3495(02)75621-X BIOJAU 0006-3495 Google Scholar
S. O. LaJ. F. Bille,
“High-speed two-photon excited autofluorescence imaging of ex vivo human retinal pigment epithelial cells toward age-related macular degeneration diagnostic,”
J. Biomed. Opt., 13
(6), 064008
(2008). http://dx.doi.org/10.1117/1.2999607 JBOPFO 1083-3668 Google Scholar
G. EichhoffM. A. BuscheO. Garaschuk,
“In vivo calcium imaging of the aging and diseased brain,”
Eur. J. Nucl. Med. Mol. Imaging, 35
(Suppl. 1), S99
–106
(2008). http://dx.doi.org/10.1007/s00259-007-0709-6 EJNMA6 1619-7070 Google Scholar
W. Becker,
“Fluorescence lifetime imaging—techniques and applications,”
J. Microsc., 247
(2), 119
–136
(2012). http://dx.doi.org/10.1111/jmi.2012.247.issue-2 JMICAR 0022-2720 Google Scholar
D. Elsonet al.,
“Time-domain fluorescence lifetime imaging applied to biological tissue,”
Photochem. Photobiol. Sci., 3
(8), 795
–801
(2004). http://dx.doi.org/10.1039/b316456j PPSHCB 1474-905X Google Scholar
E. Grattonet al.,
“Fluorescence lifetime imaging for the two-photon microscope: time-domain and frequency-domain methods,”
J. Biomed. Opt., 8
(3), 381
–390
(2003). http://dx.doi.org/10.1117/1.1586704 JBOPFO 1083-3668 Google Scholar
M. Y. BerezinS. Achilefu,
“Fluorescence lifetime measurements and biological imaging,”
Chem. Rev., 110
(5), 2641
–2684
(2010). http://dx.doi.org/10.1021/cr900343z CHREAY 0009-2665 Google Scholar
D. K. Birdet al.,
“Metabolic mapping of MCF10A human breast cells via multiphoton fluorescence lifetime imaging of the coenzyme NADH,”
Cancer Res., 65
(19), 8766
–8773
(2005). http://dx.doi.org/10.1158/0008-5472.CAN-04-3922 CNREA8 0008-5472 Google Scholar
M. C. Skalaet al.,
“In vivo multiphoton fluorescence lifetime imaging of protein-bound and free nicotinamide adenine dinucleotide in normal and precancerous epithelia,”
J. Biomed. Opt., 12
(2), 024014
(2007). http://dx.doi.org/10.1117/1.2717503 JBOPFO 1083-3668 Google Scholar
M. C. Skalaet al.,
“In vivo multiphoton microscopy of NADH and FAD redox states, fluorescence lifetimes, and cellular morphology in precancerous epithelia,”
Proc. Natl. Acad. Sci. U. S. A., 104
(49), 19494
–19499
(2007). http://dx.doi.org/10.1073/pnas.0708425104 PNASA6 0027-8424 Google Scholar
W. Y. Sanchezet al.,
“Analysis of the metabolic deterioration of ex vivo skin from ischemic necrosis through the imaging of intracellular NAD(P)H by multiphoton tomography and fluorescence lifetime imaging microscopy,”
J. Biomed. Opt., 15
(4), 046008
(2010). http://dx.doi.org/10.1117/1.3466580 JBOPFO 1083-3668 Google Scholar
R. Niesneret al.,
“Noniterative biexponential fluorescence lifetime imaging in the investigation of cellular metabolism by means of NAD(P)H autofluorescence,”
Chemphyschem., 5
(8), 1141
–1149
(2004). http://dx.doi.org/10.1002/(ISSN)1439-7641 CPCHFT 1439-4235 Google Scholar
J. R. Lakowiczet al.,
“Fluorescence lifetime imaging of free and protein-bound NADH,”
Proc. Natl. Acad. Sci. U. S. A., 89
(4), 1271
–1275
(1992). http://dx.doi.org/10.1073/pnas.89.4.1271 PNASA6 0027-8424 Google Scholar
B. Chanceet al.,
“Oxidation-reduction ratio studies of mitochondria in freeze-trapped samples. NADH and flavoprotein fluorescence signals,”
J. Biol. Chem., 254
(11), 4764
–4771
(1979). JBCHA3 0021-9258 Google Scholar
M. W. Conklinet al.,
“Fluorescence lifetime imaging of endogenous fluorophores in histopathology sections reveals differences between normal and tumor epithelium in carcinoma in situ of the breast,”
Cell Biochem. Biophys., 53
(3), 145
–157
(2009). http://dx.doi.org/10.1007/s12013-009-9046-7 CBBIFV 1085-9195 Google Scholar
N. P. Galletlyet al.,
“Fluorescence lifetime imaging distinguishes basal cell carcinoma from surrounding uninvolved skin,”
Br. J. Dermatol., 159
(1), 152
–161
(2008). http://dx.doi.org/10.1111/j.1365-2133.2008.08577.x BJDEAZ 1365-2133 Google Scholar
Y. Sunet al.,
“Endoscopic fluorescence lifetime imaging for in vivo intraoperative diagnosis of oral carcinoma,”
Microsc. Microanal., 19
(4), 791
–798
(2013). http://dx.doi.org/10.1017/S1431927613001530 MIMIF7 1431-9276 Google Scholar
M. Manfrediniet al.,
“High-resolution imaging of basal cell carcinoma: a comparison between multiphoton microscopy with fluorescence lifetime imaging and reflectance confocal microscopy,”
Skin Res. Technol., 19
(1), e433
–443
(2013). http://dx.doi.org/10.1111/j.1600-0846.2012.00661.x 0909-752X Google Scholar
S. Seidenariet al.,
“Multiphoton laser tomography and fluorescence lifetime imaging of basal cell carcinoma: morphologic features for non-invasive diagnostics,”
Exp. Dermatol., 21
(11), 831
–836
(2012). http://dx.doi.org/10.1111/j.1600-0625.2012.01554.x EXDEEY 0906-6705 Google Scholar
D. B. Tataet al.,
“Fluorescence polarization spectroscopy and time-resolved fluorescence kinetics of native cancerous and normal rat kidney tissues,”
Biophys. J., 50
(3), 463
–469
(1986). http://dx.doi.org/10.1016/S0006-3495(86)83483-X BIOJAU 0006-3495 Google Scholar
A. Abulrobet al.,
“In vivo time domain optical imaging of renal ischemia-reperfusion injury: discrimination based on fluorescence lifetime,”
Mol. Imaging, 6
(5), 304
–314
(2007). MIOMBP 1536-0121 Google Scholar
J. S. Yuet al.,
“Increase of reduced nicotinamide adenine dinucleotide fluorescence lifetime precedes mitochondrial dysfunction in staurosporine-induced apoptosis of HeLa cells,”
J. Biomed. Opt., 16
(3), 036008
(2011). http://dx.doi.org/10.1117/1.3560513 JBOPFO 1083-3668 Google Scholar
H. W. Wanget al.,
“Differentiation of apoptosis from necrosis by dynamic changes of reduced nicotinamide adenine dinucleotide fluorescence lifetime in live cells,”
J. Biomed. Opt., 13
(5), 054011
(2008). http://dx.doi.org/10.1117/1.2975831 JBOPFO 1083-3668 Google Scholar
Q. YuA. A. Heikal,
“Two-photon autofluorescence dynamics imaging reveals sensitivity of intracellular NADH concentration and conformation to cell physiology at the single-cell level,”
J. Photochem. Photobiol. B, 95
(1), 46
–57
(2009). http://dx.doi.org/10.1016/j.jphotobiol.2008.12.010 JPPBEG 1011-1344 Google Scholar
R. R. Duncanet al.,
“Multi-dimensional time-correlated single photon counting (TCSPC) fluorescence lifetime imaging microscopy (FLIM) to detect FRET in cells,”
J. Microsc., 215
(1), 1
–12
(2004). http://dx.doi.org/10.1111/j.0022-2720.2004.01343.x JMICAR 0022-2720 Google Scholar
G. H. PattersonD. W. PistonB. G. Barisas,
“Forster distances between green fluorescent protein pairs,”
Anal. Biochem., 284
(2), 438
–440
(2000). http://dx.doi.org/10.1006/abio.2000.4708 ANBCA2 0003-2697 Google Scholar
G. W. Gordonet al.,
“Quantitative fluorescence resonance energy transfer measurements using fluorescence microscopy,”
Biophys. J., 74
(5), 2702
–2713
(1998). http://dx.doi.org/10.1016/S0006-3495(98)77976-7 BIOJAU 0006-3495 Google Scholar
A. PeriasamyR. N. Day,
“Visualizing protein interactions in living cells using digitized GFP imaging and FRET microscopy,”
Methods in Cell Biology, 293
–314 Elsevier, Amsterdam, Netherlands
(1999). Google Scholar
L. Bairdet al.,
“Regulatory flexibility in the Nrf2-mediated stress response is conferred by conformational cycling of the Keap1-Nrf2 protein complex,”
Proc. Natl. Acad. Sci. U. S. A., 110
(38), 15259
–15264
(2013). http://dx.doi.org/10.1073/pnas.1305687110 PNASA6 0027-8424 Google Scholar
T. NguyenP. NioiC. B. Pickett,
“The Nrf2-antioxidant response element signaling pathway and its activation by oxidative stress,”
J. Biol. Chem., 284
(20), 13291
–13295
(2009). http://dx.doi.org/10.1074/jbc.R900010200 JBCHA3 0021-9258 Google Scholar
A. Wilmeset al.,
“Identification and dissection of the Nrf2 mediated oxidative stress pathway in human renal proximal tubule toxicity,”
Toxicol. In Vitro, 25
(3), 613
–622
(2011). http://dx.doi.org/10.1016/j.tiv.2010.12.009 TIVIEQ 0887-2333 Google Scholar
B. M. Hybertsonet al.,
“Oxidative stress in health and disease: the therapeutic potential of Nrf2 activation,”
Mol. Aspects Med., 32
(4–6), 234
–246
(2011). http://dx.doi.org/10.1016/j.mam.2011.10.006 MAMED5 0098-2997 Google Scholar
P. E. Pergolaet al.,
“Bardoxolone methyl and kidney function in CKD with type 2 diabetes,”
N. Engl. J. Med., 365
(4), 327
–336
(2011). http://dx.doi.org/10.1056/NEJMoa1105351 NEJMAG 0028-4793 Google Scholar
P. D. BellJ. Y. Lapointe,
“Characteristics of membrane transport processes of macula densa cells,”
Clin. Exp. Pharmacol. Physiol., 24
(7), 541
–547
(1997). http://dx.doi.org/10.1111/cep.1997.24.issue-7 CEXPB9 0305-1870 Google Scholar
R. LiuA. E. Persson,
“Simultaneous changes of cell volume and cytosolic calcium concentration in macula densa cells caused by alterations of luminal NaCl concentration,”
J. Physiol., 563
(3), 895
–901
(2005). http://dx.doi.org/10.1113/jphysiol.2004.078154 JPHYA7 0022-3751 Google Scholar
P. KomlosiA. FinthaP. D. Bell,
“Unraveling the relationship between macula densa cell volume and luminal solute concentration/osmolality,”
Kidney Int., 70
(5), 865
–871
(2006). http://dx.doi.org/10.1038/sj.ki.5001633 KDYIA5 0085-2538 Google Scholar
M. C. Prieto-Carrasqueroet al.,
“Collecting duct renin is upregulated in both kidneys of 2-kidney, 1-clip goldblatt hypertensive rats,”
Hypertension, 51
(6), 1590
–1596
(2008). http://dx.doi.org/10.1161/HYPERTENSIONAHA.108.110916 HPRTDN 0194-911X Google Scholar
A. Rohrwasseret al.,
“Renin and kallikrein in connecting tubule of mouse,”
Kidney Int., 64
(6), 2155
–2162
(2003). http://dx.doi.org/10.1046/j.1523-1755.2003.00302.x KDYIA5 0085-2538 Google Scholar
A. TojoH. Endou,
“Intrarenal handling of proteins in rats using fractional micropuncture technique,”
Am. J. Physiol., 263
(4 Pt 2), F601
–F606
(1992). AJPHAP 0002-9513 Google Scholar
D. E. OkenW. Flamenbaum,
“Micropuncture studies of proximal tubule albumin concentrations in normal and nephrotic rats,”
J. Clin. Invest., 50
(7), 1498
–1505
(1971). http://dx.doi.org/10.1172/JCI106635 JCINAO 0021-9738 Google Scholar
A. Hurtado-Lorenzoet al.,
“V-ATPase interacts with ARNO and Arf6 in early endosomes and regulates the protein degradative pathway,”
Nat. Cell Biol., 8
(2), 124
–136
(2006). http://dx.doi.org/10.1038/ncb1348 NCBIFN 1465-7392 Google Scholar
G. A. Tanner,
“Glomerular sieving coefficient of serum albumin in the rat: a two-photon microscopy study,”
Am. J. Physiol. Renal Physiol., 296
(6), F1258
–1265
(2009). http://dx.doi.org/10.1152/ajprenal.90638.2008 0363-6127 Google Scholar
E. I. Christensenet al.,
“Controversies in nephrology: renal albumin handling, facts, and artifacts!,”
Kidney Int., 72
(10), 1192
–1194
(2007). http://dx.doi.org/10.1038/sj.ki.5002526 KDYIA5 0085-2538 Google Scholar
W. D. ComperB. HaraldssonW. M. Deen,
“Resolved: normal glomeruli filter nephrotic levels of albumin,”
J. Am. Soc. Nephrol., 19
(3), 427
–432
(2008). http://dx.doi.org/10.1681/ASN.2007090997 JASNEU 1046-6673 Google Scholar
M. Gekle,
“Renal albumin handling: a look at the dark side of the filter,”
Kidney Int., 71
(6), 479
–481
(2007). http://dx.doi.org/10.1038/sj.ki.5002123 KDYIA5 0085-2538 Google Scholar
A. Remuzziet al.,
“Albumin concentration in the Bowman’s capsule: multiphoton microscopy vs micropuncture technique,”
Kidney Int., 72
(11), 1410
–1411
(2007). http://dx.doi.org/10.1038/sj.ki.5002501 KDYIA5 0085-2538 Google Scholar
R. M. Sandovalet al.,
“Multiple factors influence glomerular albumin permeability in rats,”
J. Am. Soc. Nephrol., 23
(3), 447
–457
(2012). http://dx.doi.org/10.1681/ASN.2011070666 JASNEU 1046-6673 Google Scholar
A. A. Sharfuddinet al.,
“Soluble thrombomodulin protects ischemic kidneys,”
J. Am. Soc. Nephrol., 20
(3), 524
–534
(2009). http://dx.doi.org/10.1681/ASN.2008060593 JASNEU 1046-6673 Google Scholar
D. P. Basileet al.,
“Impaired endothelial proliferation and mesenchymal transition contribute to vascular rarefaction following acute kidney injury,”
Am. J. Physiol. Renal Physiol., 300
(3), F721
–733
(2011). http://dx.doi.org/10.1152/ajprenal.00546.2010 0363-6127 Google Scholar
M. Satohet al.,
“In vivo visualization of glomerular microcirculation and hyperfiltration in streptozotocin-induced diabetic rats,”
Microcirculation, 17
(2), 103
–112
(2010). http://dx.doi.org/10.1111/micc.2010.17.issue-2 MCCRD8 0275-4177 Google Scholar
S. L. Snelgroveet al.,
“Renal dendritic cells adopt a pro-inflammatory phenotype in obstructive uropathy to activate T cells but do not directly contribute to fibrosis,”
Am. J. Pathol., 180
(1), 91
–103
(2012). http://dx.doi.org/10.1016/j.ajpath.2011.09.039 AJPAA4 0002-9440 Google Scholar
F. X. Choonget al.,
“Multiphoton microscopy applied for real-time intravital imaging of bacterial infections in vivo,”
Methods in Enzymology, 35
–61 Academic Press, Amsterdam, Netherlands
(2012). Google Scholar
T. J. Sooset al.,
“CX3CR1+ interstitial dendritic cells form a contiguous network throughout the entire kidney,”
Kidney Int., 70
(3), 591
–596
(2006). KDYIA5 0085-2538 Google Scholar
K. KoralE. Erkan,
“PKB/Akt partners with Dab2 in albumin endocytosis,”
Am. J. Physiol. Renal Physiol., 302
(8), F1013
–1024
(2012). http://dx.doi.org/10.1152/ajprenal.00289.2011 0363-6127 Google Scholar
K. Weyeret al.,
“Mouse model of proximal tubule endocytic dysfunction,”
Nephrol. Dial. Transplant., 26
(11), 3446
–3451
(2011). http://dx.doi.org/10.1093/ndt/gfr525 NDTREA 0931-0509 Google Scholar
C. Caruso-NevesS. H. KwonW. B. Guggino,
“Albumin endocytosis in proximal tubule cells is modulated by angiotensin II through an AT2 receptor-mediated protein kinase B activation,”
Proc. Natl. Acad. Sci. U. S. A., 102
(48), 17513
–17518
(2005). http://dx.doi.org/10.1073/pnas.0507255102 PNASA6 0027-8424 Google Scholar
A. H. Salmonet al.,
“Loss of the endothelial glycocalyx links albuminuria and vascular dysfunction,”
J. Am. Soc. Nephrol., 23
(8), 1339
–1350
(2012). http://dx.doi.org/10.1681/ASN.2012010017 JASNEU 1046-6673 Google Scholar
C. M. Brownet al.,
“In vivo imaging of unstained tissues using a compact and flexible multiphoton microendoscope,”
J. Biomed. Opt., 17
(4), 040505
(2012). http://dx.doi.org/10.1117/1.JBO.17.4.040505 JBOPFO 1083-3668 Google Scholar
M. J. Koehleret al.,
“Clinical application of multiphoton tomography in combination with confocal laser scanning microscopy for in vivo evaluation of skin diseases,”
Exp. Dermatol., 20
(7), 589
–594
(2011). http://dx.doi.org/10.1111/exd.2011.20.issue-7 EXDEEY 0906-6705 Google Scholar
J. Yanet al.,
“A pilot study of using multiphoton microscopy to diagnose gastric cancer,”
Surg. Endosc., 25
(5), 1425
–1430
(2011). http://dx.doi.org/10.1007/s00464-010-1409-z SUREEX 1432-2218 Google Scholar
P. R. Corridonet al.,
“A method to facilitate and monitor expression of exogenous genes in the rat kidney using plasmid and viral vectors,”
Am. J. Physiol. Renal Physiol., 304
(9), F1217
–1229
(2013). http://dx.doi.org/10.1152/ajprenal.00070.2013 0363-6127 Google Scholar
BiographyDavid M. Small is a PhD scholar with the Centre for Kidney Disease Research, University of Queensland at the Translational Research Institute. His main research interests are in understanding the role of oxidative stress in acute and chronic kidney pathologies and how alterations in mitochondrial dynamics influence nephron function. These research interests involve the application of multiphoton imaging of the healthy and diseased kidney. Washington Y. Sanchez is a postdoctoral research scientist for the Therapeutics Research Centre, University of Queensland, which is led by Professor Michael Roberts. He investigated steroid transport/delivery in prostate cancer for his PhD and performed postdoctoral research in metabolic-targeting therapeutics for multiple myeloma. Currently, he specializes in measuring drug penetration and distribution into human skin, liver, and other tissues, along with cellular metabolic changes associated with drug therapy. Sandrine Roy manages the Core Microscopy Facility of the Translational Research Institute (TRI), Brisbane, Australia, and supports the LaVision Biotek Multiphoton system. Her background is in cell biology, with postdoctoral experience at Washington University as well as the University of Queensland in Australia. During that time, she gained experience on many imaging platforms, with extensive animal work experience. She is now developing novel imaging techniques as well as expanding the facility at TRI. Michael J. Hickey is a National Health & Medical Research Council senior research fellow at Monash University. He received his PhD from the University of Melbourne and undertook postdoctoral training at the University of Calgary in Canada. His expertise lies in the analysis of the actions of leukocytes during inflammation. His laboratory uses various forms of advanced in vivo imaging to image organs undergoing inflammatory responses. Glenda C. Gobe heads the Translational Research Laboratories of the Centre for Kidney Disease Research University of Queensland at the new Translational Research Institute located near Princess Alexandra Hospital, Brisbane, Australia. She is known for her research into molecular pathways controlling apoptosis, particularly in the kidney, and her experimental and translational research into molecular strategies aimed at improving patient outcome in acute and chronic kidney disease. Australian and overseas postgraduate students take part in her research programs. |


