|
|
1.IntroductionOptical coherence tomography (OCT)1,2 is a relatively new imaging modality, which was introduced to overcome the limitation of previous imaging techniques as it provides high resolution cross-sectional images of coronary arteries. In contrast to intravascular ultrasound, OCT is based on the analysis of reflected light, instead of acoustic waves, allowing visualization of plaque features with a higher analysis (axial resolution: 12 to 18 μm, lateral resolution: 20 to 90 depending on the depth of focus).3 The unique imaging resolution of OCT has drawn the attention of the scientific community from its early stages. However, its clinical applications were initially limited due to the fact that imaging required blood removal. This drawback was addressed with a proximal balloon occlusion4 which, however, caused ischemia and possibly vessel wall trauma. A later approach used saline injection for blood removal but the slow image acquisition speed restricted OCT imaging in short segments. The recent introduction of the second-generation OCT systems, the so-called frequency domain OCT (FD-OCT),1 permits fast image acquisition (up to ) and fast pull-back speeds allowing thus visualization of long segments within few seconds.5 These systems increased considerably the applicability of OCT and today this modality constitutes an indispensable tool in the clinical and research arena. OCT allows evaluation of the luminal dimensions, assessment of vessel wall morphology and identification of features associated with increased vulnerability, such as the thickness of fibrous cap, microcalcifications, neo-vessels, and the presence of macrophages, which cannot be evaluated by other intravascular imaging modalities.6,7 OCT has limited penetration,6 and quite often does not allow imaging of the entire vessel wall, especially in segments with large lumen and increased plaque burden. However, its high resolution permits detailed evaluation of the superficial plaque and nowadays this modality is considered as the gold standard for the in vivo characterization of plaque. According to the recently published expert consensus,6–8 four different tissue types can be detected in OCT: calcium (CA), that appears as a signal poor region with sharply delineated borders, fibrous tissue (FT), that is portrayed as a high back-scattering homogeneous area, lipid tissue (LT), that is a shown as a signal poor region with diffuse-delineated borders with a fast drop-off and little or no back-scattering signal, and mixed tissue (MT), that features characteristics from multiple tissue types. Traditionally, OCT lumen detection and plaque characterization9,10 was performed manually. However, this process is time consuming and can be unreliable in the hands of nonexperienced operators. To overcome these drawbacks and enhance the clinical and research applications of OCT, several methodologies have been developed for the automated processing of OCT images.11,12 The most recent ones were proposed by Ughi et al.13 and Tsantis et al.14 who presented an automated methodology that permitted detection of the lumen borders and the stent struts, allowing evaluation of their apposition and coverage. Xu et al.15 were the first who attempted to develop an automated plaque characterization methodology. They used histological images as gold standard and studied the backscattering and attenuation coefficient in three tissue types (CA, LT, and FT), aiming to determine a cutoff value for each tissue. Similarly, the methodology proposed by van Soest et al.16 examined the attenuation coefficients of healthy segments, intimal thickening plaques, LT and fibrous caps infiltrated by macrophages. However, both approaches failed to define fixed cutoff values of the backscattering and attenuation coefficients that would allow reliable plaque characterization. In addition, both approaches analyzed the backscattering and attenuation coefficients across the entire A-lines without being able to identify the plaque region. Wang et al.17 proposed a semiautomated methodology for detecting CA. They segmented the lumen, applied edge detection to detect roughly the CA borders, and then, by applying active contours, they detected the CA borders. However, the methodology had one major limitation: the occurrence of many false-positive CA which have to be removed by the user manually to apply clinical measures. Although the authors have proven that image processing techniques can be applied to detect CA they did not present a plaque characterization methodology. In this study, for the first time, we introduce an automated methodology for the segmentation of the lumen border and the characterization of the composition of the superficial plaque in OCT images. The methodology proposed for the identification of the different tissue types relies on the combination of medical knowledge, image processing, and machine learning techniques and is able to process high-quality OCT images in a fully automated manner without user interaction. The innovative aspects of the proposed methodology are:
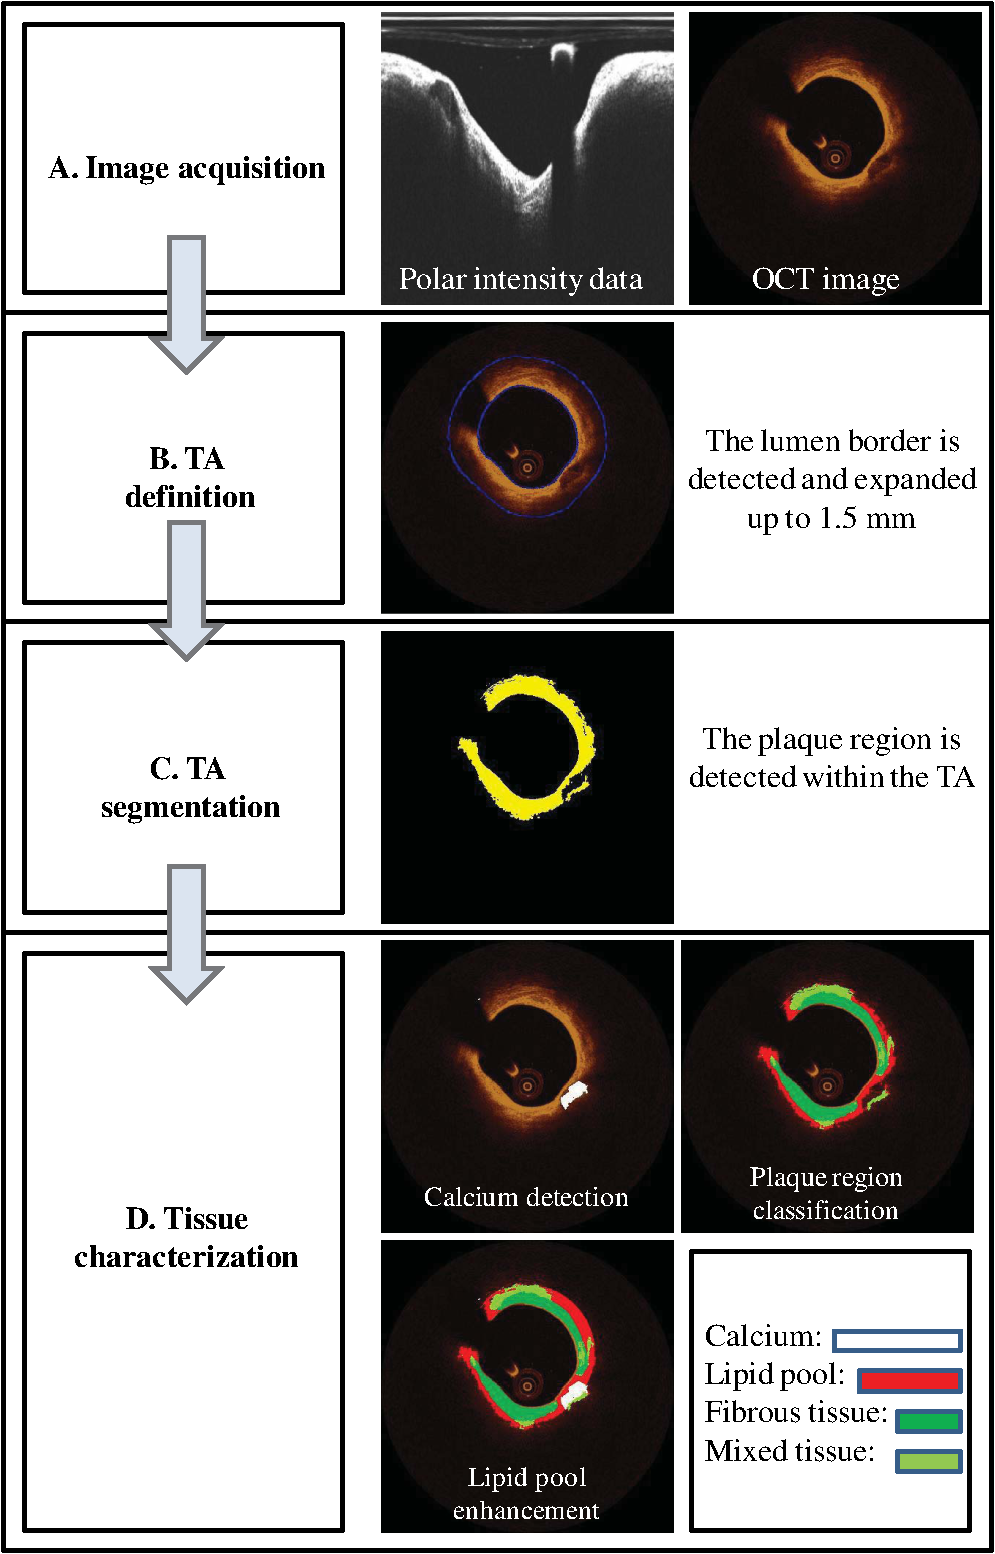
The proposed approach was validated against the estimations of expert observers in real patient data. Our results indicate that our methodology can accurately detect luminal borders and characterize the composition of superficial plaque. 2.DatasetTwenty-seven OCT pullbacks from 22 patients, who underwent OCT investigation for clinical purposes after giving consent, were used to train and validate the proposed methodology. The images were acquired by a C7XR Fourier Domain system (Lightlab Imaging, Westford, Massachusetts) with the use of an automated pull-back device under continuous injection of contrast medium. 3.Materials and MethodsFour steps are followed in order to characterize the composition of the plaque: image acquisition, detection of the TA, TA segmentation, and plaque characterization. Each one of these stages is described in detail in the following sections and is shown schematically in Fig. 1. 3.1.Image AcquisitionOCT systems acquire individual A-lines containing the information of the reflected optical energy as a function of time.18 These A-lines are stored sequentially in a two-dimensional (2-D) matrix () with each line corresponding to polar intensity data , with representing the range dimension and the acquisition angle. Each frame corresponds to an dataset (grayscale image). For the true morphology of the tissue to be revealed, the polar 2-D data [ grayscale image] must be converted to Cartesian coordinates []. This transformation is performed using: , . 3.2.Detection of the TAA region in each OCT frame is determined for the plaque characterization methodology to be applied. This region is called TA and is located between the lumen border and the expanded (up to 1.5 mm) lumen border (outer border of the TA). The TA detection stage includes two steps: the detection of the lumen border and the extraction of the outer border of the TA. 3.2.1.Lumen detectionLumen border () detection is performed in the polar OCT images [] [Fig. 2(a)–2(c)] and includes the following steps:
Fig. 2Detection of the lumen border and extraction of the tissue area (TA): (a) Initial image in polar coordinates, (b) catheter and catheter artifact removal, (c) the lumen border in polar coordinates, and (d) lumen border marked with blue on the reconstructed OCT image. To extract the outer border of the TA, radii are drawn toward the lumen border and extended by 1.5 mm, the curve defined by the distal end of the radius corresponds to the outer border of the TA (yellow curve).  3.2.2.Detection of the Outer Border of the TAThe gravitational center of the lumen border is determined in each OCT frame and then 360 radii (with 1-deg interval) are drawn toward the lumen border and expanded 1.5 mm distally to the detected border. Our decision to focus on the superficial plaque was based on the small tissue penetration of the intravascular OCT systems (1 to 2 mm) and on the fact that there is a decreased signal-to-noise ratio in the pixels, which depict tissues that are deeply embedded in the plaque.6 The curve that connects the distal edge of the drawn radius defines the outer border of the TA () [Fig. 2(d)]. 3.3.TA SegmentationTA pixels belong either to plaque or to extravascular tissue. To discriminate the pixels that belong to the plaque from those that image extravascular tissue, a -means algorithm is implemented. This approach appeared to outperform other methods that were tested (automatic thresholding, border detection) in detecting the plaque area and was capable to identify the CA TA. A -means algorithm partitions a given set of observations , into a fixed number of clusters in order to minimize the within cluster sum of squares:20 where is the mean of points in .The pixels corresponding to TA are classified to clusters [Fig. 3(b)] ( and 4 clusters were also tested) resulting to a segmented image (Appendix A). The pixels that were classified in the first two clusters ( and ) have an intermediate signal intensity and are likely to portray either the superficial LT, FT, and MT while the pixels classified in the third cluster have a low signal intensity and are likely to portray either the area behind the catheter artifact (), or CA, or a signal poor region corresponding to deeply located LT or extravascular tissue. Fig. 3(a) Initial image, (b) segmented image using the -means clustering method, blue and yellow pixels belong to lipid tissue (LT), fibrous tissue (FT), and mixed tissue (MT). The light blue pixels belong to: the area behind the catheter artifact, CA, extravascular tissue, or the deeper layers of LT, and (c) the calcium detected in the initial image is marked with white color.  3.4.Plaque CharacterizationOnce the TA is segmented, the different plaque types can be detected. 3.4.1.Calcium detectionCA appears as a signal-poor region with sharply delineated borders. After applying the -means segmentation algorithm, the sharply delineated borders belong either to or cluster while the signal poor region located between these clusters to cluster [Figs. 3(a) and 3(b)]. Therefore to find the CA, each radius of the [Fig. 3(b)] is scanned from the lumen border to the outer border of the TA. The radial segment which is clustered to and is enclosed by pixels that belong to the cluster or is labeled as calcium [Fig. 3(c)]. The above procedure is shown schematically in Fig. 3. 3.4.2.Feature extractionFor each pixel of the area that corresponds to clusters and [Fig. 3(b)], a set of texture and intensity-based features is calculated in a neighborhood (Appendix B). Local binary patterns (LBPs) and gray level co-occurrence matrices (GLCMs) are the texture features which are employed. The GLCM21 is a matrix with dimensions , defined over an image that calculates how often a pixel with gray-level value (grayscale intensity) occurs spatially adjacent to a pixel with value . The spatial relationship of the pixels is defined by an offset as where is the spatial direction and is the Euclidean distance between the pixels. For the proposed methodology, we compute the co-occurrence matrices using all the possible values of and (, 3 were also tested). Thus, eight are computed for each pixel in a neighborhood. For each co-occurrence matrix , the following measures are calculated:Contrast: Correlation: where and .Energy: Homogeneity: Therefore, 32 features are computed (), four features for each angle . LBPs22 determine uniform texture patterns of members into circular neighborhoods with radius . Among the various LBP tested, we used the rotation invariant :23 where is the intensity of the center pixel and are the intensities of the circularly symmetric neighborhood, superscript ri refers to “rotation invariant” while means that the pattern has values ( is the number of spatial transitions in the pattern) of at most 2, whereas the function , is defined asoutput is a fixed set of discrete values: . and are used in the proposed methodology (, , , and , were also tested but the results were suboptimal) hence 10 LBP features , are computed. The above 42 features (32 GLCMs and 10 LBPs) along with the entropy () and mean value ()24 of the neighborhood result to a set of 44 features for each pixel belonging into the two clusters: and . 3.4.3.Feature selectionMany factors affect the accuracy and success of classification algorithms on a given task. One of these factors is the redundant information given in the classifier. Therefore, feature selection is crucial for improving the accuracy of the proposed plaque characterization methodology. We have employed the wrapper feature selection (WRP)25 to find the best features for the proposed methodology. The WRP method produces feature subsets from all possible feature combinations. Afterward, all the possible feature combinations are used as input to a target classification algorithm, and the overall accuracy of each combination is estimated. The feature subset that achieves the highest classification accuracy is chosen as the best feature combination for the specific classification algorithm (Appendix C). 3.4.4.ClassificationOnce the features are extracted, the pixels belonging to the clusters , are classified to one of the remaining three plaque types: LT, FT, and MT. For this purpose, different classification algorithms were tested [support vector machines, neural networks, and random forests (RF)]. The RF provided the best classification results and thus this classification algorithm was used by our methodology. The RF26 is an ensemble classifier that consists of many decision trees; RF selects randomly the number of features in order to construct a collection of decision trees with controlled variation. Several numbers of features and trees were tested to find the best combination for the RF classifier (Appendix C). 3.4.5.PostprocessingIn the available IV-OCT imaging configurations, the optical properties of LT limit the ability of OCT to image the full extent of lipid-rich plaques. Since the -means algorithm segments only the pixels portraying FT, MT, and superficial LT, the pixels that portray deeper layers of LT cannot be classified (Fig. 4). When experts manually annotated LT tissue, they approximate the outer border of LT. In brief, they identify the external elastic lamina and draw an arc that connects its lateral extremities [Fig. 4(b)]. Following the same rationale with experts, we automatically estimate the outer border of LT implementing the following approach:
Fig. 4The postprocessing step of the proposed methodology: (a) initial image, (b) expert limitation on detecting the outer border of the LT plaque, (c) the initial image with the segmented region marked with white color, (d) the expanded lumen border transformed to polar coordinates, the distal border of the TA (yellow line) is reduced to 0.75 mm and a new line is drawn (yellow dashed line) in order to detect the outer border of the LT, (e) the image characterized before applying the postprocessing step, and (f) the image characterized after applying the postprocessing step, (CA: white, LT: red, FT: dark green, and MT: light green).  The above described approach is shown in Fig. 4, while the sensitivity analysis for applying the postprocessing threshold () is described in Appendix D. 4.Validation MethodologyFrom our data set (27 OCT pullbacks), 556 OCT images were randomly selected and one expert annotated the lumen borders. Images portraying stented segments as well as frames with a minimal thrombus burden or a small amount of residual blood that did not affect image quality were included in the validation set. On the other hand, frames portraying malapposed struts or having an increased thrombus burden or residual blood in the lumen were excluded from the analysis. We also excluded frames having motion artifacts.7 To validate the performance of the proposed segmentation methodology, we compared the expert’s estimations with those derived by our approach. Furthermore, two experts selected 200 images with no artifacts that portrayed diseased coronary segments, identified the presence of tissues with a typical morphology, and detected the CA, LT, FT, and MT.6–8 In this analysis, MT was defined as the tissue that has features noted in CA and LT. Any disagreements in experts’ annotations were resolved by consensus. Sixty images were randomly selected and used to train the classification algorithm and the rest to validate the performance of the proposed methodology. From the training set of 60 images, a fully balanced dataset of 12,000 pixels was created by randomly selecting 4000 pixels from each one of the annotated plaques LT, FT, and MT. In the 140 images that were used for testing the methodology, 150 tissue regions with a typical morphology were annotated (34 CA, 36 LT, 47 FT, and 33 MT) by the two experts, and their mean estimation was used as gold standard to validate the proposed methodology. 4.1.Validation MetricsThe mean estimation was extracted using the following methodology: we compute the mean perpendicular distances from the first to the second border estimation. For an image , let and be the border estimation of the first and the second observer, respectively, and the perpendicular distance from a pixel to a pixel , where . The mean estimation of the two borders is defined as where PL is the perimeter of . In addition, we computed the interobserver variability for the two expert observers in the 150 tissue regions (CA: , LT: , FT: , and MT: ).To validate the proposed methodology, we computed Pearson’s correlation coefficients performed Bland-Altman analysis for the areas estimated by our methodology and the experts’ annotations and computed the positive predictive value (PPV). As true positive values (TP), we denote the common area detected by the methodology and annotated by the experts. As false positive (FP) values, we denote the area detected by the methodology and not by the experts and as false negative (FN) the area annotated by the experts and not detected by the methodology. Additionally, the ratio of overlapping areas between the methodology and experts’ annotations was computed. The ratio of overlapping areas was defined as The ratio of overlapping areas is actual the sensitivity of the methodology in detecting the different tissue types. However, by computing the overlapping area (sensitivity) metric, we are not able to understand if our methodology overestimates the detected areas (). Thus, we computed an additional validation metric the ratio of nonoverlapping areas defined as 5.ResultsAn excellent agreement was noted for the lumen, CA, FT, LT, and MT areas estimated by our approach and the experts (Table 1). The correlation coefficient analysis and the Bland-Altman plots for the lumen areas are shown in Fig. 5. Figure 6 shows the correlation plots between the areas estimated by our approach and the areas estimated by the two experts for the four tissue types (CA, LT, FT, and MT), while Fig. 7 shows the results of the Bland-Altman analysis. Table 1Results of the proposed methodology using different validation metrics.
Fig. 5(a) Correlation plot and (b) Bland-Altman plots for the lumen areas estimated by our methodology and the expert.  Fig. 6Correlation plots for the (a) CA, (b) LT, (c) FT, and (d) MT areas estimated by our methodology and the two experts.  Fig. 7Bland–Altman plots for the (a) CA, (b) LT, (c) FT, and (d) MT areas estimated by our methodology and the two experts.  The qualitative validation metrics showed an excellent agreement between our methodology and the estimations of the expert for the lumen areas (overlapping area ratio: 0.99, nonoverlapping area ratio: 0.02). The overlapping area analysis for the tissue types demonstrated that our approach classifies correctly most of the pixels detected by the two experts that portray tissues with a typical morphology (overpaying area ratio: 0.81 for the CA, 0.71 for the LT, 0.87 for the FT, and 0.81 for the MT). The disagreement between our approach and the mean estimations of the experts was low for the CA and FT tissue (nonoverlapping area metric: 0.35 and 0.37, respectively). On the other hand, for the LT and the MT the nonoverlapping area ratio was 0.51 and 0.47, respectively, indicating that the position of the detected tissue within the vessel wall is not exactly the same. These discrepancies noted in the LT and MT are due to the limited ability of our methodology to accurately detect their lateral extremities and to fact that the distal border of both tissues is not visible in OCT. Examples of the proposed methodology in detecting the lumen borders are shown in Fig. 8, while Fig. 9 presents application examples of the proposed methodology in detecting the four tissue types. Fig. 8Results of the proposed lumen detection step in (a) a native segment, (b) in a stented segment, (c) in a segment having thrombus, and (d) in a segment having residual blood. The lumen border is marked with blue.  Fig. 9Application examples of the proposed methodology: (a) Initial images, (b) annotations over the initial images (white-CA, red-LT, green-FT, and light green MT) over the initial image, (c) color-coded images produced by our methodology using the initial images (white-CA, red-LT, green-FT, and light green MT). 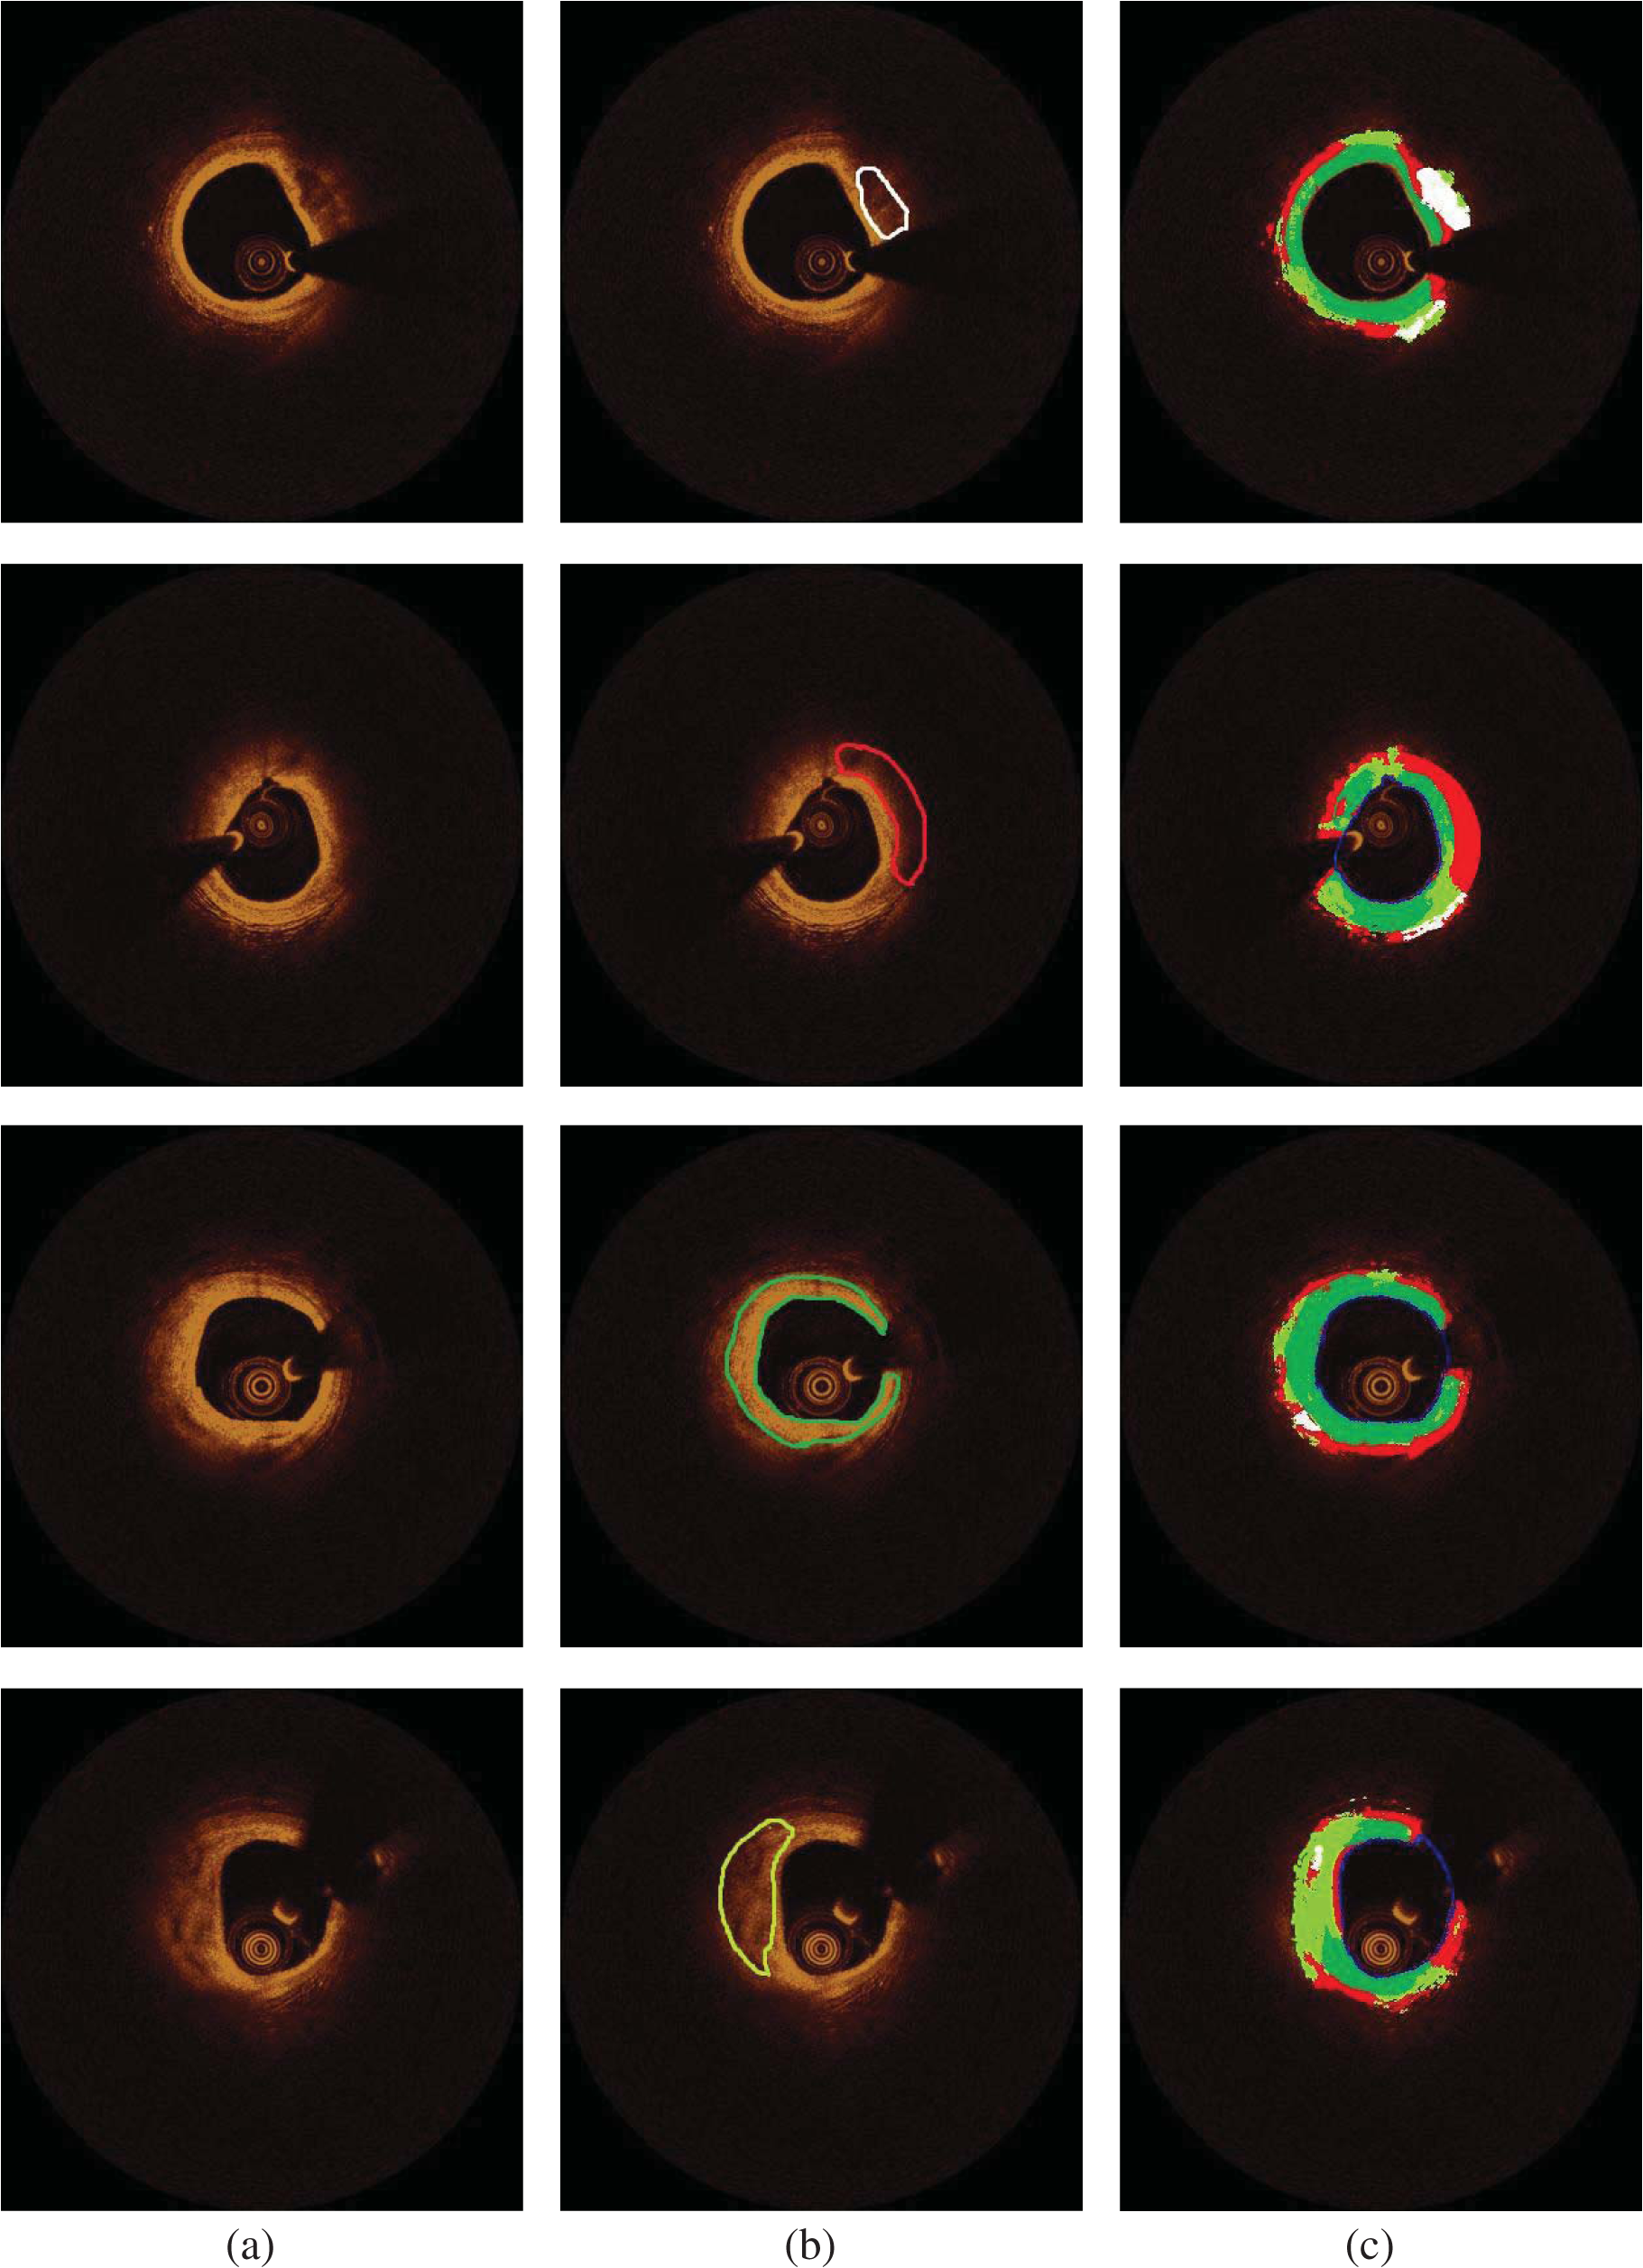 5.1.ApplicationTo assess and visualize the lumen borders and plaque composition in FD-OCT examinations, an in-house tool was developed using MATLAB r2011b. To speed up the algorithm, C++ code was implemented and executed using MATLAB’S MEX libraries. The user can import FD-OCT examinations (raw data files extracted from the FD-OCT equipment), view the OCT images, view the longitudinal view of the pullback, characterize the different plaque types, and detect the lumen borders of the pullback. The time complexity of the proposed methodology for detecting the lumen border and characterizing the plaque is per frame using a core i7 desktop computer with 8 GB of RAM. 6.DiscussionIn this work, a fully automated luminal border detection and plaque characterization methodology is presented that allows expedited analysis of the FD-OCT data. In the proposed methodology, the luminal borders are extracted and used to define the TA. On the extracted TA, segmentation techniques are applied, initially differentiating the extravascular tissue from the plaque, and then four tissues types are detected, namely: CA, LT, FT, and MT. The two methodologies that have been presented in the past for characterizing the type of the plaque in FD-OCT data15,16 relied on the analysis of the reflected light and attempted to correlate the attenuation coefficients with various plaque formations. They both focused on the separate processing each A-line and used the attenuation coefficient of the light to correlate each individual line with a specific plaque type. However, these techniques do not combine information provided by adjacent A-lines to classify more accurately plaque components and failed to define a cutoff value for each plaque type so as to develop a precise and complete plaque classification methodology. On the contrary, the methodology presented in this study is a fully automated approach that is able to detect the luminal borders and identify and quantify the composition of the superficial plaque (depth: 1.5 mm). To our knowledge, this is the first approach that utilizes image processing, medical knowledge, and machine learning techniques to characterize different tissue types, and it is able to process without user interaction a sequence of good-quality FD-OCT images that do not have artifacts. The validation of the lumen detection methodology showed that our approach can address some of the common artifacts seen in FD-OCT images (i.e., the catheter artifact, small thrombi, or residual blood) and detect accurately the lumen borders (overlapping area ratio: 0.99 and nonoverlapping area ratio: 0.02). We also found good agreement between the manual annotations and the estimations of our methodology for the measured areas in the four plaque components (CA: , LT: , FT: , and MT: ). In addition, the qualitative validation of our approach for the four tissue types demonstrated that our methodology characterizes correctly most of the pixels portraying these tissues (overlapping area ratio for all tissue types). However, the nonoverlapping area analysis showed an increased nonoverlapping area ratio for the LT and MT (LT: 0.51 and MT: 0.47), indicating that our approach has a limited ability to detect the lateral extremities of these tissues. Additionally, there is a discrepancy between the approximation of the observers and our approach for the distal border of both tissues, which is not visible in OCT (Fig. 9). To date, FD-OCT images were analyzed manually by expert observers. This process, however, is time consuming, it is restricted to a fraction of the obtained data, i.e., 1 frame at every 0.4- or 1-mm interval, and the accuracy of the reported results relied on the expertise of the observers. The proposed methodology appears to overcome the abovementioned limitations as it is able to process the FD-OCT data and provide reliable estimations for the lumen border and plaque components. However, further improvements are required and a more robust validation using histological data is needed before this methodology can have applications in a clinical setting. A potential combination of our methodology with the information provided by the data derived from the analysis of the reflected OCT signal (i.e., the backscattering and attenuation coefficients) is likely to provide additional information (i.e., detection of microstructures such as the presence of macrophages and neo-vessels) and allow more accurate detection of different tissue types and especially of the LT and MT. 6.1.LimitationsA significant limitation of our approach is the fact that it is unable to detect the media, which is necessary for the characterization of the phenotype of the plaque (i.e., normal vessel wall, pathological intimal thickening, fibroatheroma, thin cap fibroatheroma, etc.) and the identification of the normal vessel wall.27 Additionally, the methodology is unable to detect microstructures such as macrophages and neo-vessels and measure the thickness of thin fibrous caps over fibroatheromas. In this study, we used the estimations of expert observers as the gold standard to validate the performance of the proposed methodology in tissues with a typical morphology. However, quite often the morphology of a tissue is not typical and the experts may provide unreliable estimations, especially in the characterization of deeply embedded tissues.28 Therefore, we are planning to further validate the proposed methodology using histological data; these data will allow us to have a more precise assessment of the performance of our method and will provide us the substrate and additional information, which can be used to re-train and optimize the efficacy of our methodology. Finally, our methodology fails to provide accurate estimation about the composition of the plaque in stented segments and in frames having artifacts (i.e., nonuniform rotational distortion, proximity artifacts, or tangential signal dropout artifacts). Moreover, although our approach is able to detect the lumen border in images having a small amount of residual blood or small thrombi, it is unable to provide reliable estimation about the composition of the plaque in these segments. 7.ConclusionsWe present a fully automated methodology that is able to detect the lumen borders and characterize the composition of the superficial plaque in FD-OCT images. The methodology is based on the analysis of the FD-OCT images and was validated using the estimations of expert observers as gold standard. Our results demonstrated that it permits reliable border detection and characterization of the different tissue types with a typical morphology. Further validation of the proposed approach in tissues with typical morphology using histology data is needed before this methodology is used in the clinical and research arena. AppendicesAppendix A:Cluster Parameter SelectionIn order to find the best number of clusters, we tested the performance of the -means algorithm on the 34 CA images using , 3, and 4 clusters. The results are presented in Table 2. When using , the CA could not be detected (overlapping area for the ), whereas when using , the results of the overlapping area analysis for the CA was 0.27. On the other hand, allowed accurate detection of the CA (overlapping area ratio: 0.81) and permitted detection of the outer tissue border. Table 2Overlapping area, nonoverlapping, and PPV for detecting calcium (CA) using different number of clusters.
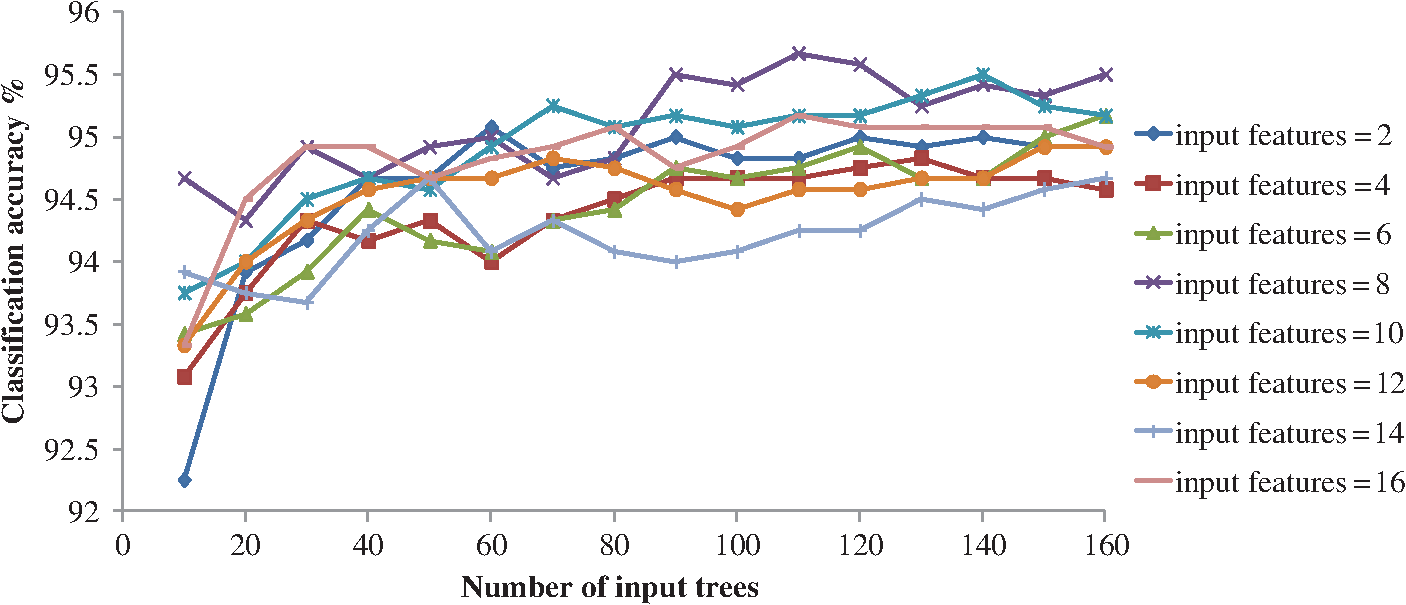
Appendix B:Pixels Neighborhood Size SelectionTo find the best pixels neighborhood () size for extracting the feature set, we performed a sensitivity analysis in the training set (60 images). Fifteen different neighborhood values () were used that provided 15 feature sets (). In the different feature sets, a 10-fold cross validation methodology was applied to find the best set for the proposed methodology. RF classifier (110 trees and 8 features) was used, and we found that outperformed the other feature sets; therefore we used a pixels size neighborhood. Appendix C:Feature Selection and Classifier Parameter SelectionSince WRP’s input is a classification algorithm, we used RF (110 trees and 8 features) classifier to calculate the overall accuracy achieved for each subset that is created and find the best WRP’s features. From the 44 features (, , , ) of the feature set WRP selected 17 features: (, , , , , and ). To find the best input parameters for the RF classifier, several numbers of features and trees were tested. Using the 17 features selected by the WRP and a 10-fold cross validation methodology, the best classification accuracy was achieved using 110 numbers of trees and eight features and was used as input for the RF classifier (Fig. 10). Appendix D:Postprocessing Threshold Sensitivity AnalysisTo find the best threshold () value, we shifted from 0.5 to 0.875 mm every 0.125 mm. Sensitivity-overlapping area, nonoverlapping area, and PPV of LT were computed for applying the postprocessing step using as 0.5, 0.625, 0.75, and 0.875 mm (Table 3). As it is shown in Table 3, the best overlapping area was achieved when applying , however the best PPV and the best nonoverlapping area was achieved when applying . Therefore, Pearson’s correlation coefficients were computed for these threshold values. was selected as threshold value for the postprocessing step, as its Pearson’s correlation coefficient (0.96) outperformed the correlation coefficient (0.77). Table 3Sensitivity and PPV of LT when applying different postprocessing Thpost values.
ReferencesL. Athanasiouet al.,
“Optical coherence tomography: basic principles of image acquisition,”
Intravascular Imaging: Current Applications and Research Developments, 180
–194 IGI Global, Pennsylvania
(2011). Google Scholar
E. RegarA. M. G. van LeeuwenP. Serruys, Optical Coherence Tomography in Cardiovascular Research, Informa Healthcare, United Kingdom
(2007). Google Scholar
H. G. Bezerraet al.,
“Intracoronary optical coherence tomography: a comprehensive review clinical and research applications,”
JACC-Cardiovasc. Interventions, 2
(11), 1035
–1046
(2009). http://dx.doi.org/10.1016/j.jcin.2009.06.019 JACCDI 0735- 1097 Google Scholar
Y. Kawaseet al.,
“In vivo volumetric analysis of coronary stent using optical coherence tomography with a novel balloon occlusion-flushing catheter: a comparison with intravascular ultrasound,”
Ultrasound Med. Biol., 31
(10), 1343
–1349
(2005). http://dx.doi.org/10.1016/j.ultrasmedbio.2005.05.010 USMBA3 0301-5629 Google Scholar
G. J. Tearneyet al.,
“Three-dimensional coronary artery microscopy by intracoronary optical frequency domain imaging,”
JACC Cardiovasc. Imaging, 1
(6), 752
–761
(2008). http://dx.doi.org/10.1016/j.jcmg.2008.06.007 JACCDI 0735- 1097 Google Scholar
F. Pratiet al.,
“Expert review document on methodology, terminology, and clinical applications of optical coherence tomography: physical principles, methodology of image acquisition, and clinical application for assessment of coronary arteries and atherosclerosis,”
Eur. Heart J., 31
(4), 401
–415
(2010). http://dx.doi.org/10.1093/eurheartj/ehp433 EHJODF 0195-668X Google Scholar
G. J. Tearneyet al.,
“Consensus standards for acquisition, measurement, and reporting of intravascular optical coherence tomography studies: a report from the international working group for intravascular optical coherence tomography standardization and validation,”
J. Am. Coll. Cardiol., 59
(12), 1058
–1072
(2012). http://dx.doi.org/10.1016/j.jacc.2011.09.079 JACCDI 0735-1097 Google Scholar
F. Pratiet al.,
“Expert review document part 2: methodology, terminology and clinical applications of optical coherence tomography for the assessment of interventional procedures,”
Eur. Heart J.,
(2012). http://dx.doi.org/10.1093/eurheartj/ehs095 EHJODF 0195-668X Google Scholar
I. K. Janget al.,
“In vivo characterization of coronary atherosclerotic plaque by use of optical coherence tomography,”
Circulation, 111
(12), 1551
–1555
(2005). http://dx.doi.org/10.1161/01.CIR.0000159354.43778.69 CIRCAZ 0009-7322 Google Scholar
H. Yabushitaet al.,
“Characterization of human atherosclerosis by optical coherence tomography,”
Circulation, 106
(13), 1640
–1645
(2002). http://dx.doi.org/10.1161/01.CIR.0000029927.92825.F6 CIRCAZ 0009-7322 Google Scholar
K. Sihanet al.,
“Fully automatic three-dimensional quantitative analysis of intracoronary optical coherence tomography: method and validation,”
Catheter Cardiovasc. Interventions, 74
(7), 1058
–1065
(2009). http://dx.doi.org/10.1002/ccd.v74:7 1522-1946 Google Scholar
S. Tanimotoet al.,
“A novel approach for quantitative analysis of intracoronary optical coherence tomography: high inter-observer agreement with computer-assisted contour detection,”
Catheter Cardiovasc. Interventions, 72
(2), 228
–235
(2008). http://dx.doi.org/10.1002/(ISSN)1522-726X 1522-1946 Google Scholar
G. J. Ughiet al.,
“Automatic segmentation of in-vivo intra-coronary optical coherence tomography images to assess stent strut apposition and coverage,”
Int. J. Cardiovasc. Imaging, 28
(2), 229
–241
(2012). http://dx.doi.org/10.1007/s10554-011-9824-3 1569-5794 Google Scholar
S. Tsantiset al.,
“Automatic vessel lumen segmentation and stent strut detection in intravascular optical coherence tomography,”
Med. Phys., 39
(1), 503
–513
(2012). http://dx.doi.org/10.1118/1.3673067 MPHYA6 0094-2405 Google Scholar
C. Y. Xuet al.,
“Characterization of atherosclerosis plaques by measuring both backscattering and attenuation coefficients in optical coherence tomography,”
J. Biomed. Opt., 13
(3), 034003
(2008). http://dx.doi.org/10.1117/1.2927464 JBOPFO 1083-3668 Google Scholar
G. van Soestet al.,
“Atherosclerotic tissue characterization in vivo by optical coherence tomography attenuation imaging,”
J. Biomed. Opt., 15
(1), 011105
(2010). http://dx.doi.org/10.1117/1.3280271 JBOPFO 1083-3668 Google Scholar
Z. Wanget al.,
“Semiautomatic segmentation and quantification of calcified plaques in intracoronary optical coherence tomography images,”
J. Biomed. Opt., 15
(6), 061711
(2010). http://dx.doi.org/10.1117/1.3506212 JBOPFO 1083-3668 Google Scholar
A. F. Fercher,
“Optical coherence tomography–development, principles, applications,”
Z. Med. Phys., 20
(4), 251
–276
(2010). http://dx.doi.org/10.1016/j.zemedi.2009.11.002 1876-4436 Google Scholar
N. Otsu,
“Threshold selection method from gray-level histograms,”
IEEE Trans. Syst. Man. Cybern., 9
(1), 62
–66
(1979). http://dx.doi.org/10.1109/TSMC.1979.4310076 ISYMAW 0018-9472 Google Scholar
C. M. Bishop, Pattern Recognition and Machine Learning, Springer, New York
(2006). Google Scholar
C. H. ChenP. S. P. Wang, Handbook of Pattern Recognition and Computer Vision, World Scientific, River Edge, NJ, London
(2006). Google Scholar
L. NanniA. LuminiS. Brahnam,
“Local binary patterns variants as texture descriptors for medical image analysis,”
Artif. Intell. Med., 49
(2), 117
–125
(2010). http://dx.doi.org/10.1016/j.artmed.2010.02.006 AIMEEW 0933-3657 Google Scholar
Z. GuoL. ZhangD. Zhang,
“Rotation invariant texture classification using LBP variance (LBPV) with global matching,”
Pattern Recognit., 43
(3), 706
–719
(2010). http://dx.doi.org/10.1016/j.patcog.2009.08.017 PTNRA8 0031-3203 Google Scholar
R. C. GonzalezR. E. Woods, Digital Image Processing, Prentice Hall, Upper Saddle River, NJ
(2002). Google Scholar
M. A. HallG. Holmes,
“Benchmarking attribute selection techniques for discrete class data mining,”
IEEE Trans. Knowl. Data Eng., 15
(6), 1437
–1447
(2003). http://dx.doi.org/10.1109/TKDE.2003.1245283 ITKEEH 1041-4347 Google Scholar
L. Breiman,
“Random forests,”
Mach. Learn., 45
(1), 5
–32
(2001). http://dx.doi.org/10.1023/A:1010933404324 MALEEZ 0885-6125 Google Scholar
L. Raberet al.,
“Atherosclerosis,”
The Clinical Atlas of Intravascular Optical Coherence Tomography for iPad, Apple, Toulouse, France
(2012). Google Scholar
O. Manfriniet al.,
“Sources of error and interpretation of plaque morphology by optical coherence tomography,”
Am. J. Cardiol., 98
(2), 156
–159
(2006). http://dx.doi.org/10.1016/j.amjcard.2006.01.097 AJNCE4 0258-4425 Google Scholar
BiographyLambros S. Athanasiou received his diploma degree in the Department of Information and Communication Systems Engineering from the University of Aegean, Greece, in 2008. He is currently working toward his PhD degree in the Department of Materials Science and Engineering at the University of Ioannina. His research interests include medical image processing, biomedical engineering, decision support, and medical expert systems. Christos V. Bourantas graduated from the Medical School, University of Ioannina, Greece, in 1999 and received his PhD degree from the same university in 2005. He completed his cardiology training in 2011. He is currently working as fellow in interventional cardiology at the Newcastle Upon Tyne NHS Trust and is an honorary lecturer in the Department of Academic Cardiology, University of Hull. His research interests include invasive and noninvasive cardiovascular imaging and 3-D modeling. George Rigas received his bachelor’s, MSc, and PhD degrees from the Department of Computer Science of the University of Ioannina in 2003, 2005, and 2009, respectively. Since 2010 he has been working as a postdoctoral researcher in the Unit of Medical Technology and Intelligent Information Systems in the University of Ioannina, Greece. His research interests involve signal processing, machine learning, and pattern recognition. Antonis I. Sakellarios received his BSc degree in the Department of Biological Applications and Technologies of the University of Ioannina in 2006. He is currently a PhD candidate in the Department of Materials Science and Engineering of University of Ioannina. His thesis title is “Mathematical modeling of the development of the atherosclerotic plaque.” He is a research assistant at the Unit of Medical Technology and Intelligent Information Systems of the University of Ioannina. Themis P. Exarchos received his diploma degree in computer engineering and informatics from the University of Patras, Patras, Greece, in 2003 and his PhD degree from the Department of Medical Physics of the University of Ioannina. His research interests include modelling of biological procedures, medical data mining, decision support systems in healthcare and biomedical applications. Panagiotis K. Siogkas received his diploma in mechanical and aeronautical engineering from the University of Patras, Patras, Greece, in 2009. He is currently a PhD candidate in biomedical engineering in the Department of Materials Science Engineering at the University of Ioannina, Ioannina, Greece. His research interests specialize in blood flow modelling in arterial segments. He has also worked for two research and development projects funded by the EC and other bodies. Andrea Ricciardi has a master’s degree in physics with a final research work in supercomputer programming. He worked for 10 years in the architecture definition and software development of high performance digital signal processors. He is a cofounder of Astrel Instruments, a company specialized in optical and scientific instruments development, and software development coordinator for the “Centro per la Lotta contro l’Infarto” foundation, where he develops innovative software for medical applications. Katerina K. Naka received her MD degree from the University of Ioannina Medical School, Ioannina, Greece, and her PhD degree in cardiology from the University of Wales College of Medicine, Cardiff, Wales, UK, in 2003. Her research interests include pathophysiology of atherosclerosis, vascular endothelial function and large arterial mechanics, echocardiography, coronary imaging, and bioengineering. She has been with the University of Ioannina Medical School since 2006 and is currently an assistant professor of cardiology. Michail I. Papafaklis has been a postdoctoral research fellow at the Brigham & Women’s Hospital, Harvard Medical School, as well as a research affiliate at the Massachusetts Institute of Technology. He has received several awards, including the Young Investigator Award by the European Society of Cardiology in 2011. His research interests focus on hemodynamics, coronary artery imaging, biomedical engineering, interventional cardiology, and the pathophysiology and molecular mechanisms of atherosclerosis. Lampros K. Michalis received his medical qualification from the University of Athens Medical School, Greece, in 1984. He was awarded his PhD with distinction from the University of Athens Medical School in 1989. Since 1995 he has been with the University of Ioannina Medical School, Ioannina, Greece, where he is a professor of cardiology. His research interests focus on interventional cardiology, intravascular imaging, pathophysiology of coronary and peripheral artery disease, and bioengineering. Francesco Prati received his MD degree in medicine and surgery from the University of Rome, Italy “La Sapienza” (1986). He worked as a fellow in the University of Bologna, Italy, Institute of Cardiovascular Disease (1987 to 1991). He was trained in interventional cardiology at the St. Vincent Hospital in Indianapolis, Indiana (1991 to 1992) and had research training in interventional cardiology at the THORAXCENTER, Erasmus University of Rotterdam (The Netherlands) (1994 to 1995). He is author and coauthor of over 130 publications. Dimitrios I. Fotiadis received his diploma degree in chemical engineering from National Technical University of Athens, Athens, Greece (1985), and his PhD degree in chemical engineering from the University of Minnesota, Minneapolis (1990). Currently he is a professor at the Department of Materials Science and Engineering, University of Ioannina, Greece, and the director of the Unit of Medical Technology and Intelligent Information Systems, Greece. His research interests include biomedical engineering, scientific computing, and intelligent information systems. |
|||||||||||||||||||||||||||||||||||||||||||||||||||||||||||||||||||||||||||||||||||