
|
|
1.IntroductionBlood is the essential bodily fluid that delivers oxygen and nutrients to different organs of the body and carries away waste products from them. There are three types of blood cells: erythrocytes, leukocytes, and thrombocytes. By volume, the red blood cells constitute of whole blood, the plasma , and white cells . The normal hemoglobin (Hb) level varies for men from 13.5 to and for women from 12.0 to ; a person with Hb level is termed as anemic. Anemia is the most common blood condition in the world and affects women more than men. Certain forms of anemia (e.g., thalassemia [Thal], sickle cell) are hereditary, and others such as iron deficiency anemia (IDA) mostly arise out of excessive blood loss, decreased red cell production, etc. Deficiency of iron or vitamin in diet are some of the most common causes for IDA. These are temporary and could be easily rectified. Beta Thalassemia ( Thal) is a genetic disorder caused by the reduced synthesis of the beta chains of hemoglobin. Individuals with Thal major usually present with severe anemia, poor growth, and skeletal abnormalities within the first two years of life. This disease is most common in Mediterranean, west Asian, and north African countries as well as in India. The incidence of Thal disease is highest in Greece, but the number of Thal carriers is highest in the Maldives. The most common methods of Thal diagnosis are Hb electrophoresis, gel electrophoresis, and high-performance liquid chromatography (HPLC). These three techniques separate out different hemoglobins (e.g., HbA, HbS, HbA2, etc.) and quantify their concentration in term of percentage and classify as Thal, Thal, etc.1,2 Apart from the above methods, polymerase chain reaction is also used occasionally, which provides the gene profiles.3 Many studies had shown that IDA can cause misdiagnosis with heterozygote -Thal. The hematologists then recommend rechecking of HbA2 level after overcoming IDA.4,5 Earlier, in a series of papers, we had shown the efficacy of spectral technique for diagnosis of different types of cancers.6 As a logical extension, we demonstrate here the potential of spectral differentiation between IDA and Thal patients. This method could prove useful to identify and separate IDA samples from those of Thal. 2.Materials and MethodsExperiments were performed on blood samples from IDA and Thal patients and also age-adjusted healthy controls. 2.1.ControlsExactly 5 ml of venous blood from each of 15 healthy volunteers (age range: 18 to 34 years) was collected in a violet sterile vial that contained the anticoagulant ethylenediamine tetra-acetic acid (EDTA). The vial was gently rocked five times to adequately mix the EDTA with the whole blood; then it was centrifuged at 3000 rotations per minute (rpm) for 15 min. A pale, greenish-yellow clear plasma supernatant was obtained by such centrifugation. A total of 1.5 ml of supernatant was removed from the top layer for spectrofluorimetric analysis, leaving behind the buffy coat and the formed elements. The blood plasma sample thus obtained was subjected to synchronous spectral analyses without any other treatment. Next, the buffy coat, which contained mostly the white blood cells, was removed and discarded, and exactly 1 ml of the thick formed elements from the bottom layer, which contained mostly red blood cells (RBCs), was removed and drawn into a sterile vial. It was then mixed with 2 ml of analytical-grade acetone. Proper care was taken to ensure that the formed elements did not develop lumps. After thorough mixing to enable the acetone to extract the fluorophores within and around the cells, the sample was centrifuged again (3000 rpm for 15 min). The resulting supernatant was subjected to fluorescence emission spectra analysis with an excitation wavelength of 400 nm. 2.2.PatientsThe same protocol was used to process blood samples obtained from confirmed IDA and Thal patients. Samples were collected from all the Thal patients ( Thal) of Voluntary Health Service, Chennai, India, waiting for blood transfusion. Similarly, samples were collected from confirmed IDA patients of Kidwai Memorial Institute of Oncology, Bangalore, India. The patients were informed about the investigation, and proper consents were obtained. The IDA subjects (nine females and six males) had a median age of 26 years, and the Hb level for them varied from 6.2 to 9.5 with a median of . There were 15 Thal subjects (seven females and eight males) with a median age of 20 years, and the Hb level for them varied from 4.2 to 7.5 with a median of . The normal controls were students, researchers, and staff nurses (seven females and eight males) with an average age of 25, from whom informed consents were obtained. The Hb level for the control set varied from 11.2 to 15.5 with a median of . The instrument used was a spectrofluorometer (Elico India LS142) capable of collecting excitation, emission, and synchronous spectra in the 200- to 800-nm range. An excitation and emission slit width of 10 nm and scan speeds of were used. Each sample was placed in quartz cuvettes and illuminated by a specified wavelength of light with a 10-nm spectral width and a spot size of 3 by 2 mm. Three types of spectra are common in the field of fluorescence spectroscopy. In fluorescence emission spectra (FES), one particular wavelength is selected for the excitation of a molecule, and the fluorescence emission spectrum is obtained by rotating the emission grating over a predetermined range. The reverse is true of fluorescence excitation spectra (FXS), in which the peak emission band of a molecule is selected, and the excitation grating is rotated to scan the excitation spectra. Such FES and FXS are very useful for understanding the absorption and emission characterizing of a particular molecule. In contrast, for getting the information about the relative concentration about a set of molecules in a composite mixture like blood, synchronous excitation or emission spectra is more reliable.7 In synchronous excitation spectra (SXS), both gratings are synchronously rotated with an offset of 70 nm to obtain the fluorescence excitation band of every molecule in the predetermined range. The wavelength offset and scan range are not unique; they are determined empirically by trial and error for a given set of experimental protocols. After analyzing other offsets, it was found in our experiment that the 70-nm offset provided excellent resolution and good contrast between the IDA and Thal samples because 70 nm was the Stokes shift8 of the most important biofluorophores [e.g., tryptophan, nicotinamide adenine dinucleotide (NADH), flavin adenine dinucleotide (FAD), etc.] found in blood plasma. When the offset was 10 nm, instead of 70 nm, the fluorescence emission bands of the same set of molecules present in the sample were obtained. This is known as synchronous emission spectra (SES). 3.ResultsIn this research, we had analyzed the most important spectral features of blood components, which distinguish the Thal patients from those of IDA and also from the normal controls. Figure 1 is the FES of acetone extract of the RBC of the three sets. There is a peak around 490 nm due to residual FAD of the plasma and two more important peaks at and 630 nm (due to different forms of porphyrin) as shown in Ref. 9. A parameter is taken as , the ratio between the intensity of fluorescence emission peak at 630 and 585 nm. This is for the sample of normal control, but 0.5 for Thal and 1.0 for IDA patients. Note that Fig. 1 gives the averaged spectra for 15 samples of each category. We present spectra normalized with respect to the intensity at 490 nm. Such normalization would give the information about the relative concentration of molecules under discussion and eliminate experimental errors arising out of sample volume and instrumental response. Fig. 1Fluorescence emission spectra of acetone extract of RBC for (a) normal, (b) thalassemia, and (c) iron deficiency anemia (IDA) subjects. The band at 490 nm is due to residual flavin adenine dinucleotide (FAD) in plasma; the bands at 585 and 630 nm are due to two different porphyrins released from RBC. 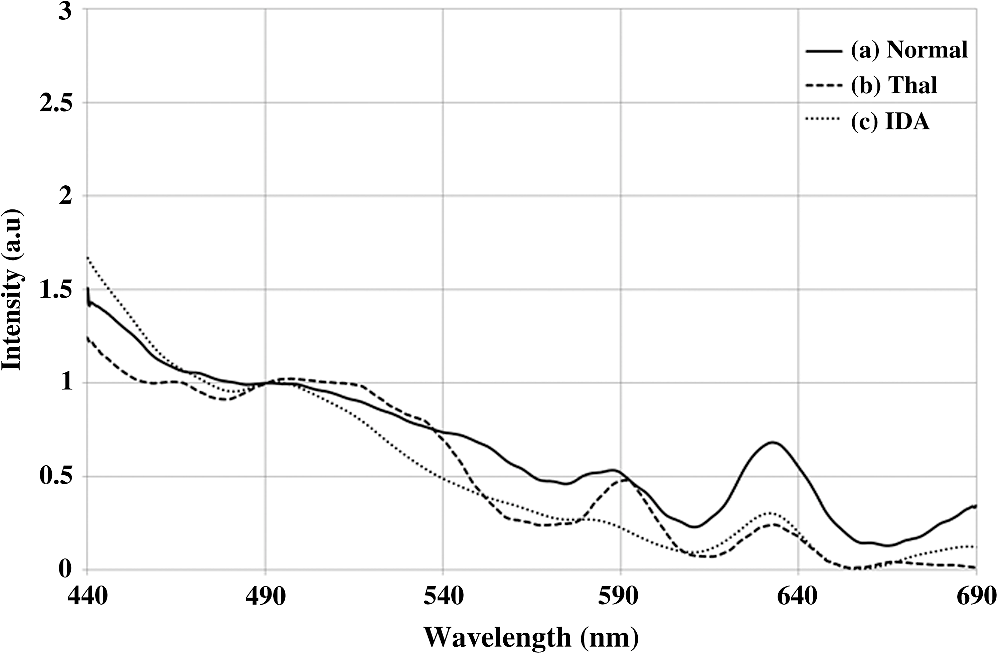 Figure 2 is the SXS obtained by keeping an effect of 70 nm between the emission and excitation grating. Figure 2(a) gives the average SXS of normal control samples. It shows three major bands with peaks at 285, 365, and 465 nm. A ratio parameter is defined as , i.e., the ratio of intensity at 465 nm to that at 365 nm. Such fluorescence intensity ratio parameter, instead of the actual intensity, reduces experimental and instrument variation. This ratio represents the relative concentration of fluorophores, such as FAD (with excitation/absorption peak at 465 nm) and NADH (with excitation/absorption at 365 nm). This ratio is for the normal control. Fig. 2Synchronous excitation spectra of blood plasma of (a) normal, (b) thalassemia, and (c) IDA subjects. Here the band at 285 nm is due to the excitation peak of tryptophan, the band at 365 nm is of nicotinamide adenine dinucleotide, and the band at 465 nm is of FAD. 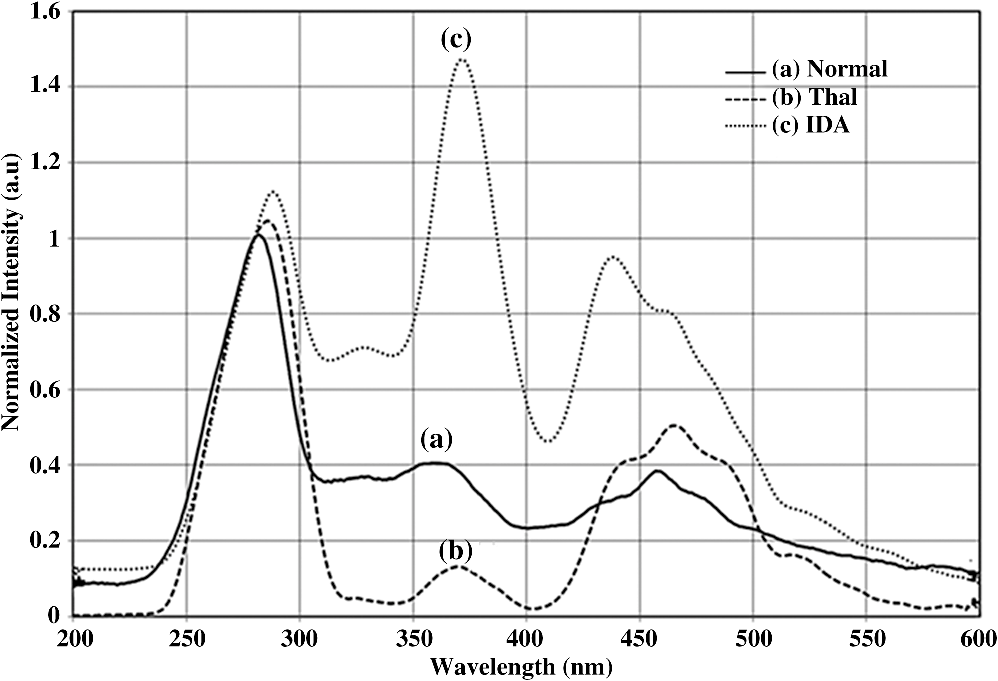 Figure 2(a) is to be compared with the SXS features of average spectra of samples of Thal plasma, shown in Fig. 2(b). The two spectra are distinctly different with very low intensity at 365 nm for Thal. Once again is calculated and this is , which means is about four times elevated for the Thal samples. Such changes are found due to decrease in intensity at 365 nm rather than the increase at 465 nm. Figure 2(c) gives the average spectra of plasma sample of IDA patients. This set is markedly different from those of the normal control and also from those of the Thal subjects in terms of the ratio , which is . This ratio is 1.4 times smaller than that of the normal control and six times smaller than that of the Thal. Such distinct differences are mostly due to the band at 365 nm (due to NADH) and that at 465 nm (due to FAD). A scatter plot was obtained for the actual values of for all three sets, as shown in Fig. 3. Fig. 3Scatter plot of the ratio parameters () for normal, thalassemia, and IDA subjects. Here, it can be seen that normal could be separated from IDA and thalassemia subjects; but for the latter two, there is some overlap.  In an earlier paper, we had shown the spectral features to discriminate Thal samples from the normal control; hence, we focus more on the discrimination between Thal and IDA samples for the rest of the investigation. Figure 4 gives the SES obtained with the offset of 10 nm between the emission and excitation grating. Here, Fig. 4(a) is the averaged intensity spectra for Thal and Fig. 4(b) for IDA samples. The two spectra are significantly different. For example, the first peak occurs at 325 nm and the most prominent peak occurs at 525 nm. In contrast, the first peak occurs at 360 nm for IDA; the next prominent peak at 500 nm is not much elevated. The ratio parameter gives the value 1.5 for Thal and 0.33 for the IDA. Another ratio is also taken for the Thal and IDA samples. The average value of is for the Thal and 0.62 for IDA. Fig. 4Synchronous fluorescence spectra of blood plasma thalassemia and IDA subjects. Here the band at 360 nm is due to the fluorescence of tryptophan, the band at 505 nm is due to FAD, and the band at 585 nm is due to porphyrin.  As our main objective is discrimination between the Thal and IDA samples, receiver operating characteristic (ROC) curves were obtained for all the three ratio parameters obtained from the spectral features of plasma. For each of them, the area under the curve (AUC) is , indicating a significant level of separation. Note that for , the curve runs parallel to both axes, showing a separation of 100%. 4.DiscussionWhen patients present with the symptoms of anemia, the clinician will send the blood samples of the patients for the complete blood count (CBC) analysis, as RBC indices are crucial in anemia diagnosis as well as ferritin levels, and the next battery of tests would be hemoglobin electrophoresis and/or HPLC to identify blood disorders like Thal, IDA, sickle cell anemia, etc. These techniques are cumbersome and expensive. Spectral diagnosis is a new technique wherein the detection and quantification of a certain set of fluorescent biomolecules have enabled diagnosis of liver cancer,10 cervical cancer,6 pancreatic cancer,11 etc., with sensitivity and specificity on the order of 90%. The same technique has been extended to the discrimination between two major inherited blood disorders: Thal and sickle cell anemia.12 This paper now pertains to obtaining spectral features of IDA and Thal blood samples to classify them as two distinct categories, as well as possible. The Hb level for the IDA set under investigation had a range from 6.2 to and for the Thal from 4.2 to . Though Hb level was times greater for IDA subjects than for the Thal ones, there was considerable overlap between the Thal and IDA set from the point of view of hemoglobin level. The fluorescence component in RBC was porphyrin, and its intensity was approximately proportional to the concentration of RBC in blood. Figure 1 shows a measure of porphyrin in three types of blood samples. It can be seen that the ratio parameter is for normal control, 0.5 for Thal, and 1.0 for IDA. It is important to note that the spectral diagnosis establishes one-to-one correspondence to the conventional pathological findings. Figure 3 shows the scatter plot of ratio for all three sets. The spectral diagnosis as presented here also could not separate IDA from Thal completely as shown in Fig. 3. However, the spectral features of blood plasma could accomplish this objective very well as shown in Figs. 2 and 4. Figure 2 is the SXS of blood plasma of the normal control, IDA, and Thal. It is easy to see the differences in the spectral features, the most important being the changes in the concentration of NADH and FAD. The ratio indicates the relative concentration between FAD and NADH; this is for the normal control, 4 for Thal, and 0.7 for IDA. The ROC for this ratio alone runs parallel to both axes (see Fig. 5), indicating sensitivity and specificity each of 100%. Fig. 5Receiver operating characteristic of ratio parameters of , , and . This gives the classification efficiency of two data sets, IDA and thalassemia. 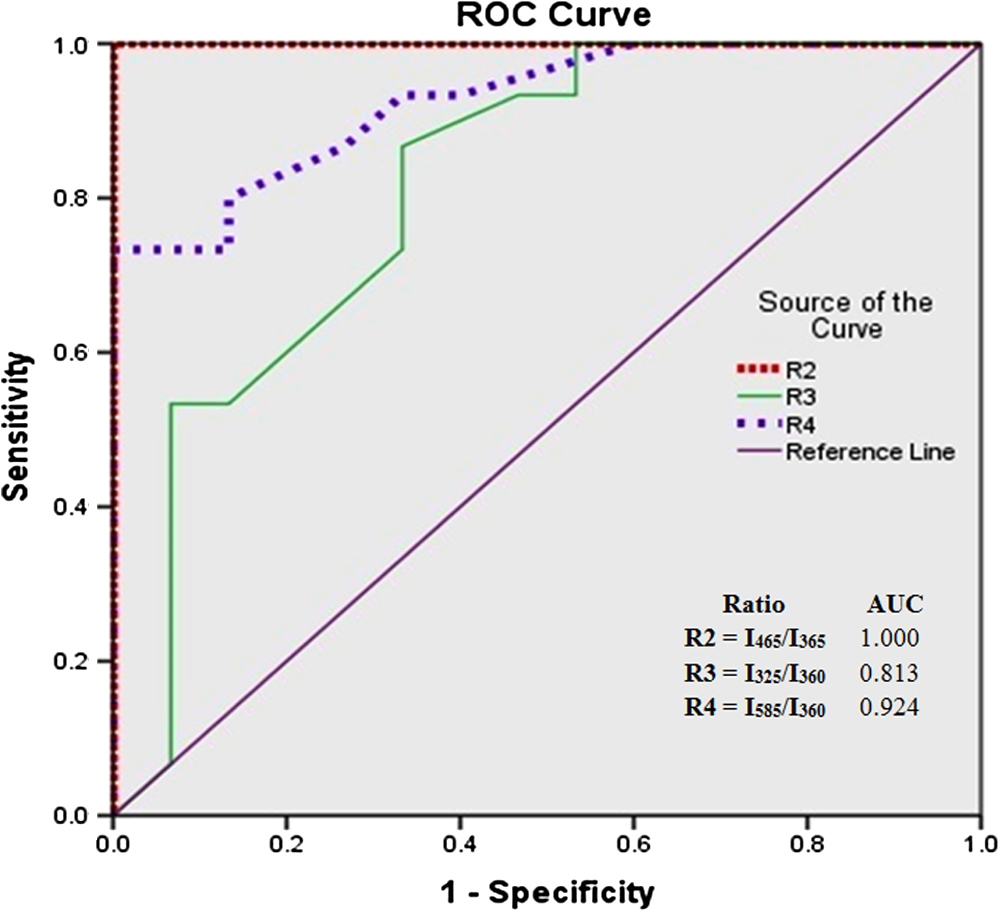 The average lifetime of a normal RBC is days, and some of its final product is biliverdin and bilirubin. In this metabolic process, FAD is produced and NADH is consumed copiously. For normal controls, the ratio between these two is maintained in proper equilibrium as unity. This is not so for anemic patients. For Thal patients, not only the RBC concentration is about twice or thrice as low, but the average lifetime of RBCs is five times lower as well. This is reflected in the striking imbalance between NADH and FAD levels, with an abnormally low value for NADH and high value for FAD. In contrast, the RBC of IDA, though less in number, apparently does not decay as fast as that of the Thal patients. Due to some unidentified enzyme activity for the IDA, intensity of NADH is more elevated than that for Thal and normal controls. More work needs to be done to confirm this surprising feature, and also to identify the biochemical reason. Figure 4 is the synchronous emission spectra (SES) of IDA and Thal plasma samples only. SXS and SFS are expected to be the two sides of the same coin, since the former one represents the excitation spectra and the latter one the emission spectra of the individual fluorophores in a composite system. This would be strictly true only when three pure biomolecules (tryptophan, NADH, FAD) are taken in saline water, but not as found in blood plasma. This is because blood plasma contains many biomolecules other than the above three and, hence, distortion is considerable. In spite of these, there are 290-, 365-, and 465-nm bands in the SXS and 360-, 440-, and 500-nm bands in the SFS. These are the excitation and emission spectra of tryptophan, NADH, and FAD, respectively. In addition, there is a band at 325 nm due to tyrosine and 585 nm due to porphyrin in SFS (Fig. 4). These spectral band assignments agree well with the existing literature values.13 All these were confirmed by us too by adding small quantities of tyrosine, tryptophan, NADH, FAD, and porphyrin individually in saline water and taking the SXS and SFS (not shown here). Ratio parameters and could also distinguish IDA from Thal reasonably well, with AUC for being 0.812 and that for being 0.924. Among the four parameters, it is which has the highest classification capability in terms of AUC. The most important feature of the result reported here is that if we could not separate IDA from Thal by CBC (based on RBC quantification), spectral features of plasma (which is generally discarded so far) could provide a reliable and easy classification strategy. 5.ConclusionIn this preliminary investigation, a fluorescence spectral analysis has been carried out with a limited number of blood samples drawn from patients with Thal and IDA. Our results show that the spectral analysis on plasma, better than on cellular component, would give more reliable results. Out of the two types of synchronous spectra reported here, SXS is better than SFS for classification of two sets with an accuracy of 100%. It is important to mention that a large number of such samples are being analyzed in a multicenter study to make this technique a clinically viable protocol. AcknowledgmentsThe authors would like to extend their sincere appreciation to the Deanship of Scientific Research at King Saud University for its funding of this research through the Research Group Project No. RGP-VPP-223. ReferencesR. B. Colahet al.,
“HPLC studies in hemoglobinopathies,”
Indian J. Pediatr., 74
(7), 657
–662
(2007). http://dx.doi.org/10.1007/s12098-007-0117-8 IJPEA2 0019-5456 Google Scholar
S. P. CaiY. W. Kan,
“Identification of the multiple beta-thalassemia mutations by denaturing gradient gel electrophoresis,”
J. Clin. Invest., 85
(2), 550
–553
(1990). http://dx.doi.org/10.1172/JCI114471 JCINAO 0021-9738 Google Scholar
M. Mariaet al.,
“Detection of -thalassemia by a DNA piezoelectric biosensor coupled with polymerase chain reaction,”
Anal. Chim. Acta, 481
(1), 55
–64
(2003). http://dx.doi.org/10.1016/S0003-2670(03)00065-5 ACACAM 0003-2670 Google Scholar
K. RezaM. Tayyebi,
“The effect of iron deficiency anemia (IDA) on the HbA2 level and comparison of hematologic values between IDA and thalassemia minor,”
Int. J. Hematol. Oncol., 3
(17), 151
–156
(2007). UUHDAW 1306-133X Google Scholar
M. T. ElghetanyB. Katalin,
“Erythrocyte disorders,”
Henrys Clinical Diagnosis and Management by Laboratory Methods, 504
–507 21st ed.Saunders Elsevier, Philadelphia, USA
(2007). Google Scholar
V. Masilamaniet al.,
“Fluorescence spectra of blood and urine for cervical cancer detection,”
J. Biomed. Opt., 17
(9), 098001
(2012). http://dx.doi.org/10.1117/1.JBO.17.9.098001 JBOPFO 1083-3668 Google Scholar
M. S. AlSalhiet al.,
“Detection of cancer by optical analysis of body fluids—a single blind study,”
Technol. Cancer Res. Treat., 10
(2), 145
–152
(2011). TCRTBS 1533-0346 Google Scholar
R. R. AlfanoY. Yang,
“Stokes shift emission spectroscopy of human tissue and key biomolecules,”
IEEE J. Quantum Electron., 9 48
–153
(2003). IEJQA7 0018-9197 Google Scholar
R. Kalaivaniet al.,
“Fluorescence spectra of blood components for breast cancer diagnosis,”
Photomed. Laser Surg., 26
(3), 251
–256
(2008). http://dx.doi.org/10.1089/pho.2007.2162 PLDHA8 1549-5418 Google Scholar
M. S. AlSalhiet al.,
“Diagnosis of liver cancer and cirrhosis by the fluorescence spectra of blood and urine,”
Technol. Cancer Res. Treat., 11 345
–351
(2012). http://dx.doi.org/10.7785/tcrt.2012.500282 TCRTBS 1533-0346 Google Scholar
A. Al-Diabet al.,
“Detection of pancreas by native fluorescence of blood components—a preliminary report,”
Emirates Med. J., 25
(1), 29
–38
(2007). Google Scholar
V. Masilamaniet al.,
“Spectral detection of sickle cell anemia and thalassemia,”
Photodiagn. Photodyn. Ther., 10
(4), 429
–443
(2013). http://dx.doi.org/10.1016/j.pdpdt.2013.04.001 PPTHBF 1572-1000 Google Scholar
N. Ramanujam,
“Fluorescence spectroscopy of neoplastic and non-neoplastic tissues,”
Neoplasia, 2
(1–2), 89
–117
(2000). http://dx.doi.org/10.1038/sj.neo.7900077 1522-8002 Google Scholar
BiographySandhanasamy Devanesan, MPhil, is pursuing his final year PhD, working as a researcher at Research Chair in Laser Diagnosis of Cancer, College of Science, King Saud University. He has six years of research experience in the field of cancer biology, Optical Biopsy and hemoglobinopathies. He had published seven research papers in international journals. AlSalhi Mohamad Saleh, PhD, is head of the Chair of Laser Diagnosis of Cancer, Former Vice Dean of King Abdullah Institute for Nanotechnology (KAIN). He has published 96 research papers and six U.S. patents. Mani Ravikumar, MPhil, is pursuing a PhD in biotechnology at Government Arts College for Men, Chennai, India. His professional interests focus on nanotechnology and his current projects include nanoparticles synthesis and characterization of optical properties of nanoparticles. He has published 15 research articles. Kantharaj Perinbam, PhD, is currently teaching botany, biotechnology at Government Arts College for Men, Chennai, with aggregate teaching experience of 10 years. Her current projects include nanoparticles synthesis and characterization, optical properties of biomolecules. She is a member of the Indian Association of Biomedical Scientists and Indian Association of Applied Microbiologists. She has published 19 research articles. Saradh Prasad is working as a researcher at KSU Research Chair for Laser Diagnosis of Cancers since July 2011. His area of specialization is conjugated-polymer lasers, opto-electronics and optical biopsy. He got an MTech in laser and electro-optical engineering from the College of Engineering, Anna University, Chennai. Now he is pursuing his PhD in the design of broadband tunable conjugated-polymer laser. H. Al-Saeed Abbas is an assistant professor and consultant of the King Saud University, College of Medical Sciences. He trained in hematology, transfusion medicine, King Khalid, Hospital Riyadh. He has published more than 25 articles in various national and international journals and wrote a book on sickle cell disease in Arabic language. Siddanna R. Palled, MD, is a radiation oncologist with 10 years of experience. He is working at HCG Bangalore Institute of Oncology, and also in Kidwai Memorial Institute of Oncology, Bangalore, India. Karuppaiah Jeyaprakash, PhD, is working as head, PG & Research Department of Biochemistry, Rajah Serfoji Government College, Thanjavur, India. He has 18 years of teaching and research experience in the field of medicinal plants, clinical biochemistry, cancer biology, and nanoparticle synthesis. He has guided three students for their doctoral program. He has published 16 research papers in various national and international journals. Vadivel Masilamani, PhD, is working as a distinguished professor in laser physics in KSU and professor in Research Chair in “Laser Diagnosis of Cancer.” He has over thirty-eight years of research experience in the field of design of gas, liquid and solid-state lasers and their applications to medicine and material processing. He has published 70 research papers and six U.S. patents. |


