|
|
1.IntroductionBiophotonic diagnosis of soft tissues using purely and hybrid-optical techniques has witnessed significant advancement during the past three decades and has been recognized as a promising nonionizing tool for the early screening of diseases due to its high resolution and contrast regarding tissue modifications, malignancies, and many other physiological changes.1,2 Purely optical methods, like optical coherence tomography, diffuse optical tomography, fluorescence and luminescence detections, and Raman and infrared (IR) spectroscopies, give reliable results only for peripheral tissues since they suffer loss of coherence for deep zone imaging due to extreme light scattering.3–11 Hybrid methods, like photoacoustic tomography/microscopy, ultrasound-modulated optical tomography, and photothermal (PT) imaging, have well-proven advantages in analyzing deep subsurface features with optical contrast.12–19 Their success is due to the energy conversion process that generates the signal, which results in greatly enhanced dynamic range compared with direct energy methods. Despite the well-known advantages of these approaches for the (early) screening of cancer, cardiovascular diseases, ophthalmic disorders, brain tumors and failure of cerebral functions, and cellular and genetic disorders, which are fundamentally related to soft tissues, bio-optic diagnosis of hard tissues—especially bones—remains a sparsely explored domain. Bone diseases, particularly osteoporosis (OP), have been identified as the second leading health care problem after cardiovascular diseases. Among the World’s population, one in every four women and every eight men over the age of 50 is suffering from OP-related health risks.20 The inefficiency of existing diagnostic techniques for early-stage detection of OP causes significant delays in initiating medical intervention and thus contributes to the severity of the disease in a major way. Established OP diagnostic modalities, like dual-energy x-ray absorptiometry, x-ray micro-computed tomography (), mechanical-response tissue analysis, and quantitative ultrasound tomography, have disadvantages such as poor sensitivity or contrast and exposure to ionizing radiation hazards.21–23 The complex bone geometry consisting of the hard cortical layer with the inner trabecular network and the presence of soft tissue and skin overlayers hinder the adoption of existing biophotonic techniques toward efficient bone diagnosis.24 During the early stages of OP, demineralization mainly occurs in the trabecular region and hence the capability to resolve the trabeculae-generated signals is essential for any modality to satisfy the early detection criterion. The depth range of optical coherence tomography is too small (typically ) to cope with this challenge. Fluorescence and luminescence give a depth-integrated signature, and deconvoluting the contribution of bone trabeculae from the composite signal is a cumbersome process. Raman spectroscopy is sensitive to both organic and mineral phases of bones. However, its advantages are beneficial mostly to in vitro studies because the Raman spectral lines are inherently weak and are strongly scattered by both soft and hard tissues.25,26 Although diffuse optical tomography yields depth-resolved information, its resolution is inadequate for the trabecular network structure, which usually lies in the submillimeter regime.27 Photoacoustic tomography can image depth-resolved distribution of soft tissue features with high sensitivity and resolution; however, it performs poorly with bone tissues due to the multiple reflections and severe attenuation of ultrasound signals within the trabecular pores, especially at higher frequencies necessary for enhanced spatial and axial resolutions.13,28–31 Recently, we demonstrated a PT imaging modality called truncated-correlation photothermal coherence tomography (TC-PCT) for the depth-resolved, three-dimensional (3-D) visualization of the thermo-optical features of light absorbing translucent/opaque media.32 Traditional PT techniques which follow the detection of thermal waves generated by modulated optical excitation yield a depth-integrated two-dimensional (2-D) picture of the sample thermophysical features. Using TC-PCT, we have achieved the highest degree of energy localization in a parabolic-wave governed thermal-diffusion-wave field with controllable axial/depth resolution and range. TC-PCT further enables layer-by-layer separation for the independent analysis of various stacks contained in the sample tomogram, reminiscent of a similar optical coherence tomography capability. Furthermore, we have introduced a 3-D PT marker called the thermal wave occupation index (TWOI), derived from TC-PCT, which exhibits an inverse correlation with the degree of bone demineralization or a positive correlation with bone mineral density (BMD). Obviously, TC-PCT analysis of bones has the distinct advantage of computational slicing the cortical and trabecular regions for independent investigations on the status of BMD and, hence, for screening OP in a nonionizing manner. In this article, we investigate the potential of TC-PCT for the detection of bone demineralization in chemically etched goat rib samples in a depth-resolved manner. Since mineral loss is confined to the trabecular region during the initial stage of OP, tracing the trabecular BMD through the cortical overlayer is an advantage in the context of early detection of this disease. We used analysis, assuming it to be the gold standard, for the estimation of a few 2- and 3-D x-ray morphometric parameters with well-known demineralization dependency. The cortical and trabecular sections were analyzed separately and together for investigating the variation of these parameters with demineralization time. The observed correlations between the demineralization time-dependent changes in the parameters and their TC-PCT counterparts validate the potential of the latter for monitoring bone mineral loss in a depth-resolved manner. Furthermore, a sensitivity comparison has been carried out for various and TC-PCT parameters. 2.Principle of TC-PCTContrary to the depth-integrated nature of traditional PT techniques, the recently introduced depth-selective approach involving the chirped-pulsed PT radar exhibits high depth-resolving and penetrating capabilities along with excellent sensitivity.33 The PT radar is a prominent class of methodologies proposed to achieve the energy localization in parabolic diffusion-wave fields.19,34 If and are the excitation (reference) and response (signal), respectively, the latter being measured at the delay time and then the cross-correlation, defines the radar output. Here, is the complex conjugate of the excitation signal, and being the dummy variable. Fundamentally, these energy localization approaches utilize matched filtering with pulse compression, which is a traditional radar technique for enhancing the range resolution and signal to-noise ratio (SNR) in a hyperbolic wave field.35The pulsed PT radar is capable of acceptable SNR, while using low enough optical pump intensity to meet the laser safety requirement for maximum permissible exposure (MPE) in biological media. The TC-PCT concept was derived from this pulsed PT radar. Although the physical foundation, implementation, features, and potential applications of TC-PCT have been detailed elsewhere,32 a brief discussion is furnished here. A linear frequency-modulated (LFM) train of short optical pulses () of pulsewidth is used to excite the sample [Fig. 1(a)]. Truncated reference chirps of pulsewidth with continuously variable delay/initial phase (, where , and is the delay step) are synthesized (), and each of these chirps is cross-correlated with the PT image captured by an IR camera (radar pulse compression) to produce 2-D axially resolved layer-by-layer images of the sample. For example, cross-correlation of the PT image chirp () with reference , which is in phase with , will give a surface image of the sample. In the case of , the resulting image will be that of a near-surface (subsurface) thin layer. As the delay increases, the depth of the layer below the surface also increases. Furthermore, the depth resolution or “thinness” of a truncated-correlation image layer will increase as the truncated pulsewidth shortens. Parameters controlling the maximum penetration depth are the starting LFM frequency and the period/length of the chirp. For a given chirp and truncated pulsewidth, the depth range is controlled by the total delay or the maximum value of . According to the theory of TC-PCT based on conductive PT waves, the truncated-correlation (in-phase/quadrature) output is given by32 Fig. 1Signals, algorithm, and instrumentation for TC-PCT. (a) Excitation, photothermal relaxation and typical truncated-correlation chirps (not drawn on the actual time scale); (b) Frequency-domain TC-PCT algorithm implemented in LabView environment. Various modules are fast Fourier transformation (FFT), complex conjugate (), inverse fast Fourier transformation (IFFT), multiplication (), and binary exclusive-OR (EX-OR); (c) Instrumental configuration; and (d) Depth-coded planar images sampled at 20-ms reference-delay intervals, obtained from a goat rib. 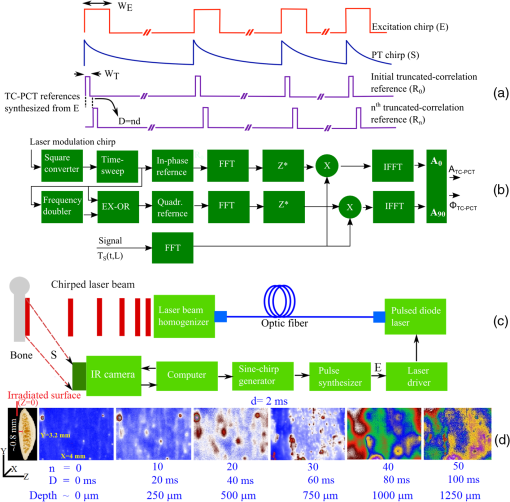 Here, the various parameters are : Starting chirp angular frequency; : Dirac delta function; : Time; : Intensity of the excitation pulse; : Gaussian characteristic time constant defining the reference pulse shape; : Surface reflectivity of the sample at the excitation wavelength; , , , , , and : Sample’s thermal conductivity, thickness, optical absorption coefficient, thermal-wave transmission coefficient at the irradiated surface-air interface, light-to-heat conversion efficiency, and thermal diffusivity, respectively; : An optothermal time constant (), indicating heat conduction from a depth equal to the optical penetration length; and is the sweep rate. and are the ending angular frequency and period of the chirp, respectively. , and is the number of pulses constituting a chirp. erfc refers to the complementary error function, and represents the convolution operation. The absolute TC-PCT amplitude () and phase () can be estimated as and . Furthermore, two additional channels—delay time and zero-crossing phase—have been derived for this tomography. Among these four outputs, the amplitude channel has the key advantage of high-dynamic range and sensitivity based on a one-to-one correspondence with the sample thickness, thus paving the way for a unique depth reconstruction method over about four diffusion lengths. The TC-PCT algorithm has been implemented in the frequency domain for faster execution in LabView environment [Fig. 1(b)]: The recorded excitation chirp is first converted to a square-wave chirp and then passed through the delay-sweep module. The delay-incremented square wave chirp () is then frequency doubled (). Subsequently, and are subjected to the binary exclusive-or (EX-OR) operation to generate a quadrature square chirp . Truncated references and are synthesized from and , respectively. The complex conjugate of the Fourier-transformed truncated references, both in-phase and quadrature, is multiplied with the Fourier transform of the PT chirp, and the products are inverse-Fourier transformed to generate the in-phase and quadrature TC-PCT outputs. As shown in Fig. 1(c), a semiconductor diode laser capable of generating short optical pulses as triggered by a custom-developed pulse synthesizer is the excitation source. The pulse synthesizer is triggered by a programmable sinusoidal LFM chirp generator (Agilent 33220A, Mississauga, Ontario). The laser source is thermally stabilized using a thermoelectric cooler and a temperature controller. The current through the laser diode is controlled by a laser driver. The laser output is delivered through an optical fiber and is intensity homogenized before irradiating the bone sample. An IR camera (Cedip 520M, Burlington, Ontario, 3.6- to spectral response) captures the evolution of laser-induced thermal signatures from the bone surface. The entire system is under the control of a computer, which executes the TC-PCT algorithm as well. For its deep-penetrating capability in tissues, an 808-nm (120 W maximum peak power, quasi-continuous-wave) laser diode (Jenoptic JOLD-120-QPXF-2P, Goeschwitzer, Jena) was chosen for excitation. Unless otherwise specified, an excitation pulsewidth of 10 ms was used in our experiments. The starting and ending frequencies for LFM were 0.2 and 0.6 Hz, respectively, with a chirp period/length of 12 s (henceforth, termed chirp-1 waveform). For 50-W peak power and area of illumination, the pulse chirp energy density33 is . The MPE ceiling for soft tissue is and is even higher for bones.36 The truncated chirp pulsewidth was 2 ms, the minimum value limited by the temporal resolution of our camera. This corresponds to an axial/depth resolution of in bone. It has been observed that the truncated-correlation amplitude offers the highest sensitivity and dynamic range among various output channels and one can generate a sequence of 2-D amplitude images at increasing depths below the surface by incrementing the delay of the reference signal. In Fig. 1(d), a set of such depth-coded planar images (imaged area is ) obtained for a goat rib sample () is shown. The cortical thickness was , and the trabecular network extended down to below the irradiated surface.24 The corresponding truncated-correlation delay increment and the approximate depth below the surface are given for every image. These depth-coded slices can be stacked to form a 3-D amplitude image (amplitude tomogram). Furthermore, the amplitude data can be binarized such that those above and below a threshold can be designated as Boolean “1” and “0,” respectively, to depict the physical presence or absence of thermal-wave power at a point within the sample. This binarized amplitude tomogram is independent of the absolute PT amplitude and has advantages in the structural examination of bones, both demineralized and intact.37 3.Experiment and ResultsIn traditional x-ray tomography, 2-D morphometric parameters of bone are evaluated from binarized cross-sectional images, whereas surface-rendered volume reconstruction is used for the estimation of 3-D parameters.38,39 For both 2-D and 3-D, there exist two types of analysis: (1) All objects in the region of interest (ROI) are analyzed together to yield an integrated output. For example, mean total cross-sectional area, cross-sectional thickness, and centroid in 2-D, and object volume, volume of closed pores, and fragmentation index in 3-D. (2) Discrete objects can be categorized, and separate results are generated for individual classes of objects. For example, object area, form factor, and aspect ratio in 2-D, and object volume, volume of pores, and number of pores in 3-D. In addition to the 3-D TWOI, we introduce a set of morphometric protocols by defining a 2-D parameter, as explained below, to evaluate the performance of TC-PCT as a potential bone diagnostic modality. Subsequently, an analogous set of μCT-estimated x-ray morphometric parameters will be used to validate the 2-D and 3-D TC-PCT markers, assuming the former as the gold standard. Throughout this article, we assume the Bone ASBMR (American Society for Bone and Mineral Research) definitions, units, and symbols for the x-ray morphometric parameters:38,39
In order to formulate TC-PCT morphometric protocols, we made use of the results obtained for a goat rib sample (). This specimen was prepared by keeping Canadian goat ribs immersed in water for about 3 weeks for a complete decomposition of meat and blood. Clean ribs were rinsed with water and dried in sunlight. For artificial demineralization, the sample was dipped in ethylenediaminetetraacetic acid (EDTA) solution, which was prepared by diluting 0.5-M acid with equal volume of distilled water. The TC-PCT was recorded for the intact state and after 0.5-, 1-, 2.5-, 5-, 10-, and 20-h demineralization in EDTA. Figure 2 shows 2-D amplitude images and 3-D binarized stack sequences, both at different depths, as well as absolute amplitude and binarized full tomograms, all for the rib piece before and after 1-h demineralization. Images in Figs. 2(a1–10) and 2(c1–10) are the binarized TC-PCT amplitude slices ( thick), vertically aligned as a function of depth (-coordinate) below the irradiated surface before and after demineralization, respectively. Each slice is formed by stacking and binarizing 12 depth-resolved planar images, each of thickness . Figures 2(b1–10) and 2(d1–10) are the planar images sampled at each 24-ms delay interval before and after demineralization, respectively. They depict the distribution of absolute TC-PCT amplitude in the specified plane. In the figure, BT1 and BT2 are, respectively, the binarized amplitude tomogram for a depth of below the surface for the rib sample before and after demineralization. AT1 and AT2 are the corresponding absolute amplitude tomograms before and after demineralization for the same depth. BT1 and BT2 are generated from AT1 and AT2, respectively, through binarization followed by surface-mesh formation for volume rendering. The imaged area is . The experiment was performed using chirp-1 excitation with peak power. Both truncated-reference pulsewidth and delay-step were 2 ms. Maximum delay applied was 240 ms, which corresponds to a depth of in bone. For the binarized amplitude tomograms (BT1 and BT2), the 3-D morphometric parameter TWOI measures the fractional volume occupied by the photothermally active bone components contained in a cube element (cuboid): where and are the volumes of the photothermally active bone components and the cube element, respectively. Now, we define the mean planar amplitude (MPA): a 2-D parameter for a planar TC-PCT image to measure the PT strength of the layer. This parameter is evaluated as the ratio of the sum of TC-PCT amplitudes to the number of pixels constituting a layer where is the TC-PCT amplitude corresponding to the ’th pixel, and is the number of pixels comprising the planar image.Fig. 2Binarized amplitude segments (a, c) and layer-by-layer planar TC-PCT amplitude images (b, d) obtained for the intact and 1-h demineralized conditions of a goat rib. The 10 binarized sequences, thick each, compose of tomograms BT1 and BT2. The 120 planar sequences, thick each, constitute of the absolute amplitude tomograms AT1 and AT2. Demineralization-induced reduction in the binarized volume can be seen for c1–10 compared with its intact state depicted in a1–10. The mean PT signal for every plane in d1–10 is less than that for its counterpart in b1–10. 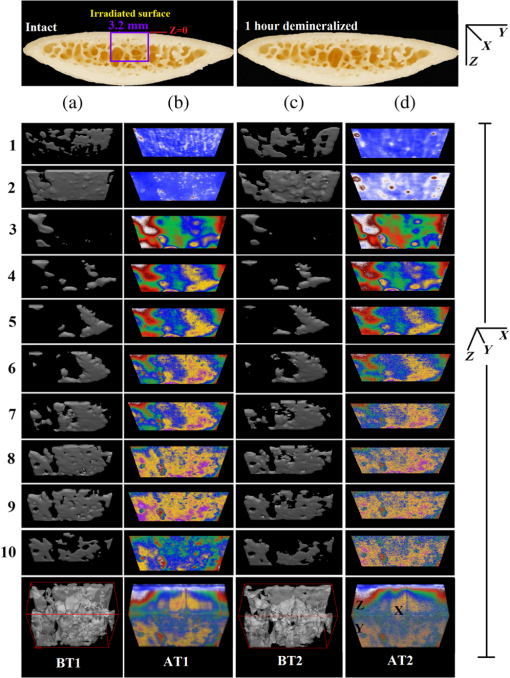 To investigate the potential of these markers for monitoring the degree of demineralization, we considered four goat rib samples, labeled as RB10 to RB13, and demineralized in EDTA solution for 10, 20, 30 and 40 h, respectively. They were subjected to chirp-1 TC-PCT analysis before and after demineralization. The results obtained for MPA before and after demineralization are shown in Fig. 3. A general trend observed in Fig. 3 for MPA is the progressive decrease as the depth below the surface increases. This is attributed to the attenuation of optical intensity with depth in the sample, due to absorption and scattering. In contrast to this steady behavior, there appears an anomalous response near the surface. One potential reason for this is the presence of peripheral contamination and its random reactions with EDTA. In addition, the temporal uncertainty in the camera frame trigger () is likely to cause a lapse in synchronizing the first frame with the start of the thermal relaxation. This may affect the surface/near-surface data contained in the early transient. Another possibility is the thermal confinement near the surface, which tends to raise the mean temperature in the very near subsurface region. Possible mechanisms responsible for the changes in MPA following demineralization are presented in Sec. 4. Figure 4 shows the variation of TWOI with the duration of demineralization for cortical and trabecular regions independently and together. Four ROIs () were selected randomly on the sample surface for averaging. For individual analysis, the cortical and trabecular regions were reconstructed separately by suitably selecting the number of depth-resolved planar images, and the ratio of sequences being determined by visually examining the onset of the trabecular signature. The common trend observed is that the TWOI follows an inverse correlation with demineralization time for 10 and 20 h. For very high demineralization (30 and 40 h), the response is unpredictable. The significance of these trends and the mechanisms responsible for them will be considered in detail in Sec. 4. In Figs. 5(a)–5(c), binarized amplitude tomograms of intact goat rib sample RB10 are shown. They were used for TWOI estimation and were reconstructed individually and together for cortical and trabecular regions. The corresponding absolute TC-PCT amplitude tomograms are shown in Figs. 5(d)–5(f). In Figs. 5(a) and 5(d), corresponds to the irradiated cortical surface. These samples were further analyzed using a scanner (Skyscan 1173, Bruker, Kontich, Brussels) over the same ROI before and after demineralization. Fig. 3Variation of MPA with depth below the irradiated sample surface before and after demineralization for 10, 20, 30, and 40 h. For low-demineralization levels, usually up to 10 to 20 h for a goat rib in 50% EDTA solution, the PT signal decreases with the time of acid treatment. For longer durations, the response is unpredictable due to the trabecular collapse and bone volume compression, especially along the thickness. 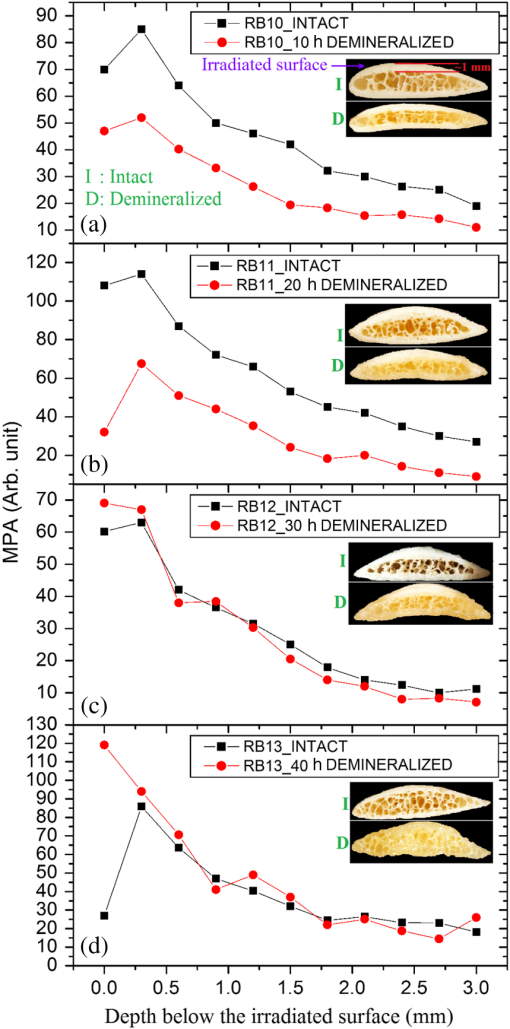 Fig. 4Variation of TWOI with duration of demineralization estimated separately (a and b) and together (c) for the cortical and trabecular regions. As in the case of MPA variations, the TWOI response maintains a negative correlation with the degree of mineral loss for low-demineralization levels. It becomes erratic for very strong mineral loss. The decrease in the absorption and scattering coefficients with demineralization is the main reason for the fall in TWOI for 10- and 20-h samples. For chirp-1 excitation, uncertainty in the estimation of TWOI is . 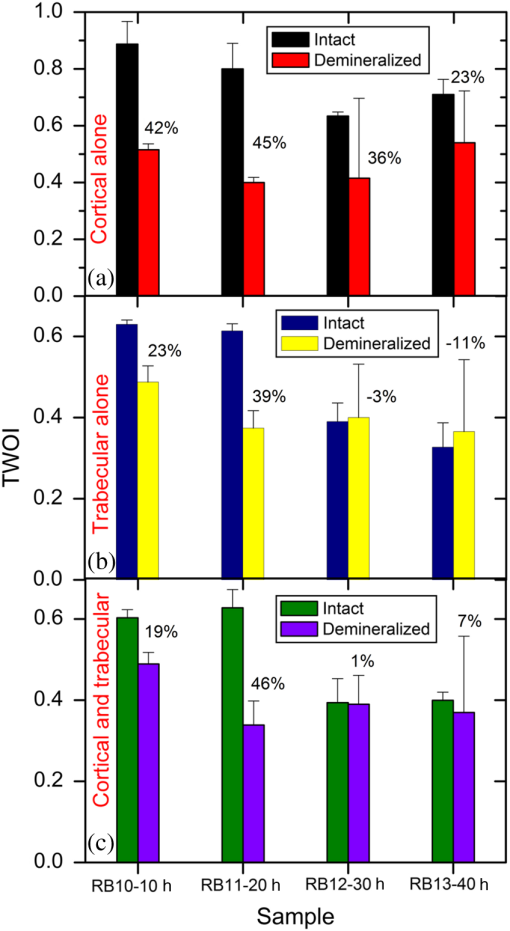 Fig. 5Binarized amplitude TC-PCT images (a–c) and absolute amplitude tomograms (d–f) for the intact sample RB10. (a and d) Cortical alone; (b and e) Trabecular alone; and (c and f) Cortical-trabecular combined. Imaged area is and depth is . For tomograms (a, d, c, and f), the plane coincides with the irradiated cortical surface. For images (b and e), lies on the cortical-trabecular interface. Tomogram in (c) is the view from the trabecular bottom toward the irradiated cortical layer, which can be used to assess the resolution of TC-PCT. Geometric measurements show that the trabeculae thinner than 100 μm have been resolved. 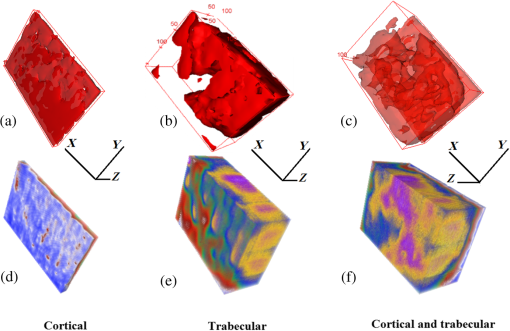 Since parameters follow well-established correspondence with the extent of mineral loss, their primary role in this study is to understand the dependence of TC-PCT markers on the demineralization process. Although TC-PCT is at a very early stage of development compared with , the tandem investigations using these complementary modalities are helpful to establish clear distinctions between their strengths and weaknesses in the context of tracking demineralization. A parallel investigation using TC-PCT and was carried out for a broad range of mineral loss (up to 40 h in EDTA, as already mentioned) that is much larger than the natural range observed in osteoporotic cases. However, the number of samples was restricted to four (10-, 20-, 30-, and 40-h demineralization) due to the limited availability of the analyzer during this work. For this reason, an assessment of the absolute sensitivity of the two methods was not carried out. All the samples were subjected to TC-PCT (Toronto) and then (San Antonio) analysis in their intact state. They were then demineralized in separate containers such that sample 1 (RB10), sample 2 (RB11), sample 3 (RB12), and sample 4 (RB13) remained in EDTA for 10, 20, 30, and 40 h, respectively. TC-PCT and were recorded for the demineralized samples also. The ideal approach would have been to demineralize a sample sequentially (say, for ) and to record its TC-PCT and after each demineralization stage, but that was not possible due to the physical distance of the two facilities. A statistical analysis on the behavior of a set of such sequentially demineralized samples could have led to a more detailed understanding of the interplay among various bone parameters responsible for the observed signal variations. Leaving this as a future initiative, a large set of 2-D and 3-D x-ray morphometric parameters of samples RB10 to RB13 was estimated for cortical and trabecular regions separately and together as the reference markers for validating the TC-PCT results. Boundaries for different ROIs were selected as shown in Figs. 6(a)–6(c): for purely cortical region, the irradiated surface and cortical-trabecular interface were the boundaries (a). Cortical-trabecular (upper) and trabecular-cortical (lower) interfaces defined the periphery for purely trabecular analysis (b). Irradiated cortical surface and lower trabecular-cortical interface formed the border for combined cortical-trabecular measurements (c). In all cases, regions with bluish highlight are the bone voxels of interest, and the red-filled spaces are nonbone voxels (air) excluded from measurements. In Fig. 7, the pre- and post-demineralized images of slices normal to the bone thickness (a1–d1 and a3–d3) and along the length (a2–d2 and a4–d4) are shown. With the decrease in mineral content, the image contrast falls as x-ray attenuation in the organic phase is much lower than that in the mineral phase. Fig. 6Region of interest (ROI) boundary selection for analysis. Regions with bluish highlight are the bone voxels of interest, and the red-filled spaces are nonbone voxels (air) excluded from the measurements. (a) For purely cortical region, the irradiated surface and cortical-trabecular interface were the boundaries. (b) Cortical-trabecular (upper) and trabecular-cortical (lower) interfaces defined the periphery for purely trabecular analysis. (c) Irradiated cortical surface and lower trabecular-cortical interface formed the border for combined cortical-trabecular measurements. 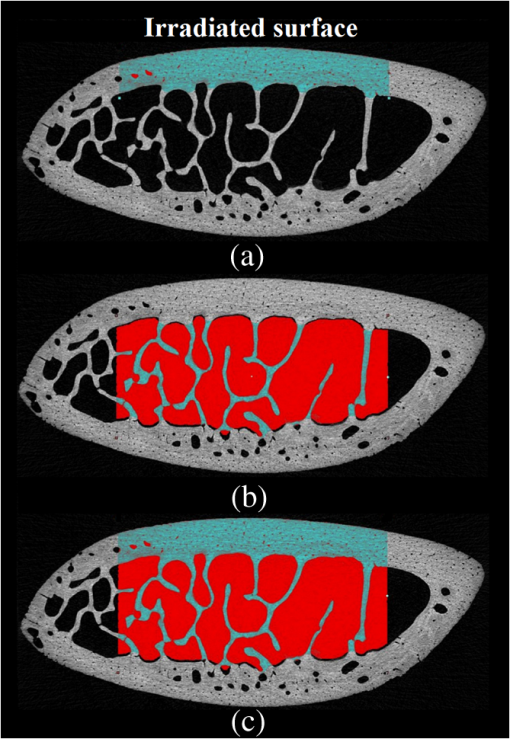 Fig. 7Planar images of samples RB10to RB13 before and after demineralization: (a1–d1and a3–d3) Plane normal to the bone thickness before and after demineralization, respectively. (a2–d2 and a4–d4) Plane along the length for the intact and demineralized conditions, respectively. Even for demineralization time as low as 10 h, considerable mineral loss occurred at the trabecular region. This has greatly reduced the trabecular contrast in post-demineralized images. It can also be seen that very little contrast change occurs for this region, as one moves through a3–b3–c3 or a4–b4–c4. Perceptible trabecular mineral traces exist in d3 and d4. This can be either due to the natural immunity of this sample to demineralization or weak EDTA penetration into the trabecular network. However, this mineral residue does not make any significant change to the general demineralization response of the trabeculae. 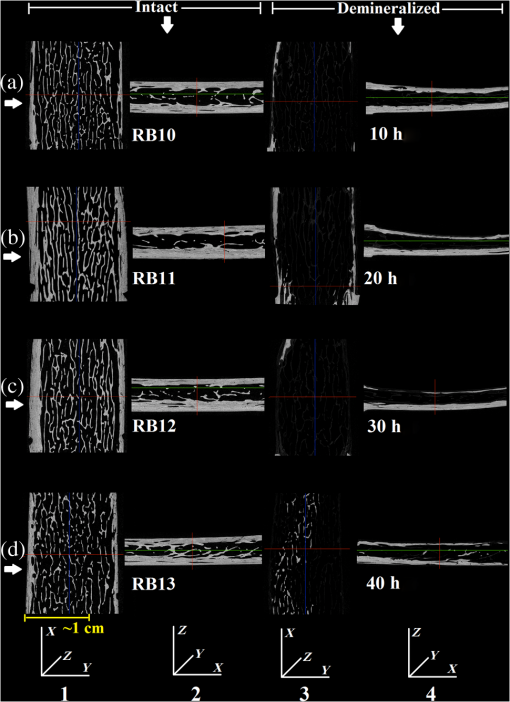 In Fig. 8, pairs of typical 2-D and 3-D parameters are depicted for separate and combined cortical and trabecular regions. In general, these parameters maintain an inverse correlation with the degree of demineralization time up to 30 h. However, an increase compared with the result for 30-h is observed for the 40-h sample. Due to a failure in protocol, a pair of trabecular thickness (Tb.Th) data (20 and 30 h) is missing. Fig. 8Various 2-D and 3-D morphometric parameters (left and right columns, respectively) estimated for the rib bones, RB10–13, before and after demineralization. These parameters were evaluated separately and together for the cortical and trabecular regions. Since estimates the absolute value of these parameters, their variation with demineralization time can be used to validate the potential of TC-PCT markers for monitoring mineral loss (see text for details). The uncertainty in the measurement of all parameters is . 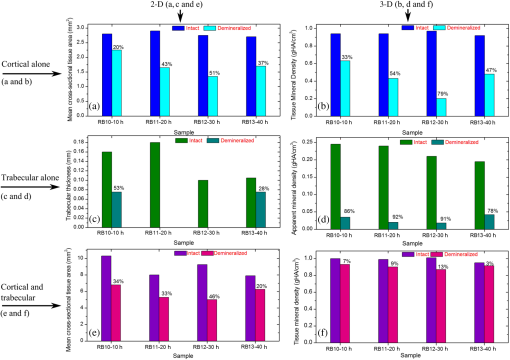 4.Discussion4.1.Hypothetical Dependence of TC-PCT Amplitude on Artificial DemineralizationFor a methodical understanding of the TC-PCT sensitivity to demineralization, it is worth to evoke here the PT response, , (assuming one-dimesional heat diffusion) of a homogeneous scattering medium subjected to pulsed optical excitation followed by radiometric detection40 Here, , , , and are the optical absorption coefficient at the excitation wavelength, IR absorption coefficient, transport coefficient, and effective attenuation coefficient , respectively, of the medium. , where erfc refers to the complementary error function. Constants A, B, and C are accounted in Ref. 40. Although bone is a highly heterogeneous medium, the general features of its PT response can be derived from Eq. (6). All or most of the parameters appearing in this equation vary due to the demineralization with more or less sensitivity, and one can expect corresponding changes in the PT signal as follows:
Hence, the PT signal strength for a specific demineralization level is dependent on the complex interplay of these mechanisms with variable relative contributions. 4.2.Significance of -Validation of TC-PCTThe prime criticism of x-ray-based skeletal diagnostic techniques is their ionizing nature that forbids prolonged exposure for monitoring bone conditions and their low sensitivity (contrast) for the early detection of mineral loss. Besides the general clinical uses, a challenging area in which bone strength monitoring is a main concern is the case of space flights under microgravity conditions, as disuse OP puts astronauts at a higher risk of fracture on return to Earth.43 In this situation, portable as well as nonionizing methods suitable for continuous/frequent bone strength monitoring are desirable. Although techniques like mechanical response tissue analysis and quantitative ultrasound imaging are nonionizing, their reliability and reproducibility are still in question, especially for early detection applications.21,44 The primary goal of the present investigations is to demonstrate a nonionizing (hybrid-optical) technique, equivalent of x-ray-based ionizing techniques (say, ) for 3-D structural/functional imaging and mineral loss tracing in bones, and thus to accelerate the search for alternate technologies for the early diagnosis of disuse as well as natural OP. None among the existing purely or hybrid-optical modalities is capable of resolving the trabecular structure through the cortical layer in 3-D over a depth range of practical interest. TC-PCT has this remarkable advantage. The potential for tracing mineral loss in a depth-resolved manner is a highly desired feature for a modality to establish itself as a promising tool for OP diagnosis. The fact that mineral loss occurs mainly in the trabecular region during the early stage of OP further corroborates this demand of depth-resolved BMD monitoring ability. Unfortunately, to the best of our knowledge, no report exists on the variation of the PT signal with mineral loss at various depths in bones. However, based on the observed variations of bone optical parameters, specifically absorption and scattering coefficients, with the extent of mineral loss and assumptions on the changes in physical density (Sec. 4.1), one may expect some changes in the TC-PCT signal with varying mineral contents. Undoubtedly, there should exist a one-to-one correspondence between the mineral density and the TC-PCT marker/markers to support the technique’s OP diagnostics advantage. An investigation restricted to the analysis of MPA and TWOI variations with demineralization time alone cannot lead to meaningful results to justify their mineral loss monitoring capabilities. This is because many of the bone parameters that are likely to alter the PT response may change with EDTA treatment time. Therefore, in tandem with TC-PCT, we also carried out analysis for the intact and demineralized samples as a function of demineralization time. Since can yield absolute estimates of various bone parameters, including BMD, in a depth-resolved manner, the trend/correlation observed here could be used to assess the potential of TC-PCT markers for mineral loss monitoring at various depths. Since demineralization-induced composite parametric variations will be manifested in the distribution of thermal-wave field, a measure of the volume occupied by the thermal-wave content should be indicative of the mineral density distribution within the bone sample. Based on this fact, for the morphometric analysis using TC-PCT, we reported the 3-D marker, TWOI, and its potential to track the mineral loss in goat rib bones induced by low-demineralization levels. Furthermore, this marker was found to be independent of the excitation and truncated-correlation pulse parameters, a property that ensures its absolute nature.45 4.3.Demineralization Dependency of and TC-PCT ParametersThe ideal procedure for understanding the morphometric variations with mineral loss is to sequentially demineralize a sample by incrementing the time of EDTA treatment and to record its TC-PCT and after each treatment. As already mentioned (Sec. 3), due to the physical distance between these facilities, we considered only four samples with different EDTA treatment times (10, 20, 30, and 40 h) and their independent analysis. It was intentional to select a broad range of this kind (intact to 40 h) with a reasonably long separation (10 h): due to the highly inhomogeneous nature, bone properties (mineral distribution, trabecular dimensions, cortical thickness, surface area, density, etc.) may vary from sample to sample even if they belong to the same rib. So, if a shorter range (say, 1, 2, 3, and 4 h) of demineralization is considered, then the resulting changes for consecutive demineralization times need not remain resolvable always, i.e., overlap may occur. For the logical analysis of the demineralization dependency of various parameters (both TC-PCT and ) based on this multiple sample approach, a normalization process has been carried out for every parameter by defining a fractional change for the intact and demineralized states: 4.3.1.Demineralization dependency of 2-D parameters: T.Ar, Tb.Th, and MPAThe T.Ar is the mean of the cross-sectional area for all slices in the selected volume of interest. The ROI periphery assumed here is the outer boundary of the object, without including any internal spaces or structure in the measurement. For the goat rib sample, the outer surface and the cortical-trabecular interface are considered as the ROI periphery for evaluating the cortical T.Ar [Fig. 6(a)]. Any pores or inclusions within the cortical slab will be discarded. In general, the cortical T.Ar reduces on demineralization, as shown in Fig. 8(a). Up to 30 h, the decrease in this parameter follows a positive correlation with the demineralization time. This trend is natural as the removal of mineral would reduce the volume of bone material, and all non-bone voxels including newly created voids at the locations of mineral loss are excluded from T.Ar estimation. This in turn reduces the cross-sectional area. But as one moves from the 30- to 40-h sample, the fractional change in this parameter decreases from 0.51 to 0.37. Corresponding images, Figs. (7c2 and c4 and d2 and d4, respectively), support this measurement as the top cortical thickness in Fig. 7(d4) appears as a larger fraction of its intact state compared with Fig. 7(c4). This can be due to the higher biochemical immunity of the 40-h sample to demineralization compared with its 10-, 20-, and 30-h counterparts. Another possibility is the severe trabecular collapse on 40-h EDTA treatment. In this case, thin trabecular whiskers collapsing on volume compression following very long demineralization may remain crowded near the cortical-trabecular interface. This is likely to happen since compression occurs predominantly along the bone thickness. Obvious increase in the -estimated cortical thickness and hence T.Ar is thus possible. A nearly comparable behavior also is observed for the combined cortical-trabecular T.Ar [Fig. 8(e)]. Unlike cortical-alone results, T.Ar does not differ substantially for 10- and 20-h demineralizations. For 30- and 40-h samples, the response is similar to that of the cortical T.Ar. For a better understanding of the trabecular T.Ar response, we analyzed the Tb.Th, another trabecular 2-D parameter [Fig. 8(c)]. The estimation of this parameter for 20- and 30-h EDTA treatments was not possible due to a failure in the protocol. Similar breakdown was observed for other cortical 2-D parameters like trabecular number and trabecular separation (not accounted in this article). This kind of protocol failure may arise while analyzing samples of broad BMD variations, since the definitions made for locating the ROI periphery may not be equally valid for low- and high-demineralization levels. These results lead to a conclusion that the 2-D parameters need not always yield reliable morphometric information, especially for the trabecular region, if the demineralization range is broad enough to cause the protocol malfunction. Hence, a truthful validation of the 2-D TC-PCT parameter (MPA) response may not be possible using 2-D parameters if the range of demineralization is very broad. As a consequence of optical attenuation resulting from absorption and scattering in bone, the MPA decays with the depth below the irradiated cortical surface for all demineralization conditions, as seen in Fig. 3. In Figs. 9(a)–9(c), the mean MPAs estimated using the data constituting Fig. 3 for the prominently cortical (0.3 to 1.2 mm), purely trabecular (1.2 to 3 mm), and combined cortical-trabecular (0.3 to 3 mm) regions have been shown for the intact and demineralized conditions of all four samples. Owing to uncertainty mentioned in Sec. 3, near-surface (0 to 0.3 mm) data have been omitted in all cases. For all three regions, the post-demineralized MPA maintains an inverse correlation [positive correlation for ] with mineral loss for 10- and 20-h samples. This feature can be attributed to the fall in absorption and scattering coefficients with the degree of mineral loss. Another possibility is the increase in bone thermal diffusivity due to the decrease in density on mineral loss. Since diffusivity is a measure of the rate of heat flow/removal from the point of generation, it would be reasonable to assume that a drop in PT amplitude is possible with the loss in density. Since the exact variations of specific heat capacity and thermal conductivity with demineralization are not known, the role of diffusivity and volumetric specific heat cannot be precisely interpreted at this stage. For the prominently cortical region, the post-demineralization MPA exceeds its intact value by about 1% and 7%, respectively, for the 30- and 40-h samples. Since absorption and scattering coefficients keep on decreasing with mineral loss, thus reducing the TC-PCT amplitude and hence MPA, it is logical to assume that one or more mechanisms capable of boosting PT signal compensating the influence of falling optical coefficients come into play for very high demineralization levels. Both the PT amplitude [Eq. (6)] and diffusivity follow an inverse correlation with , the volumetric specific heat capacity. If there exists a decrease in thermal conductivity with mineral loss at a rate larger than the rate of descend in volumetric specific heat, then a strong signal enhancement may occur. The possibility of such a substantial reduction in thermal conductivity can be justified using the void fraction hypothesis described in Sec. 3: excessive removal of bone material on prolonged demineralization may enlarge the void fraction within both the cortical and trabecular regions. Given the poor thermal conductivity of air (assuming that the pores are air filled), the increased void volume may have impeded the conductive loss rate, thereby sustaining a stronger thermal-wave field within the cortical layer and trabecular network. Generally, in all three cases (cortical and trabecular regions independently and together), follows comparable variations with the time of EDTA treatment. The highest impact of demineralization, as estimated by , is on the purely trabecular section and the lowest on the prominently cortical segment. This is possible, since, for a given bone volume, the trabecular region maintains a larger contact area with EDTA compared with the cortical layer. Fig. 9Mean MPAs, estimated using the data constituting Fig. 3, for the prominently cortical (a), purely trabecular (b) and combined cortical-trabecular (c) regions. Near-surface (0 to 0.3 mm) data have been omitted in all cases due to the uncertainties arising from synchronization issues, surface contamination, and near-surface thermal confinement, which is randomly influenced by the ambient air currents. For all three regions, the post-demineralized MPA maintains an inverse correlation with mineral loss for 10- and 20-h samples, the same trend observed for TWOI (Fig. 4). Uncertainty in the estimation of MPA is for chirp-1 excitation. 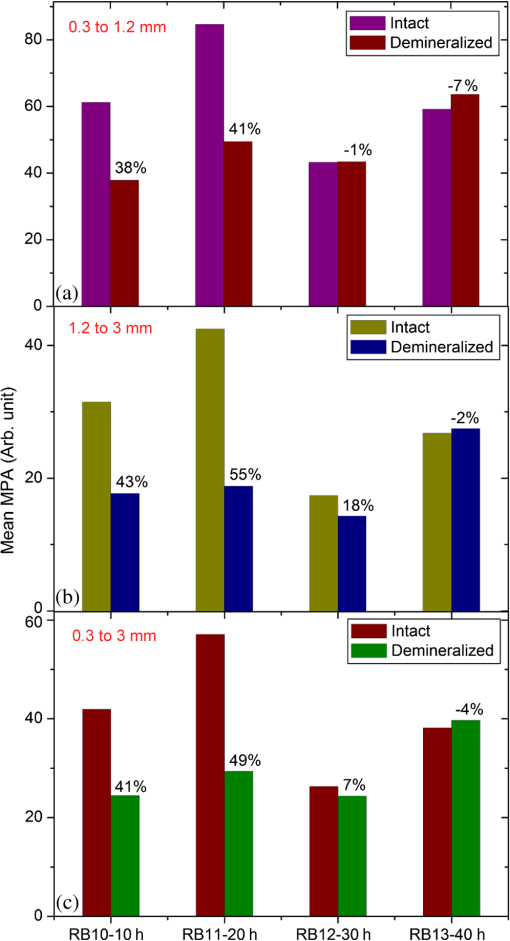 4.3.2.Demineralization dependency of 3-D parameters: TMD, BMD, and TWOIBy definition, TMD is calculated from the average x-ray attenuation in the bone tissue only without including the contributions of nonbone voxels like biofluids and soft tissue. On the other hand, BMD estimation accounts for the collective attenuation offered by both the bone and nonbone voxels.38,39,46 Since our rib bone samples are deprived of nonbone bioconstituents, both TMD and BMD estimate the attenuation by bone component only. The TMD estimation is considered for the purely cortical and combined cortical-trabecular sections because of the dominance of bone volume fraction over the air volume fraction. The TMD, as shown in Fig. 8(b), trails a monotonic increase for its fractional change with demineralization time up to 30 h. For the 40-h sample, makes a significant drop (47%) from its value for 30-h demineralization (79%). A monotonic increase in the fractional change or up to 30-h and then a decrease for 40-h demineralization are a characteristic feature of all three sections. The continuing increase in (TMD and BMD) for samples RB10 to RB12 is an immediate consequence of the fall in mineral content with EDTA treatment time. However, for RB13, very high demineralization may lead to significant bone volume compression. This can result in a higher value for the estimated mineral density compared with what is expected under a volume conserved demineralization process. The 3-D TC-PCT marker, TWOI, yields a marginally increased value between 10 and 20 h [Fig. 4(a)]. For 30 h, the trend is toward a decrease but with high uncertainty, which is also true for 40 h. For purely trabecular and cortical-trabecular combination, similar responses are observed for TWOI [Figs. 4(b) and 4(c)]. As in the case of MPA, the justifications based on the reduction in optical absorption and scattering coefficients with mineral loss are applicable here also for the 10- and 20-h samples. For 30- and 40-h EDTA treatment, the void fraction increase and resulting fall in thermal conductivity should be responsible for reversing the trend. 4.4.Relative Sensitivity of and TC-PCT ParametersFor both and TC-PCT, there exists a common characteristic: in the case of all parameters, the variation of with demineralization time follows a change in direction at a stage that is early for TC-PCT compared with . Due to the highly inhomogeneous nature of bones, this change-over time should vary from sample to sample and be dependent on the demineralization conditions. Since naturally occurring mineral loss may not be as high as what was observed for very long EDTA treatment (say, 30 to 40 h), we confine our major interest to the first two responses as far as OP diagnosis is considered as the prime target. The broad range variation will be significant while developing the general purpose TC-PCT protocols and allied calibration procedures. Assessment of the relative sensitivity of various parameters to the changes in cortical and trabecular sections, independently and together, is important prior to arriving at vital conclusions of this investigation. For this, we assumed the 10-h value as the baseline/offset, for all parameters, and made it “0.” Such a baseline subtraction, although not strictly accurate to scale a nonlinear response, is helpful to judge the relative capability of different parameters to trace the effects of EDTA treatment. The offset-corrected parameters are plotted against respective demoralization time in Figs. 10(a)–10(c). For sensitivity comparison, we consider 10- and 20-h demineralized samples, the practically interesting cases. For the prominently cortical layer, parameters are more sensitive than TC-PCT markers. Since a clear idea is not yet available on the variation of different thermophysical parameters (especially, specific heat capacity and thermal conductivity) with cortical demineralization, no vital conclusion can be made on the inferior TC-PCT sensitivity to cortical mineral loss. For purely trabecular and cortical-trabecular combination, TC-PCT offers better sensitivity than . One can see in Fig. 7 that the trabecular contrast is very low even for the least demineralized sample (RB10) and very little contrast change is observable as one moves to higher levels of mineral loss (RB11 to RB13) for this porous region. X-ray attenuation is mainly due to the mineral phase, most of which are removed during the 10-h demineralization itself. Also, one can see that the absolute trabecular mineral density is much smaller than the cortical value for all samples [Figs. 8(b) and 8(d)]. The poor sensitivity to trabecular mineral loss is a dynamic range limitation, in which the large changes in cortical mineral content override minor trabecular changes. Unlike μCT, the TC-PCT sensitivity to changes in both mineral and organic phases is a benefit in the case of trabecular analysis. Since osteoporotic demineralization first occurs at the trabecular region, the enhanced trabecular sensitivity of TC-PCT is a remarkable advantage in the early detection scenario. For a better picture on the dynamic range features of these modalities, we analyzed the binarized amplitude TC-PCT and images of the 20-h treated rib before and after demineralization (Fig. 11). The tomogram is a view from below, i.e., from the trabecular surface toward the cortical layer. It can be seen that the TC-PCT offers much better dynamic range which allows the trabecular structure of the demineralized sample to be clearly visible along with the cortical portion, justifying our previous argument. Fig. 10Sensitivity of various and TC-PCT parameters to (a) purely cortical, (b) purely trabecular, and (c) combined cortical–trabecular demineralizations. Assuming as the baseline/offset, the 10-h value was subtracted from corresponding higher demineralization values for all four regions; a coarse calibration procedure. For purely trabecular and combined cortical-trabecular regions, TC-PCT offers better sensitivity than . For the cortical-dominant region, is more sensitive. Since osteoporotic demineralization first occurs at the trabecular region, the enhanced trabecular sensitivity of TC-PCT is a remarkable advantage in the early detection scenario. Trabecular (T.Ar) values have been discarded due to a failure in the measurement protocol. The legend is common for all three plots. 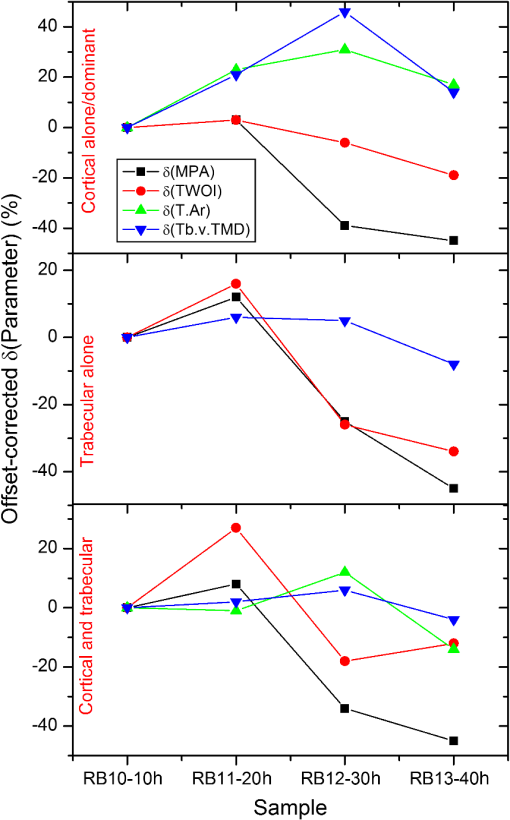 Fig. 11Binarized amplitude TC-PCT and images of the goat rib sample before and after demineralization. images of the whole sample ( long) are shown in the central column. The ROI for TC-PCT () is outlined in green color. The TC-PCT image and zoomed-in version of image corresponding to the ROI are shown in the left and right columns, respectively. Due to the high-dynamic range advantage of TC-PCT, both cortical and trabecular regions are resolved with high contrast for the post-demineralized sample. 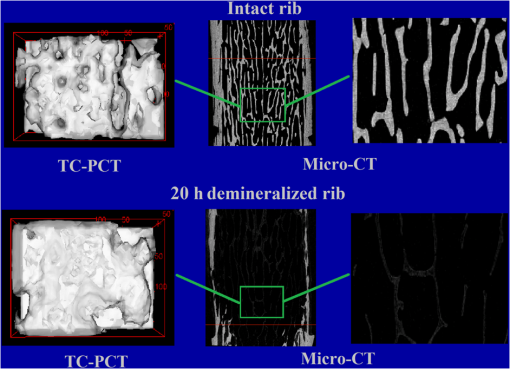 X-ray based methods measure the absorption/attenuation of photons (mostly) by the mineral content in bones, and tomographic reconstruction is done using back-projected planar images. Since scattering and diffraction effects are negligible for bone x-rays, a well-defined structural imaging is possible. In the case of TC-PCT, depth-coded planar images primarily depict the (photo)thermal-wave distribution associated with optical absorbers. Not only the absorber distribution, but also the spatial variation of thermophysical parameters (e.g., density, effusivity, etc.) influences the thermal-wave distribution within and around an object. This means that the TC-PCT generates a functional image of the thermo-optical features of the sample. If the separation between adjacent objects (say, trabeculae) is large enough to be axially depth-resolved locally without overlapping thermal-wave contributions from other depths, then structural imaging is possible with TC-PCT on a spatial resolution scale of the thermal wavelength. Since the thermal diffusion length is inversely correlated with the square root of frequency, higher resolution for improved structural imaging would be possible at higher frequencies that demand shorter excitation pulsewidth. However, this will limit the depth range. With chirp-1 excitation, the lateral resolution observed in bone is . 4.5.Future ResearchA key issue to be addressed in the immediate future is the enhancement of TC-PCT depth range to cope with the needs of small animal bone diagnostics and subsequent human trials. The use of a more sensitive camera, longer chirp periods, and higher laser peak powers could improve the depth profiling capability in bare bones. Suitable contrast agents are expected to offer the substantial bone-specific sensitivity enhancement in the presence of skin and soft tissue overlayers. Yet another proposal is the use of focused pulsed-ultrasound (burst) chirp as a heating source of controllable penetration depth and exposure area (e.g., power-limited high-intensity focused ultrasound), still using IR photonic imaging, thus leading to the development of truncated-correlation acousto-thermal coherence tomography that is free from optical scattering effects. Air-coupled excitation will be preferred in this case, as the introduction of water for high-frequency coupling is likely to block the significant amount of IR energy from reaching the camera. The dependence of many of the opto-thermal parameters of bone on mineral loss, both natural and artificial, still remains unknown. This has critically hindered the understanding and interpretation of different observations made in the TC-PCT response of bones. A systematic investigation is needed in this direction to measure the thermal diffusivity and conductivity, specific heat capacity, optical (visible and IR) absorption and scattering spectra, etc. of various type of bones (human and animals) subjected to known demineralization levels. This will lead to an extra benefit to identify the parameter that is most sensitive to bone conditions. A parameter-specific TC-PCT may give better visualization of bone conditions in the diagnostic perspective. Also, the statistical distribution of these parameters for different samples of the same species need be recorded. Multispectral excitation and detection may be incorporated in later stages. This will have potential impact on the capabilities of TC-PCT for studying collagen quality, crystallinity, and mineral-to-matrix and carbonate-to-phosphate ratios, etc. Another challenge that this modality is expected to address effectively is the detection of early bone metastases that leave very subtle signature in traditional radiological methods. A high-resolution variant of TC-PCT (TC-PCT microscopy) will be needed for individual trabecular analysis. Furthermore, an optimum binarization method to improve the accuracy of binarized volume tomogram reconstruction and a faster TC-PCT execution algorithm are planned developments in the computing aspect. 5.ConclusionsThe current investigation has been focused on the nonionizing functional imaging and diagnosis of artificial demineralization in animal bones. Specific attention has been paid for resolving the trabecular structure through the cortical layer, quantifying the extent of mineral loss using the recently introduced TC-PCT technique, and validating the results using imaging. The TC-PCT computational slicing advantage has enabled the independent analysis of cortical and trabecular regions and the comparison of these results with the respective images. Analogous to x-ray morphometric parameters, a 3-D marker (TWOI) and a new 2-D parameter (MPA), both derived from the TC-PCT output, have been defined and estimated for goat rib bones demineralized at intervals of 10 to 40 h using EDTA solution. For shorter intervals, 10 and 20 h, both TC-PCT and markers follow the same trend. This is consistent with our previous report,45 which investigated the early mineral loss detection capability of TC-PCT. For higher extent of demineralization, 30 and 40 h, both the and TC-PCT results show anomalous behavior. This is not a matter of prime concern, since such severe demineralization is unlikely to occur naturally in living bones. A direct comparison of tomograms derived using TC-PCT and has revealed the superior dynamic range of the former. As a consequence, TC-PCT offers better sensitivity to trabecular and combined cortical-trabecular demineralizations compared with . However, comparison of TC-PCT with other modalities with respect to the structural imaging must be made carefully: depending on the resolution of the IR camera, distribution of thermophysical properties of the sample, and the frequency bandwidth of the TC-PCT image, there will be a limit on the possible lateral resolution ( at present) for a given threshold of binary TC-PCT reconstruction. This limit clearly characterizes the conditions under which purely structural imaging is possible for bone using this modality. As far as the application of TC-PCT for in vivo bone diagnosis is concerned, an immediate possibility is the case of femur (or similar bones) of small animals, like mice, for which the soft tissue overlayer thickness is not large (1 to 2 mm). AcknowledgmentsThe authors thank Mr. James Schmitz of the Daniel W. Carlisle Center for Bone and Mineral Imaging, University of Texas Health Science Centre, San Antonio, for his help with the micro-CT protocols and morphometric parameters. Valuable consultations with Dr. Tom Willett, Division of Orthopaedic Surgery, University of Toronto and Dr. Marc Grynpas, Samuel Lunenfeld Research Institute, Mount Sinai Hospital, Toronto are gratefully acknowledged. A.M. is grateful to the Canada Council Killam Research Fellowships Program for a Fellowship award, which made this research possible. A.M. and S.K. further acknowledge the support of the Ontario Ministry of Research and Innovation (MRI) for the 2007 (inaugural) Discovery Award in Science and Engineering to A.M.; the Canada Research Chairs Programs; the Federal and Provincial Governments for a CFI-ORF award; and the Natural Sciences and Engineering Research Council of Canada for several Discovery Grants. ReferencesL. V. Wang, Biomedical Optics: Principles and Imaging, John Wiley, Hoboken, NJ
(2007). Google Scholar
J. G. FujimotoD. L. Farkas, Biomedical Optical Imaging, Oxford University Press, New York
(2009). Google Scholar
D. Huanget al.,
“Optical coherence tomography,”
Science, 254 1178
–1181
(1991). http://dx.doi.org/10.1126/science.1957169 SCIEAS 0036-8075 Google Scholar
A. M. Zysket al.,
“Optical coherence tomography: a review of clinical development from bench to bedside,”
J. Biomed. Opt., 12
(5), 051403
(2007). http://dx.doi.org/10.1117/1.2793736 JBOPFO 1083-3668 Google Scholar
A. P. GibsonJ. C. HebdenS. R. Arridge,
“Recent advances in diffuse optical imaging,”
Phys. Med. Biol., 50
(4), R1
–R43
(2005). http://dx.doi.org/10.1088/0031-9155/50/4/R01 PHMBA7 0031-9155 Google Scholar
T. Durduranet al.,
“Diffuse optics for tissue monitoring and tomography,”
Rep. Prog. Phys., 73
(7), 076701
(2010). http://dx.doi.org/10.1088/0034-4885/73/7/076701 RPPHAG 0034-4885 Google Scholar
F. Leblondet al.,
“Pre-clinical whole-body fluorescence imaging: review of instruments, methods and applications,”
J. Photochem. Photobiol. B, 98
(1), 77
–94
(2010). http://dx.doi.org/10.1016/j.jphotobiol.2009.11.007 JPPBEG 1011-1344 Google Scholar
X. Gaoet al.,
“In vivo cancer targeting and imaging with semiconductor quantum dots,”
Nat. Biotechnol., 22 969
–976
(2004). http://dx.doi.org/10.1038/nbt994 NABIF9 1087-0156 Google Scholar
A. S. Hakaet al.,
“Diagnosing breast cancer by using Raman spectroscopy,”
Proc. Natl. Acad. Sci. U. S. A., 102
(35), 12371
–12376
(2005). http://dx.doi.org/10.1073/pnas.0501390102 PNASA6 0027-8424 Google Scholar
M. WolfM. FerrariV. Quaresima,
“Progress of near-infrared spectroscopy and topography for brain and muscle clinical applications,”
J. Biomed. Opt., 12
(6), 062104
(2007). http://dx.doi.org/10.1117/1.2804899 JBOPFO 1083-3668 Google Scholar
S. K. Nadkarniet al.,
“Evaluation of collagen in atherosclerotic plaques: the use of two coherent laser-based imaging methods,”
Lasers Med. Sci., 24
(3), 439
–45
(2009). http://dx.doi.org/10.1007/s10103-007-0535-x LMSCEZ 1435-604X Google Scholar
X. Wanget al.,
“Noninvasive laser-induced photoacoustic tomography for structural and functional in vivo imaging of the brain,”
Nat. Biotechnol., 21 803
–806
(2003). http://dx.doi.org/10.1038/nbt839 NABIF9 1087-0156 Google Scholar
M. XuL. V. Wang,
“Photoacoustic imaging in biomedicine,”
Rev. Sci. Instrum., 77 041101
(2006). http://dx.doi.org/10.1063/1.2195024 RSINAK 0034-6748 Google Scholar
H. F. Zhanget al.,
“Functional photoacoustic microscopy for high-resolution and noninvasive in vivo imaging,”
Nat. Biotechnol., 24 848
–851
(2006). http://dx.doi.org/10.1038/nbt1220 NABIF9 1087-0156 Google Scholar
L. V. Wang,
“Multiscale photoacoustic microscopy and computed tomography,”
Nat. Photonics, 3 503
–509
(2009). http://dx.doi.org/10.1038/nphoton.2009.157 1749-4885 Google Scholar
C. Zhanget al.,
“Reflection-mode submicron-resolution in vivo photoacoustic microscopy,”
J. Biomed. Opt., 17
(2), 020501
(2012). http://dx.doi.org/10.1117/1.JBO.17.2.020501 JBOPFO 1083-3668 Google Scholar
P. LaiX. XuL. V. Wang,
“Ultrasound-modulated optical tomography at new depth,”
J. Biomed. Opt., 17
(2), 066006
(2012). http://dx.doi.org/10.1117/1.JBO.17.6.066006 JBOPFO 1083-3668 Google Scholar
A. Gaiduket al.,
“Room-temperature detection of a single molecule’s absorption by photothermal contrast,”
Science, 330
(6002), 353
–356
(2010). http://dx.doi.org/10.1126/science.1195475 SCIEAS 0036-8075 Google Scholar
N. TabatabaeiA. Mandelis,
“Thermal coherence tomography using match filter binary phase coded diffusion waves,”
Phys. Rev. Lett., 107
(16), 165901
(2011). http://dx.doi.org/10.1103/PhysRevLett.107.165901 PRLTAO 0031-9007 Google Scholar
S. Nayaket al.,
“Meta-analysis: accuracy of ultrasound for identifying patients with osteoporosis,”
Ann. Intern. Med., 144 832
–841
(2006). http://dx.doi.org/10.7326/0003-4819-144-11-200606060-00009 AIMEAS 0003-4819 Google Scholar
C. Djokotoet al.,
“Relationship among MRTA, DXA, and QUS,”
J. Clin. Densitom., 7 448
–456
(2004). http://dx.doi.org/10.1385/JCD:7:4:448 1094-6950 Google Scholar
S. G. Robertset al.,
“Noninvasive determination of bone mechanical properties using vibration response: a refined model and validation in vivo,”
J. Biomech., 29
(1), 91
–98
(1996). http://dx.doi.org/10.1016/0021-9290(95)00030-5 JBMCB5 0021-9290 Google Scholar
T. D. WhiteP. A. Folkens, The Human Bone Manual, Elsevier, Irvine, CA
(2005). Google Scholar
E. R. C. Draperet al.,
“Novel assessment of bone using time-resolved transcutaneous Raman spectroscopy,”
J. Bone Miner. Res., 20
(11), 1968
–1972
(2005). http://dx.doi.org/10.1359/JBMR.050710 JBMREJ 0884-0431 Google Scholar
A. Owyoung,
“Sensitivity limitations for CW stimulated Raman spectroscopy,”
Opt. Commun., 22
(3), 323
–328
(1977). http://dx.doi.org/10.1016/S0030-4018(97)90020-1 OPCOB8 0030-4018 Google Scholar
Y. Xuet al.,
“Three-dimensional diffuse optical tomography of bones and joints,”
J. Biomed. Opt., 7
(1), 88
–92
(2002). http://dx.doi.org/10.1117/1.1427336 JBOPFO 1083-3668 Google Scholar
J. M. Yanget al.,
“Simultaneous functional photoacoustic and ultrasonic endoscopy of internal organs in vivo,”
Nat. Med., 18 1297
–1302
(2012). http://dx.doi.org/10.1038/nm.2823 1078-8956 Google Scholar
R. H. Silvermanet al.,
“High-resolution photoacoustic imaging of ocular tissues,”
Ultrasound Med. Biol., 36
(5), 733
–742
(2010). http://dx.doi.org/10.1016/j.ultrasmedbio.2010.02.006 USMBA3 0301-5629 Google Scholar
L. Nieet al.,
“Photoacoustic tomography through a whole adult human skull with a photon recycler,”
J. Biomed. Opt., 17
(11), 110506
(2012). http://dx.doi.org/10.1117/1.JBO.17.11.110506 JBOPFO 1083-3668 Google Scholar
X. Wanget al.,
“Imaging of joints with laser-based photoacoustic tomography: an animal study,”
Med. Phys., 33
(8), 2691
–2697
(2006). http://dx.doi.org/10.1118/1.2214166 MPHYA6 0094-2405 Google Scholar
S. KaiplavilA. Mandelis,
“Truncated-correlation photothermal coherence tomography: “crisp” imaging breaking through the diffusion resolution and depth barriers,”
Nature Photon.,
(2014). Google Scholar
S. KaiplavilA. Mandelis,
“Highly depth-resolved chirped pulse photothermal radar for bone diagnostics,”
Rev. Sci. Instrum., 82
(7), 074906
(2011). http://dx.doi.org/10.1063/1.3616140 RSINAK 0034-6748 Google Scholar
A. Mandelis,
“Frequency modulated (FM) time delay photoacoustic and photothermal wave spectroscopies. Technique, instrumentation, and detection. Part I: theoretical,”
Rev. Sci. Instrum., 57 617
–621
(1986). http://dx.doi.org/10.1063/1.1138879 RSINAK 0034-6748 Google Scholar
N. LevanonE. Mozeson, Radar Signals, John Wiley and Sons, Hoboken, NJ
(2004). Google Scholar
(2007). Google Scholar
G. CallisD. Sterchi,
“Decalcification of bone: literature review and practical study of various decalcifying agents, methods, and their effect on bone histology,”
J. Histotechnol., 21 49
–58
(1998). http://dx.doi.org/10.1179/his.1998.21.1.49 JOHIDN 0147-8885 Google Scholar
S. L. Bonnick, Bone Densitometry in Clinical Practice: Application and Interpretation, Humana Press, New York
(2010). Google Scholar
A. M. Parfittet al.,
“Bone histomorphometry: standardization of nomenclature, symbols, and units,”
J. Bone Miner. Res., 2
(6), 595
–610
(1987). http://dx.doi.org/10.1002/jbmr.5650020617 JBMREJ 0884-0431 Google Scholar
S. A. Prahlet al.,
“Determination of optical properties of turbid media using pulsed photothermal radiometry,”
Phys. Med. Biol., 37
(6), 1203
–1217
(1992). http://dx.doi.org/10.1088/0031-9155/37/6/001 PHMBA7 0031-9155 Google Scholar
N. UgryumovaS. J. MatcherD. P. Attenburrow,
“Measurement of bone mineral density via light scattering,”
Phys. Med. Biol., 49
(3), 469
–483
(2004). http://dx.doi.org/10.1088/0031-9155/49/3/009 PHMBA7 0031-9155 Google Scholar
A. Pifferiet al.,
“Optical biopsy of bone tissue: a step toward the diagnosis of bone pathologies,”
J. Biomed. Opt., 9
(3), 474
–480
(2004). http://dx.doi.org/10.1117/1.1691029 JBOPFO 1083-3668 Google Scholar
L. Vicoet al.,
“Effects of long-term microgravity exposure on cancellous and cortical weight-bearing bones of cosmonauts,”
Lancet, 355
(9215), 1607
–1611
(2000). http://dx.doi.org/10.1016/S0140-6736(00)02217-0 LANCAO 0140-6736 Google Scholar
C. R. Steeleet al.,
“Noninvasive determination of ulnar stiffness from mechanical response—in vivo comparison of stiffness and bone mineral content in humans,”
J. Biomech. Eng., 110
(2), 87
–96
(1988). http://dx.doi.org/10.1115/1.3108423 JBENDY 0148-0731 Google Scholar
S. Kaiplavilet al.,
“Photothermal tomography for the functional and structural evaluation, and early mineral loss monitoring in bones,”
Biomed. Opt. Express, BOEICL 2156-7085 Google Scholar
M. L. Bouxseinet al.,
“Guidelines for assessment of bone microstructure in rodents using micro-computed tomography,”
J. Bone Miner. Res., 25
(7), 1468
–1486
(2010). http://dx.doi.org/10.1002/jbmr.141 JBMREJ 0884-0431 Google Scholar
|

