
|
|
1.IntroductionRemodeling of the airway tissue is a pathological feature of a number of chronic airway diseases including chronic obstructive pulmonary disease (COPD).1 Features of airway remodeling include increased airway smooth muscle mass, thickening of the basement membrane and an increase in the amount and an altered composition of the extracellular matrix (ECM).2,3 The ECM is a complex network of macromolecules which maintains the structural integrity of tissues and also has bioactive roles, such as the regulation of cellular proliferation, migration, adhesion, differentiation, and survival.4,5 Even small alterations in the ECM composition or structural organization are likely to alter its bioactive influence and contribute to disease pathology.6,7 Whilst the importance of airway remodeling in COPD has recently been recognized,8,9 very little is understood about the exact changes that are occurring during these processes. In COPD, the most predominant pathological change is the alveolar destruction in the parenchyma. However, recent focus in COPD research has begun shifting toward understanding the airway remodeling that occurs10–13 as the initial source of the pathological change, which is thought to precede the alveolar destruction. In COPD, both the large and the small airways are remodeled which includes alterations to the ECM.14–16 The ECM composition in COPD lungs have been previously characterized using immunohistochemical staining of tissues.17 Numerous ECM proteins are altered,18 such as differential expression of proteoglycans, with increased versican,19 and decreased perlecan expression.20 The ECM in COPD is altered compared with nonsmokers, with a decreased deposition of collagen I and elastin, and increased expression of fibronectin and tenascin.17,21,22 The most abundant ECM proteins in the lung are fibrillar collagens (Types I, II, III, V, and XI),23 providing structural support and having bioactive roles.24–26 Fibrillar collagens (predominantly collagen type I) also possess a property known as second-harmonics generation (SHG). The SHG signal is produced by noncentrosymmetric molecules, and the resultant signal is double the frequency of the incident light. Collagen I produces a SHG signal due to its noncentrosymmetric triple helical structure that is further enhanced by its highly ordered pseudo-crystalline structure, which makes it a very potent generator of SHG signal. This SHG signal property of noncentrosymmetric molecules is utilized in SHG imaging and has been used in biological systems for over a decade. It is a noninvasive technique that can be used to analyze the structure of the ECM within tissues and has been used as a robust technique to image tissue structures both in vivo and ex vivo.27–34 This creates a potent tool to investigate the pathological effects of disease on the ECM structure within tissues from many different organs. The SHG has been applied to study disease groups, such as cancer,35–40 fibrosis,41,42 and tissue models43–45 in various organs.46 To quantify data obtained from SHG, a variety of methods have been developed. The SHG is a coherent process, as such collagen fibers from the same focal volume generate signals that propagate both in the forward or backward directions along the path of the incident light. The SHG was used to investigate collagen structure in bone matrix remodeling in a mouse model of chronic arthritis31 and osteogenesis imperfecta32,47 where an increase in the forward to backward (F/B) propagating SHG signal ratio was related to a reduction in collagen organization and density in the diseased group. The F/B ratio was used in another study to evaluate collagenase-induced tendon injury and showed a marked change in the frequency distribution of F/B ratio within the injured horse tendon.33 Several problems have previously been encountered while using SHG. When using light microscopy techniques such as SHG, it is difficult to image thick samples due to the relationship of opacity with sample thickness, which negatively impacts the imaging accuracy and precision. This is particularly prominent in SHG imaging as the SHG signal is coherent and signal loss/scattering is experienced from both forward- and backward-propagated light. The SHG signal is also susceptible to power fluctuations as the intensity of the SHG signal is proportional to the square of the incident laser power. To address these issues, we have developed several optimization techniques that are described in this article. The SHG imaging has also been used to study airway diseases. This technique has been used previously to show a difference in the collagen organization in COPD lung tissue and nondiseased (ND) lung alveoli,48,49 cell-mediated ECM remodeling in vitro50,51 and fibrosis in other airway diseases, such as idiopathic pulmonary fibrosis43,44 and lung cancer.52,53 The SHG was used to quantify the fibrosis-related increase in collagen deposition in a mouse model of pulmonary fibrosis.44 The ratio of elastin to collagen detected using multiphoton SHG microscopy has also been used previously to identify the ECM structural changes in an emphysematous lung.48 However, no standardized technique or optimization has been used in previous studies, thus making comparison between studies difficult. Importantly, the SHG signal F/B ratio can also be used as a semi-quantitative measure of the ratio of mature-organized collagen to immature-disorganized collagen fibrils. Immature-disorganized collagen fibers produce a lower F/B ratio compared with mature-organized collagen fibers, and this ratio increases as the collagen matures.54 This ratio can be used to measure and compare collagen turnover in tissue and has previously been utilized to analyze collagen structure.31–34 However, to our knowledge, the organization of collagen fibers has not previously been quantified in airway tissues. In this study, we have optimized a method of utilizing SHG to visualize the three-dimensional (3-D) structural organization of collagen I in airway tissue, and we used a variety of analytical methods that can be used. We have developed a robust method and applied it to quantitatively compare the ECM collagen changes between normal and diseased tissues that can be reliably compared across different sampling times and centers. We also show optimizations that help to circumvent the problem encountered in SHG imaging caused by backward-propagated signals. Some of the parameters analyzed include signal stability within 30-μm-thick samples, signal reproducibility with subsequent sample sections, impact of tissue orientation during analysis, and PMT calibration. The experimental method was optimized for research purposes for ex vivo analysis of lung tissue. 2.Methods2.1.Human TissuesIsolated human airway tissue was obtained from explanted and resected human lungs and postmortem organ donors. Approval of all experiments with human lung tissues was provided by the Ethics Review Committees of the South West Sydney Area Health Service, St Vincent’s Hospital Sydney, Strathfield Private Hospital, Royal Prince Alfred Hospital, and the University of Sydney Human Research Ethics Committee. All volunteers or their next of kin provided written informed consent. The samples used as ND controls were from healthy organ donors whose lungs were deemed unfit for use in a transplant procedure whose next of kin had provided permission for the tissue to be used for research purposes. General demographics of the donors are included in Table 1. Table 1Demographics of patients.
Note: Abbreviations used are COPD=chronic obstructivepulmonary disease, SD=standard deviation, M=male, and F=female. 2.2.Tissue Preparation for Second Harmonic ImagingAirway tissues were fixed in 4% phosphate-buffered formalin (pH 7.2) and embedded in paraffin at the Histopathology Laboratory at The University of Sydney and archived. Sections of 30-μm thickness were cut using a Shandon Finesse 325 (Thermo Scientific, Waltham, Massachusetts) microtome in the Histopathology Laboratory and mounted on Superfrost Plus microscope slides (Lomb Scientific, Taren Point, Australia) to be used for standard SHG analysis. Tissues to be used for analysis of backward-propagated contribution were mounted on a #1 thickness coverslip (Gerhard Menzel GmbH, Braunschweig, Germany). Sections were de-paraffinized by incubation in two changes of xylene (MP Biomedicals, Santa Ana, California) for 10 min each and rehydrated through graded alcohol ( 100%, 95% and 70% ethanol) for 2 min each before being placed in distilled water for at least 30 min. Sections were then dehydrated through graded alcohol and two changes of xylene and coverslipped using organic mounting medium Di-n-butyl Phthalate in Xylene (DPX) (Asia Pacific Specialty Chemicals, Australia). To measure airway diameter 5-μm tissue sections from the same tissue source used for the orientation experiments were de-paraffinized using the protocol above, stained with haematoxylin and eosin (Sigma-Aldrich, St Louis, Missouri) and then coverslipped. Serial images of the airway were visualized at magnification using an Olympus BX60 microscope (Olympus America, Center Valley, Pennsylvania) with manual light exposure and “one push” background white balance and images were captured using an attached DP71 camera (Olympus America) with appropriate scale bars in each image. The serial images were then stitched together to form an image of the entire airway using the MosaicJ function55 in the ImageJ software package Fiji.56 Global pixel calibration was then performed on the scale bars in the image to determine the pixel dimensions. Using the freehand function the basement membrane of the airway was traced, and the diameter was calculated by assuming the perimeter of the traced area was the circumference of a circle. Only large airways with a diameter of were used in the experiment. 2.3.Sampling MethodologyPreliminary comparison of SHG collagen structure between ND and COPD airways compared 5 ND tissues with 9 COPD tissues, each tissue was collected from a different patient and a 30-μm section was cut from each tissue. From each 30-μm section, three randomly chosen regions of airway were analyzed. For analysis of SHG signal uniformity with sequential sections, three sequential 30-μm sections were collected from five airway samples from five different patients. Three randomly chosen regions of the airway were analyzed in the first section from each patient, and the same region was then identified and analyzed for the sequential sections. Analysis of the impact of tissue orientation on SHG signal was conducted on six airway tissue samples from six different patients, one 30-μm section and one sequential 3-μm section was collected from each tissue. The sections were mounted on a coverslip. Regional samples for sequential sections were analyzed according to the protocol above. 2.4.Calibration of Microscope, Laser, and DetectorsThe microscope used in these experiments was a Leica inverted stand equipped with a SP5 multiphoton confocal system and tunable titanium sapphire laser with pulses of 100- to 200-fs duration (Leica, Wetzlar, Germany). An excitation wavelength of 810 nm was used throughout. The microscope was equipped with dual photomultiplier (PMT) transmitted and reflected nondescanned light detectors. The incident laser power was measured using a power meter inserted into the focal plane of the microscope. For calibration, a air objective was used with zoom while the laser blanking was removed. A calibration curve was generated for the internal gain setting against measured laser power over the range 0 to 50 mW. These experiments rely on an accurate measurement of the ratio of F/B propagating SHG signal. However, the microscope optics, light path, and detectors are different in both directions. Therefore, the microscope and detectors were calibrated using Coumarin 480 fluorescent dye (Exciton, Dayton, Ohio). Fluorescence is isotropic, so the inherent detection sensitivity for light-emitted forward and backward can be determined, as previously employed.32,46,54,57,58 The dye was placed on a well slide and coverslipped. The fluorescent dye was excited by two-photon excitation at 810 nm, while emission was detected at over a range of incident powers (5 to 50 mW). In addition to the extrinsic differences in the microscope in the forward and backward directions, there is an intrinsic difference in detection efficiency between SHG signal and fluorescence signal. Fluorescence is isotropic, while SHG is anisotropic. Therefore, the effect of numerical aperture (NA) in the condenser and objective can be different in measuring SHG compared with fluorescence signal. This can produce a different calibration factor between fluorescence and SHG for different NA combinations. In the current experiments, the SHG signal is produced by randomly oriented fibrils from circularly polarized laser light (vide infra). Therefore, the SHG signal in these experiments is expected to be much more isotropic than SHG signals from uniformly oriented fibers.54,59–61 Therefore, we use the calibration factor from fluorescence measurements to calibrate F/B ratios. 2.5.Second Harmonic Imaging of Lung TissueTo allow for maximum collagen detection a quarter wave plate (CVI Laser Optics, Albuquerque, New Mexico) was used to produce circularly polarized light, which was also in place for the calibration. The incident laser power was always adjusted to 25 mW for the experiment, which lies in the middle of the detector calibration range identified during our study. The power was always measured prior to experiments to check for any drift in laser power output over time that was readjusted if detected.62 The SHG signal was detected with a bandpass filter and two-photon fluorescence was detected with a 585/40 bandpass filter. Objectives used included NA 0.4 and NA 1.3 glycerol immersion objectives. An air condenser NA 0.9 was used. Confocal images were taken at 16-bit resolution for both forward- and backward-propagated SHG signals with identical detector configurations. The PMTs were calibrated on a representative sample of airway from an individual with asthma, because collagen deposition is increased in asthmatic airways,63–68 and as such this airway tissue was used to determine the maximum collagen SHG signal to obtain an appropriate range of signals without signal saturation. Kohler illumination was performed for every sample to ensure the highest quality images and data. Due to the heterogeneous nature of the airway the Mark and Find function of the Leica LAS AF software (Leica) was used to obtain images from three randomly selected areas of each airway. 2.6.Image AnalysisImage analysis was performed using Fiji56 with images imported from the LAS AF software. The stack was deliberately oversampled by 20% in each direction to ensure the entirety of the tissue section was imaged. The stack was then converted to individual images. The confocal 3-D image was analyzed using the histogram to determine the mean () and standard deviation () of the signal for each pixel. A lower threshold of was then applied to the image to exclude background emissions as previously published.69 To accurately analyze the physical section, the top and bottom 20% of the optical section resulting from the optical oversampling were excluded from further analysis. The pixel area (area: the number of pixels with intensity above threshold) and pixel density (density: average signal intensity per pixel with intensity above threshold) were measured for every slice in the image using batch processing. The total signal intensity (intensity: total intensity for all pixels with intensity above threshold) was determined as the product of the pixel area and density. The average values for these measurements were calculated for every image in the stack. The above process was repeated for both forward- and backward-propagated data to generate area, intensity, and density data for both forward- and backward-propagated signals. The ratio of F/B signal was then calculated for area, intensity, and density measurements. 2.7.Statistical AnalysisThe data was processed using Microsoft Excel (Microsoft, Redmond, Washington) and statistical analysis was performed using GraphPad Prism 5 (GraphPad Software, La Jolla, California). Mean unsigned difference was used to analyze the region and patient variation within the sample. Student’s t-test was used to analyze F/B ratio differences between COPD and ND airways. A repeated measures ANOVA was used to analyze differences between three consecutive 30-μm sections. Paired Student’s t-test was used to analyze differences between 30-μm-thick and 3-μm-thin tissue sections and tissue orientation differences. 3.Results and Discussion3.1.CalibrationMicroscope calibration was carried out using a fluorescent dye, excited by two-photon excitation at 810 nm, using incident laser power of 5 to 50 mW and detected at PMT voltages of 400, 500, and 600 V. Figure 1(a) shows a representative set of data for forward and backward two-photon fluorescence signal as a function of laser power for PMT voltages of 500 V each. Similar curves were measured at 400 and 600 V. At low power the signal on both detectors increased quadratically with power, as expected for two-photon absorption [see Fig. 1(a)]. Above 25-mW power saturation effects in the dye started to become important as evidenced by the flattening of the detector response curve. The saturation effect was the same in the forward and backward directions, and the same for all PMT voltages. Therefore, we attributed this effect to saturation of the dye absorption itself, and not saturation of the PMT response, which would be different for different PMT voltages, and likely different for different PMTs. Fig. 1Photomultiplier calibration results. (a) Forward (filled squares) and backward (open circles) fluorescence intensity as a function of laser power. (b) Ratio of forward to backward (F/B) signal. The F/B ratio is shown to be independent of laser power.  Figure 1(b) shows the ratio of the observed F/B fluorescence signal as a function of laser power. The F/B ratio is independent of laser power, irrespective of whether the signal was in the quadratic or saturation range. The larger uncertainty in the ratio at lower power is due to larger statistical noise at lower PMT signal. Figure 1(b) demonstrates that the detector responses remain linear across the whole dynamic range of the calibration. Subsequent experiments were always carried out at 25 mW, which represents the upper end of the quadratic range. However, these data indicate that small changes in laser power, either day-to-day, or during an experiment, have no effect on the observed F/B ratio. In Fig. 1(b), the curves also provide the calibration factor to convert observed F/B ratios in the SHG experiments to absolute ratios. A dye in solution will be randomly oriented to the laser propagation axis and polarization vector. Circularly polarized light was used in these experiments. The ensuing fluorescence will therefore also be isotropic and the amount of fluorescence light in the forward and backward directions should be equal (), For the PMT settings in Fig. 1(b) (500 V each), the observed F/B ratio is 0.0886, indicating that the detection efficiency in the forward direction is about 11 times less than in the backward direction. The cause of this difference is the different objectives for forward and backward signal collection ( and 1.3 respectively), the light path between the sample and the detector, and the filters used for each path. The true, absolute F/B ratio is obtained by dividing the observed F/B ratio by the calibration factor. Calibration factors were measured for all combinations of PMT voltages used in these experiments, in the same way as shown in Fig. 1(b). 3.2.SHG Measurements of ND and COPD Airway TissuesRemodeling of the ECM is one of the features of airway remodeling in various airway diseases such as COPD. Figure 2 shows example images of ND and COPD airway tissue, showing the maximum intensity two-dimensional (2-D) projection image of the tissue structure. The multiphoton excitation fluorescence image, Fig. 2, shows the general tissue structure of the airway and elastin structures that are not visible using SHG. The amount and structure of the collagen are visibly different between ND and COPD. Fig. 2Representative images of lung tissue for nondiseased and COPD. Three types of images are shown: MPEF image, second harmonic generation (SHG) image in backward direction, and SHG image in forward direction. The scale bars are 50 μm in length. Abbreviations used: COPD = chronic obstructive pulmonary disease, , ASM = airway smooth muscle, , and .  Figure 3 shows raw SHG signal measurements across three regions for 14 patients. The absolute signal varies by up to two orders of magnitude for intensity, while variation in area (factor of 5) and density (factor of 22) measurements was less. The variability in forward signal is approximately twice that of the backward signal indicating greater stability in the backward signal, while there is no significant difference comparing the individual F and B values between ND and COPD patients. The main source of variation in the signal is the random choice of region to be imaged, which is particularly evident in the three regions for patients 2, 4, 12, and 13. Fig. 3Normalized SHG signal in the forward and backward directions for the 14 tissue samples. Samples 1 to 5 are from ND patients, while samples 6 to 14 are from patients suffering from COPD. The variation in SHG signal spans almost two orders of magnitude for intensity. Backward signal is two orders of magnitude weaker than forward and plotted on the right ordinate. Abbreviations used: and .  To address the wide variability in F or B, the SHG signal when measured between different images the F/B ratio was calculated. There are several anticipated sources of variation in SHG signal, and hence F/B ratio, including (1) variation between sampling regions within the same tissue section from a patient (region variation), (2) variation between patients with the same disease state (patient variation), and (3) difference between disease states (disease variation). The region variation was determined through two stages, first, by calculating the absolute percentage variation of each F/B ratio from the mean F/B ratio calculated for the three regions for each patient. Then, the absolute F/B ratio percentage variations from each patient in the group were averaged to obtain the mean value, which is referred to as the region variation (average of region variations in Fig. 4). This variation was calculated separately for ND and COPD patients. Fig. 4Variation of area F/B ratio values between regions, patient, and disease. The region variation (solid black lines shown for each patient) is calculated from three randomly selected regions within a single patient sample individually. The patient variation (distance between red solid lines) is the mean individual deviations from the averaged region variations from each patient for ND or COPD. The disease variation (distance between blue dotted lines) is the relative difference of the means of ND versus COPD. Abbreviations used: , , and signal to backward-propagated signal ratio.  The patient variation (Fig. 4) was determined through three stages. First, the absolute F/B ratio percentage variation for the three regions from each patient was averaged for each patient to obtain the mean F/B ratio percentage variation. Second, the mean absolute F/B ratio percentage variation for each patient for the same disease group were averaged and this mean value was used to calculate the mean absolute percentage variation within a disease group. The region and patient variations calculated in this way are shown in Table 2. Table 2Statistical analysis of region and patient variation in F/B ratio separated according to disease group.
Note: Abbreviations used are COPD = chronic obstructive pulmonary disease, ND=nondiseased, F=forward, and B=backward. There are several observations to note in these data in Table 2. First, the mean variation in F/B ratio ranges between at most 22%, and as little as 9%, across the six region variation measurements, despite up to two orders of magnitude difference in the individual F and B measurements in these samples (Fig. 3). Second, region and patient variability are similar for both ND and COPD groups. This is important as the region variation could presumably be lessened by measuring more regions, whereas the patient variation is inherent to the patient group heterogeneity. Because the region variation is of a similar magnitude to the patient variation, we determined that more image samples were not necessary to further reduce the variability in the data. Third, the variation in F/B ratio between ND and COPD patient groups is similar. Two analysis methods were used to explore the difference in F/B ratio for ND and COPD patients: (1) treating each region of each section as an independent measurement of F/B, and (2) treating each region within a section as replicates, and only each patient as independent. These methods provide either 15 ND and 27 COPD measurements for the first method or 5 and 9 averaged measurements, respectively for the second method, as reported in Table 3. We acknowledge that in reality, each different region is not truly a replicate as they are sampling different parts of the same tissue. The analysis of variation in Table 2 and Fig. 4, however, shows that the regional variation within a sample is similar to the variation between patients. The two variation measurements can thus be treated independently to estimate the accuracy of the experimental results. Calculating the mean absolute difference for the ND and COPD groups separately with method (1) provides the variation caused by sampling multiple regions and patients while method (2) gives us the variation between different patients only. Table 3Analysis of F/B ratio for nondiseased (ND) and COPD tissues.
Note: Three regions were imaged per section and analyzed as either independent samples (all images), or averaged and each section treated as independent (all sections). A significant difference between mean F/B ratios (P<0.05) was observed for area and intensity but not density, irrespective of analysis method. Abbreviations used COPD = chronic obstructive pulmonary disease, ND=nondiseased, F=forward, and B=backward. A null hypothesis that the ND and COPD F/B ratios are the same was tested with a t-test (one-tail) and the resultant values shown in Table 3. Both the collagen F/B area and intensity measurements were significantly higher () for ND patients compared with the COPD patients for both analysis methods. These results indicate that there is (1) an increase in disorganized (B) collagen; (2) a decrease in organized (F) collagen; or (3) a combination of both events in the airway. The F/B density measurement is not significantly different between the two groups. As density is derived from intensity/area, with both values decreasing in COPD c.f. ND, the lack of significant difference in density is not surprising. This indicates that the F/B density value is less susceptible to tissue heterogeneity and disease. 3.3.F/B Ratio as a Function of Tissue ThicknessWe explored the thickness of tissue section required to achieve a reliable F/B ratio and the effect of tissue thickness on the absolute SHG signal. Five tissue samples were selected (1 ND, 4 COPD) for measurement of sequential sections as illustrated in Fig. 5(a). The variation caused by different regions had already been investigated above and thus to investigate differences in the -axis (depth) the same three regions were analyzed in three successive sections. The F/B ratio is integrated across each 30-μm section. The results in Fig. 5(b) show that there was no difference in F/B between any of the three successive sections. Thus, the F/B ratio for a 30-μm section was representative of a section of at least 90 μm in depth. Fig. 5No variation was detected in the F/B ratio over 90 μm of airway tissue. (a) The schematic of the experimental design. (b) The F/B ratio of the 30-μm tissue sections in the series show no significant difference over the depth of the tissue for area, intensity, and density (repeated measures ANOVA, ). Abbreviations used signal to backward-propagated signal ratio. 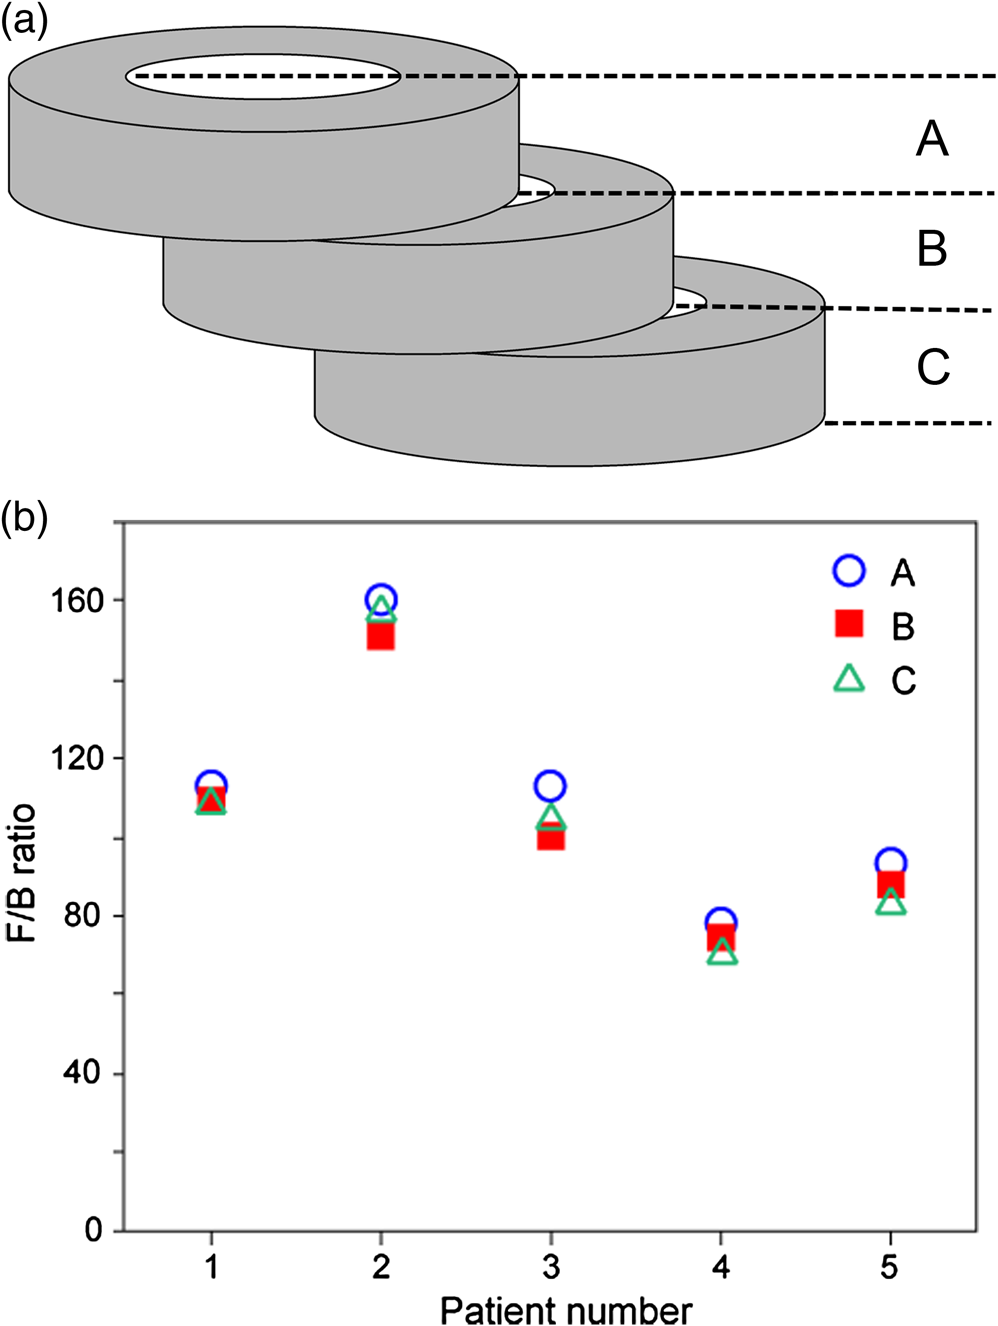 One of the issues associated with analyzing thick tissue sections is optical density (OD). With increasing thickness there can be losses associated with scattering or absorption of the SHG signal. These losses of SHG signal will be different in the forward and backward directions, depending of the depth of the origin of the SHG signal within the tissue, and hence F/B ratio might vary for different optical depths of a thick tissue. To determine the effect of thickness on SHG signal within a 30-μm section, the 2-D image series used to generate the 3-D image was partitioned into groups of 10 successive 2-D images, as illustrated in Fig. 6(a). For each group of 10 images, the F/B ratio was obtained and presented as a function of depth. The density F/B ratio value was used in the analysis because density was previously found to be less susceptible to tissue heterogeneity and disease group (Table 3), to minimize the effects of tissue heterogeneity found within the 30-μm-thick section. Fig. 6Analysis of F/B SHG signal contribution in 30-μm sections. (a) A schematic of the analysis method used to determine the F/B contribution calculated for every 10 -slice increments compared with the first 10 -slices. (b) The F/B ratio variation of the signal density at increasing depths within a section plotted as a fold change to the first group of sections (each symbol represents a different tissue sample), there is a change in the ratio with increasing depth that falls within two curves from randomly selected tissues with different optical densities (blue lines). Abbreviation used signal to backward-propagated signal ratio.  Figure 6(b) shows the variation in density F/B ratio with optical depth, where the ratio was normalized to the value for the first slice for each individual patient. A systematic change in the signal was observed, with F/B ratio increasing by to 15% over the 30 μm in depth. This variation may be the result of a number of causes. (1) The SHG signal is at 405 nm, which has a lower penetration than the incident 810-nm laser light. Consequently, the SHG signal will be more strongly scattered and/or absorbed by the tissue. The SHG signal is emitted from increasingly deeper parts of the sample as a sample is scanned through the -axis (depth) and the forward propagating signal will become increasingly enhanced over the backward propagating signal caused by reduced obstruction in the travel path relative to the signal point of origin, which is consistent with our observation. (2) Another explanation is that the forward-propagating SHG signal is scattered into the backward direction; this is particularly relevant as the forward signal is much stronger than the backward signals. The chance of the signal scattering to the backward signals is increased with longer forward propagation distance. Again, this explanation is consistent with our observation. To test the effect of absorption and scattering of 405-nm light (the wavelength of the SHG signal) through the sample, the OD of a number of 30- and 3-μm sections was measured using an incandescent 405-nm light source and photodetector. The measurements were repeated for several patients, disease groups, and several regions within each sample. The OD was typically in the range 0.05 to 0.15 for the 30-μm tissues samples, and 0.005 to 0.015 for the 3-μm samples. These OD measurements include contributions from absorption and scattering of the 405-nm light through the sample and were used to simulate the effect on F/B ratio, assuming similar absorption/scattering of SHG signal. The two black lines in Fig. 6(b) represent the highest and lowest OD values recorded in the absorption experiments. The observed change in F/B ratio for each patient, as a function of depth, lies within the limits of the model. The conclusion from these experiments is that the F/B ratio changes with SHG signal depth in a manner that is consistent with absorption or scattering of the 405-nm signal through the residual tissue in the forward or backward directions. From the model results in Fig. 6(b), we conclude that the SHG signal absorption/scattering is within acceptable levels for a 30-μm sample; however, with thicker samples this variability may impact the accuracy of the data. In a homogeneous sample such as a collagen gel, it is possible to account for the signal loss associated with increasing tissue depth as the material and composition of the sample is the same throughout the tissue; therefore, a calibration factor based on the calculated OD can be applied to each optical section according to depth of the signal origin within the tissue to normalize the results. This is difficult to perform with heterogeneous samples such as human airways where there are various different structural components that differ with increasing depth within the tissue section. We were therefore unable to calculate a calibration factor that could be applied to our data to account for the effect of signal absorption and scattering. To determine if orientation of the tissue during analysis would affect the SHG signal, an experiment was designed to compare orientation differences between a thick 30-μm section and a thin 3-μm section. A 30- and a 3-μm section from six different patients were sandwiched between two coverslips to ensure equal light paths. Three regions within each section were analyzed (), then the section was inverted and the same three regions within the sample were analyzed (). Thus, the three regions in the tissue sections were scanned twice with the incident 810-nm laser light approaching from two opposing directions on the -axis [Fig. 7(a)]. The following formula was used to determine the absolute variation in F/B ratio for either orientation ( and ). Fig. 7Tissue orientation does not affect SHG signal in the forward and backward directions. (a) A schematic of the tissue preparation. There was no significant difference in the variation of the F/B ratio of the area (b) values comparing thick 30-μm sections to thin 3-μm sections for the two tissue orientations (). Data was analyzed with paired Student’s -test. Abbreviations used: signal to backward-propagated signal ratio.  In an ideal situation, the signal from either orientation is identical and thus has a ratio value of 1 with F/B ratio variation of 0. No difference was found between the two thicknesses (area: 30-μm mean SD and 3-μm mean SD, ) and thus it was shown that the F/B ratio change caused by thickness of the tissue section was independent of tissue orientation [Fig. 7(b)]. 4.ConclusionsThe SHG is a robust method for the analysis of ECM collagen. The method and analysis that we have developed in this article can be adapted for various different tissue types. The robustness of the SHG signal provides a unique opportunity for direct comparison of samples collected and analyzed at different times. The F/B ratio obtained from SHG is a reliable measurement as it is independent of laser power drift, independent of regions analyzed within the tissue and independent of tissue orientation during analysis. The SHG imaging optimization and calibration methods described in this article can be used to standardize the results between instruments and thus allow results to be directly comparable between instruments at different research centers. This method can be exploited to perform multicentre studies of ECM collagen, with analysis occurring over a period of time, giving robust and directly comparable data. We stress that the calibration method (fluorescence) used here was to compensate for different detection efficiency and light paths in the forward and backward directions and might not be applicable for different NA combinations. The experimental setup and sampling methodology described in this article have shown that the variation observed between experiments and patient samples is well below the variation between COPD and ND airways. A significant difference between ND and COPD airways was observed with only a small number of patients with minimal sampling (three regions) per patient, indicating ease, sensitivity, and reliability of the method. The results are also uniform over a larger tissue depth; this is advantageous because SHG signal loss can be a significant issue with increasing tissue depth. Our study has shown that only a small amount of tissue is required to obtain valuable 3-D structural information. This gives us an opportunity to perform more experiments with limited resources. With SHG, we can obtain a wealth of information from a single technique. It has previously been reported that the ECM is altered in COPD airways and that both amount and synthesis of collagen I is affected.17,48,70,71 The SHG is a potent and reliable method to assess ECM collagen I remodeling in COPD, which adds additional information to previous reports. A decrease in the SHG collagen I F/B ratio in airways of COPD compared with ND patients is shown in this study, indicating alterations in ECM collagen I organization (increased immature-disorganized and/or decreased mature-organized collagen I). The SHG also possesses several advantages as compared with and when used in conjunction with conventional imaging techniques. This technique used with multiphoton microscopy, as shown here, is minimally invasive. As SHG is a natural property of collagen fibers there is no need to use probes in order to label the collagen molecules, a process which may alter the collagen structure. Multiphoton microscopes also have greater penetration capability thus allowing more accurate analysis of thicker samples compared with conventional confocal microscopes. With the method that we have developed using SHG, we can easily and robustly assess collagen remodeling changes in tissue, with sampling over time and at multiple sites. We have shown that this method is capable of detecting changes in collagen organization in COPD airways and with the optimizations described has the potential to be adapted across many different tissue types. Thus, the method described herein can be used as a powerful tool to advance our understanding of pathological ECM remodeling changes and may provide a tool to uncover new therapeutic targets for the future. ReferencesA. M. Vignolaet al.,
“Airway remodeling in the pathogenesis of asthma,”
Curr. Allergy Asthma Rep., 1
(2), 108
–115
(2001). http://dx.doi.org/10.1007/s11882-001-0077-4 CAARC9 1529-7322 Google Scholar
J. K. Burgesset al.,
“Reduction of tumstatin in asthmatic airways contributes to angiogenesis, inflammation, and hyperresponsiveness,”
Am. J. Respir. Crit. Care Med., 181
(2), 106
–115
(2010). http://dx.doi.org/10.1164/rccm.200904-0631OC AJCMED 1073-449X Google Scholar
J. K. Burgesset al.,
“Tissue and matrix influences on airway smooth muscle function,”
Pulm. Pharmacol. Ther., 22
(5), 379
–387
(2009). http://dx.doi.org/10.1016/j.pupt.2008.12.007 PPTHFJ 1094-5539 Google Scholar
C. R. RobertsD. C. WalkerR. R. Schellenberg,
“Extracellular matrix,”
Clin. Allergy Immunol., 16 143
–178
(2002). JACIBY 0091-6749 Google Scholar
T. TranA. J. Halayko,
“Extracellular matrix and airway smooth muscle interactions: a target for modulating airway wall remodelling and hyperresponsiveness?,”
Can. J. Physiol. Pharmacol., 85
(7), 666
–671
(2007). http://dx.doi.org/10.1139/Y07-050 CJPPA3 0008-4212 Google Scholar
D. S. PostmaW. Timens,
“Remodeling in asthma and chronic obstructive pulmonary disease,”
Proc. Am. Thorac., 3
(5), 434
–439
(2006). http://dx.doi.org/10.1513/pats.200601-006AW PATSBB 1546-3222 Google Scholar
H. Jarvelainenet al.,
“Extracellular matrix molecules: potential targets in pharmacotherapy,”
Pharmacol. Rev., 61
(2), 198
–223
(2009). http://dx.doi.org/10.1124/pr.109.001289 PAREAQ 0031-6997 Google Scholar
C. BergeronL. P. Boulet,
“Structural changes in airway diseases: characteristics, mechanisms, consequences, and pharmacologic modulation,”
Chest, 129
(4), 1068
–1087
(2006). http://dx.doi.org/10.1378/chest.129.4.1068 CHETBF 0012-3692 Google Scholar
A. L. JamesS. Wenzel,
“Clinical relevance of airway remodelling in airway diseases,”
Eur. Respir. J., 30
(1), 134
–155
(2007). http://dx.doi.org/10.1183/09031936.00146905 ERJOEI 0903-1936 Google Scholar
C. H. Boskenet al.,
“Small airway dimensions in smokers with obstruction to airflow,”
Am. Rev. Respir. Dis., 142
(3), 563
–570
(1990). http://dx.doi.org/10.1164/ajrccm/142.3.563 ARDSBL 0003-0805 Google Scholar
M. Cosioet al.,
“The relations between structural changes in small airways and pulmonary-function tests,”
N. Engl. J. Med., 298
(23), 1277
–1281
(1978). http://dx.doi.org/10.1056/NEJM197806082982303 NEJMAG 0028-4793 Google Scholar
G. L. Snider,
“Chronic obstructive pulmonary disease—a continuing challenge,”
Am. Rev. Respir. Dis., 133
(5), 942
–944
(1986). ARDSBL 0003-0805 Google Scholar
G. L. Snider,
“Experimental studies on emphysema and chronic bronchial injury,”
Eur. J. Respir. Dis. Suppl., 146 17
–35
(1986). EJRSDD 0106-4347 Google Scholar
M. Saettaet al.,
“Cellular and structural bases of chronic obstructive pulmonary disease,”
Am. J. Respir. Crit. Care Med., 163
(6), 1304
–1309
(2001). http://dx.doi.org/10.1164/ajrccm.163.6.2009116 AJCMED 1073-449X Google Scholar
P. Maestrelliet al.,
“Remodeling in response to infection and injury. Airway inflammation and hypersecretion of mucus in smoking subjects with chronic obstructive pulmonary disease,”
Am. J. Respir. Crit. Care Med., 164
(Supplement_2), S76
–S80
(2001). http://dx.doi.org/10.1164/ajrccm.164.supplement_2.2106067 AJCMED 1073-449X Google Scholar
M. Saettaet al.,
“Loss of alveolar attachments in smokers. A morphometric correlate of lung function impairment,”
Am. Rev. Respir. Dis., 132
(4), 894
–900
(1985). ARDSBL 0003-0805 Google Scholar
R. Annoniet al.,
“Extracellular matrix composition in COPD,”
Eur. Respir. J., 40
(6), 1362
–1373
(2012). http://dx.doi.org/10.1183/09031936.00192611 ERJOEI 0903-1936 Google Scholar
J. A. Noordhoeket al.,
“Different modulation of decorin production by lung fibroblasts from patients with mild and severe emphysema,”
COPD, 2
(1), 17
–25
(2005). http://dx.doi.org/10.1081/COPD-200050678 1541-2555 Google Scholar
M. J. Merrileeset al.,
“Changes in elastin, elastin binding protein and versican in alveoli in chronic obstructive pulmonary disease,”
Respir. Res., 9 41
(2008). http://dx.doi.org/10.1186/1465-9921-9-41 RREEBZ 1465-993X Google Scholar
J. F. van Straatenet al.,
“Proteoglycan changes in the extracellular matrix of lung tissue from patients with pulmonary emphysema,”
Mod. Pathol., 12
(7), 697
–705
(1999). MODPEO 0893-3952 Google Scholar
J. C. Hogget al.,
“What drives the peripheral lung-remodeling process in chronic obstructive pulmonary disease?,”
Proc. Am. Thorac. Soc., 6
(8), 668
–672
(2009). http://dx.doi.org/10.1513/pats.200907-079DP PATSBB 1546-3222 Google Scholar
J. V. Gosselinket al.,
“Differential expression of tissue repair genes in the pathogenesis of chronic obstructive pulmonary disease,”
Am. J. Respir. Crit. Care Med., 181
(12), 1329
–1335
(2010). http://dx.doi.org/10.1164/rccm.200812-1902OC AJCMED 1073-449X Google Scholar
M. van der RestR. Garrone,
“Collagen family of proteins,”
FASEB J., 5
(13), 2814
–2823
(1991). FAJOEC 0892-6638 Google Scholar
D. P. McDanielet al.,
“The stiffness of collagen fibrils influences vascular smooth muscle cell phenotype,”
Biophys. J., 92
(5), 1759
–1769
(2007). http://dx.doi.org/10.1529/biophysj.106.089003 BIOJAU 0006-3495 Google Scholar
B. N. Masonet al.,
“Tuning three-dimensional collagen matrix stiffness independently of collagen concentration modulates endothelial cell behavior,”
Acta Biomater., 9
(1), 4635
–4644
(2013). http://dx.doi.org/10.1016/j.actbio.2012.08.007 ABCICB 1742-7061 Google Scholar
R. S. Fischeret al.,
“Stiffness-controlled three-dimensional extracellular matrices for high-resolution imaging of cell behavior,”
Nat. Protoc., 7
(11), 2056
–2066
(2012). http://dx.doi.org/10.1038/nprot.2012.127 NPARDW 1750-2799 Google Scholar
Y. Guoet al.,
“Subsurface tumor progression investigated by noninvasive optical second harmonic tomography,”
Proc. Natl. Acad. Sci. U. S. A., 96
(19), 10854
–10856
(1999). http://dx.doi.org/10.1073/pnas.96.19.10854 PNASA6 0027-8424 Google Scholar
E. Brownet al.,
“Dynamic imaging of collagen and its modulation in tumors in vivo using second-harmonic generation,”
Nat. Med., 9
(6), 796
–800
(2003). http://dx.doi.org/10.1038/nm879 1078-8956 Google Scholar
R. M. WilliamsW. R. ZipfelW. W. Webb,
“Multiphoton microscopy in biological research,”
Curr. Opin. Chem. Biol., 5
(5), 603
–608
(2001). http://dx.doi.org/10.1016/S1367-5931(00)00241-6 COCBF4 1367-5931 Google Scholar
G. Coxet al.,
“3-Dimensional imaging of collagen using second harmonic generation,”
J. Struct. Biol., 141
(1), 53
–62
(2003). http://dx.doi.org/10.1016/S1047-8477(02)00576-2 JSBIEM 1047-8477 Google Scholar
J. Caetano-Lopeset al.,
“Chronic arthritis leads to disturbances in the bone collagen network,”
Arthritis Res. Ther., 12
(1), R9
(2010). http://dx.doi.org/10.1186/ar2908 ARTRCV 1478-6362 Google Scholar
O. Nadiarnykhet al.,
“Second harmonic generation imaging microscopy studies of osteogenesis imperfecta,”
J. Biomed. Opt., 12
(5), 051805
(2007). http://dx.doi.org/10.1117/1.2799538 JBOPFO 1083-3668 Google Scholar
M. Sivaguruet al.,
“Quantitative analysis of collagen fiber organization in injured tendons using Fourier transform-second harmonic generation imaging,”
Opt. Express, 18
(24), 24983
–24993
(2010). http://dx.doi.org/10.1364/OE.18.024983 OPEXFF 1094-4087 Google Scholar
M. Suzukiet al.,
“Second harmonic generation microscopy differentiates collagen type I and type III in diseased lung tissues,”
Proc. SPIE, 8226 82263F
(2012). Google Scholar
N. D. KirkpatrickM. A. BrewerU. Utzinger,
“Endogenous optical biomarkers of ovarian cancer evaluated with multiphoton microscopy,”
Cancer Epidemiol. Biomarkers Prev., 16
(10), 2048
–2057
(2007). http://dx.doi.org/10.1158/1055-9965.EPI-07-0009 CEBPE4 1055-9965 Google Scholar
O. Nadiarnykhet al.,
“Alterations of the extracellular matrix in ovarian cancer studied by Second Harmonic Generation imaging microscopy,”
BMC Cancer, 10 94
(2010). http://dx.doi.org/10.1186/1471-2407-10-94 BCMACL 1471-2407 Google Scholar
P. P. Provenzanoet al.,
“Collagen reorganization at the tumor-stromal interface facilitates local invasion,”
BMC Med., 4
(1), 38
(2006). http://dx.doi.org/10.1186/1741-7015-4-38 BMMECZ 1741-7015 Google Scholar
M. W. Conklinet al.,
“Aligned collagen is a prognostic signature for survival in human breast carcinoma,”
Am. J. Pathol., 178
(3), 1221
–1232
(2011). http://dx.doi.org/10.1016/j.ajpath.2010.11.076 AJPAA4 0002-9440 Google Scholar
S. J. Linet al.,
“Discrimination of basal cell carcinoma from normal dermal stroma by quantitative multiphoton imaging,”
Opt. Lett., 31
(18), 2756
–2758
(2006). http://dx.doi.org/10.1364/OL.31.002756 OPLEDP 0146-9592 Google Scholar
R. Cicchiet al.,
“Multidimensional non-linear laser imaging of Basal Cell Carcinoma,”
Opt. Express, 15
(16), 10135
–10148
(2007). http://dx.doi.org/10.1364/OE.15.010135 OPEXFF 1094-4087 Google Scholar
M. Strupleret al.,
“Second harmonic imaging and scoring of collagen in fibrotic tissues,”
Opt. Express, 15
(7), 4054
–4065
(2007). http://dx.doi.org/10.1364/OE.15.004054 OPEXFF 1094-4087 Google Scholar
W. Sunet al.,
“Nonlinear optical microscopy: use of second harmonic generation and two-photon microscopy for automated quantitative liver fibrosis studies,”
J. Biomed. Opt., 13
(6), 064010
(2008). http://dx.doi.org/10.1117/1.3041159 JBOPFO 1083-3668 Google Scholar
C. B. Raubet al.,
“Linking optics and mechanics in an in vivo model of airway fibrosis and epithelial injury,”
J. Biomed. Opt., 15
(1), 015004
(2010). http://dx.doi.org/10.1117/1.3322296 JBOPFO 1083-3668 Google Scholar
A. M. Penaet al.,
“Three-dimensional investigation and scoring of extracellular matrix remodeling during lung fibrosis using multiphoton microscopy,”
Microsc. Res. Tech., 70
(2), 162
–170
(2007). http://dx.doi.org/10.1002/jemt.v70:2 MRTEEO 1059-910X Google Scholar
C. B. Raubet al.,
“Noninvasive assessment of collagen gel microstructure and mechanics using multiphoton microscopy,”
Biophys. J., 92
(6), 2212
–2222
(2007). http://dx.doi.org/10.1529/biophysj.106.097998 BIOJAU 0006-3495 Google Scholar
X. Chenet al.,
“Second harmonic generation microscopy for quantitative analysis of collagen fibrillar structure,”
Nat. Protoc., 7
(4), 654
–669
(2012). http://dx.doi.org/10.1038/nprot.2012.009 NPARDW 1750-2799 Google Scholar
R. LacombO. NadiarnykhP. J. Campagnola,
“Quantitative second harmonic generation imaging of the diseased state osteogenesis imperfecta: experiment and simulation,”
Biophys. J., 94
(11), 4504
–4514
(2008). http://dx.doi.org/10.1529/biophysj.107.114405 BIOJAU 0006-3495 Google Scholar
T. AbrahamJ. Hogg,
“Extracellular matrix remodeling of lung alveolar walls in three dimensional space identified using second harmonic generation and multiphoton excitation fluorescence,”
J. Struct. Biol., 171
(2), 189
–196
(2010). http://dx.doi.org/10.1016/j.jsb.2010.04.006 JSBIEM 1047-8477 Google Scholar
T. Abrahamet al.,
“Minimally invasive multiphoton and harmonic generation imaging of extracellular matrix structures in lung airway and related diseases,”
Pulm. Pharmacol. Ther., 24
(5), 487
–496
(2011). http://dx.doi.org/10.1016/j.pupt.2011.03.008 PPTHFJ 1094-5539 Google Scholar
T. AbrahamJ. CarthyB. McManus,
“Collagen matrix remodeling in 3-dimensional cellular space resolved using second harmonic generation and multiphoton excitation fluorescence,”
J. Struct. Biol., 169
(1), 36
–44
(2010). http://dx.doi.org/10.1016/j.jsb.2009.07.023 JSBIEM 1047-8477 Google Scholar
N. K. Malaviaet al.,
“IL-13 induces a bronchial epithelial phenotype that is profibrotic,”
Respir. Res., 9 27
(2008). http://dx.doi.org/10.1186/1465-9921-9-27 RREEBZ 1465-993X Google Scholar
C. C. Wanget al.,
“Differentiation of normal and cancerous lung tissues by multiphoton imaging,”
J. Biomed. Opt., 14
(4), 044034
(2009). http://dx.doi.org/10.1117/1.3210768 JBOPFO 1083-3668 Google Scholar
I. Pavlovaet al.,
“Multiphoton microscopy as a diagnostic imaging modality for lung cancer,”
Proc. Soc. Photo Opt. Instrum. Eng., 7569 756918
(2010). SPIECJ 0361-0748 Google Scholar
R. M. WilliamsW. R. ZipfelW. W. Webb,
“Interpreting second-harmonic generation images of collagen I fibrils,”
Biophys. J., 88
(2), 1377
–1386
(2005). http://dx.doi.org/10.1529/biophysj.104.047308 BIOJAU 0006-3495 Google Scholar
P. ThevenazM. Unser,
“User-friendly semiautomated assembly of accurate image mosaics in microscopy,”
Microsc. Res. Tech., 70
(2), 135
–146
(2007). http://dx.doi.org/10.1002/(ISSN)1097-0029 MRTEEO 1059-910X Google Scholar
J. Schindelinet al.,
“Fiji: an open-source platform for biological-image analysis,”
Nat. Methods, 9
(7), 676
–682
(2012). http://dx.doi.org/10.1038/nmeth.2019 1548-7091 Google Scholar
F. LegareC. PfefferB. R. Olsen,
“The role of backscattering in SHG tissue imaging,”
Biophys. J., 93
(4), 1312
–1320
(2007). http://dx.doi.org/10.1529/biophysj.106.100586 BIOJAU 0006-3495 Google Scholar
G. HallK. W. EliceiriP. J. Campagnola,
“Simultaneous determination of the second-harmonic generation emission directionality and reduced scattering coefficient from three-dimensional imaging of thick tissues,”
J. Biomed. Opt., 18
(11), 116008
(2013). http://dx.doi.org/10.1117/1.JBO.18.11.116008 JBOPFO 1083-3668 Google Scholar
J. MertzL. Moreaux,
“Second-harmonic generation by focused excitation of inhomogeneously distributed scatterers,”
Opt. Commun., 196
(1–6), 325
–330
(2001). http://dx.doi.org/10.1016/S0030-4018(01)01403-1 OPCOB8 0030-4018 Google Scholar
W. R. Zipfelet al.,
“Live tissue intrinsic emission microscopy using multiphoton-excited native fluorescence and second harmonic generation,”
Proc. Natl. Acad. Sci. U. S. A., 100
(12), 7075
–7080
(2003). http://dx.doi.org/10.1073/pnas.0832308100 PNASA6 0027-8424 Google Scholar
M. Rivardet al.,
“The structural origin of second harmonic generation in fascia,”
Biomed. Opt. Express, 2
(1), 26
–36
(2011). http://dx.doi.org/10.1364/BOE.2.000026 BOEICL 2156-7085 Google Scholar
P. Xuet al.,
“A quasi-crystal model of collagen microstructure based on SHG microscopy,”
Chin. Opt. Lett., 8
(2), 213
–216
(2010). http://dx.doi.org/10.3788/COL COLHBT 1671-7694 Google Scholar
W. R. Rocheet al.,
“Subepithelial fibrosis in the bronchi of asthmatics,”
Lancet, 333
(8637), 520
–524
(1989). http://dx.doi.org/10.1016/S0140-6736(89)90067-6 LANCAO 0140-6736 Google Scholar
P. K. Jefferyet al.,
“Effects of treatment on airway inflammation and thickening of basement membrane reticular collagen in asthma. A quantitative light and electron microscopic study,”
Am. Rev. Respir. Dis., 145
(4 Pt 1), 890
–899
(1992). http://dx.doi.org/10.1164/ajrccm/145.4_Pt_1.890 ARDSBL 0003-0805 Google Scholar
P. K. Jefferyet al.,
“Bronchial biopsies in asthma. An ultrastructural, quantitative study and correlation with hyperreactivity,”
Am. Rev. Respir. Dis., 140
(6), 1745
–1753
(1989). http://dx.doi.org/10.1164/ajrccm/140.6.1745 ARDSBL 0003-0805 Google Scholar
M. Soderberget al.,
“Structural characterization of bronchial mucosal biopsies from healthy volunteers: a light and electron microscopical study,”
Eur. Respir. J., 3
(3), 261
–266
(1990). ERJOEI 0903-1936 Google Scholar
C. E. Brewsteret al.,
“Myofibroblasts and subepithelial fibrosis in bronchial asthma,”
Am. J. Respir. Cell Mol. Biol., 3
(5), 507
–511
(1990). http://dx.doi.org/10.1165/ajrcmb/3.5.507 AJRBEL 1044-1549 Google Scholar
S. H. Choet al.,
“Pathological changes according to the severity of asthma,”
Clin. Exp. Allergy, 26
(10), 1210
–1219
(1996). http://dx.doi.org/10.1111/cea.1996.26.issue-10 CLEAEN 1365-2222 Google Scholar
T. Abrahamet al.,
“Quantitative assessment of forward and backward second harmonic three dimensional images of collagen Type I matrix remodeling in a stimulated cellular environment,”
J. Struct. Biol., 180
(1), 17
–25
(2012). http://dx.doi.org/10.1016/j.jsb.2012.05.004 JSBIEM 1047-8477 Google Scholar
A. K. Larsson-Callerfeltet al.,
“Defective alterations in the collagen network to prostacyclin in COPD lung fibroblasts,”
Respir. Res., 14 21
(2013). http://dx.doi.org/10.1186/1465-9921-14-21 RREEBZ 1465-993X Google Scholar
H. Wanget al.,
“Cigarette smoke inhibits human bronchial epithelial cell repair processes,”
Am. J. Respir. Cell Mol. Biol., 25
(6), 772
–779
(2001). http://dx.doi.org/10.1165/ajrcmb.25.6.4458 AJRBEL 1044-1549 Google Scholar
|
|||||||||||||||||||||||||||||||||||||||||||||||||||||||||||||||||||||||||||||||||||||||||||||||||


