
|
|
1.IntroductionWith increasing population age, the incidence of age-related bone fracture has increased.1 While some of the increase of fracture incidence with age is related to loss of bone mass, a significant part of the risk is related to intrinsic bone quality. We wish to understand how changes in bone’s organic matrix lead to changes in bone toughness with aging, osteoporosis, and drug treatments. Bone’s composite nature, both mineral and organic phases, makes it particularly stiff and strong. The mineral within bone is responsible for much of bone’s stiffness, whereas the protein phase is largely responsible for the toughness.2 This division of toughness from the protein and stiffness from the mineral has been suggested by previous investigators and can further be demonstrated by removal of one of the phases experimentally: deproteinized bone is brittle and rigid; demineralized bone is tough and flexible.3 The importance of the mineral mass has been extensively studied in the literature.4–8 This investigation was focused upon the organic phase within bone because of its strong link to toughness, as it may explain age-related changes in bone fragility. Prior to failure, bone becomes visually white during mechanical loading; it stress-whitens. Stress-whitening has been associated with normal bone toughness by anecdotal observations that stress-whitening is less apparent in old bone, dry bone, more-mineralized bone, and bone that has damaged collagenous matrix—all conditions associated with weak and/or brittle tissue.9 The exact mechanism within bone causing stress-whitening and differences in toughness remain unclear. Our group10,11 and others12 have conducted studies that were consistent with stress-whitening being caused by a stress-induced densification and thinning of collagen fibrils, leading to an increase in Mie scattering. Other potential mechanisms include nanovoids,13 microcracks,14 and dilatational band formation15 in bone. All these mechanisms potentially increase bone toughness by dissipating mechanical energy. Our previous experiments demonstrated that stress-whitening occurred in a repeatable and reversible manner due to tensile loading of demineralized bone matrix.10,11 Light scattering in collagenous tissues has been attributed to Mie scattering particles (collagen fibrils) within a fluid phase.16 Hirshburg et al. found a negative correlation between collagen solubility in skin and the optical whiteness (noted in the study by the opposite, “optical clarity”) of the skin.17 In agreement with Hirshburg et al., we found previously that the unloaded demineralized bone samples were whitened by low solvents (i.e., ethanol).11 Consistent with optical clearing in skin, Genina et al. demonstrated that the cranial bone had reduced whiteness when solutions of glycerol were applied.18 As an extension, we previously demonstrated how the optical models for unloaded optical whiteness (noted in the literature by the opposite, “optical clarity”) could be used to explain stress-whitening.16 Stress-whitening, therefore, might be related to a decreased solubility of collagen, occurring as a result of mechanical stress and a resulting densification of collagen fibrils. Demineralized bone matrix is a biphasic material: organic and fluid. This densification of collagen fibrils leads to the organic phase having a greater refractive index and the fluid phase taking up a larger volume fraction. The optical properties of cranial bone have previously been investigated including quantifying the relationship between wavelength and scattering as well as the relationship between wavelength and absorption.18–20 The optical properties of bone also have been studied for the purpose of developing imaging and spectroscopy methods including applying near-infrared spectroscopy and optical coherent tomography within the skull.18,21 Optical techniques relying on optical properties have been used to assess bone’s composition: Fourier transform infrared absorption22 and Raman scattering.23 Understanding the optical properties is essential to understand stress-whitening, which is ultimately an optical effect. Our investigation was designed to directly measure the optical properties of demineralized bone matrix under mechanical load. It was motivated by our previous findings that stress-whitening and solvent-induced whitening occurred in demineralized bone specimens.11 Demineralized bone is essentially an organic protein phase, primarily type I collagen, and a fluid phase.24 Investigating possible changes in optical properties of demineralized bone matrix may give insight into the cause of stress-whitening. We hypothesize that the refractive index of the demineralized bone matrix () will increase as a result of mechanical loading in compression. Further, we hypothesize that both refractive index and the dependence of refractive index on mechanical loading will be decreased by immersing the specimens in ethanol during testing. 2.Methods2.1.MaterialsCompact bone samples were prepared from the distomedial quadrant of the diaphysis of the third metacarpal of three thoroughbred horses and stored at . Specimens were demineralized in a buffered [sodium citrate ()] formic acid (22.5%) solution by a method that was known to maintain the structural integrity of collagen.25 Sections () of matrix were prepared using a cryostat at . Sections were cut normal to the medial–lateral direction. The thickness of the samples was confirmed with a Dektak (Veeco Metrology Group, Santa Barbara, California) that measured the thickness of the samples to be . 2.2.Optical PropertiesDemineralized bone is essentially composed of an organic protein phase, primarily type I collagen, and a fluid phase.24 Mie scattering theory for biphasic materials has previously been used to model the dispersion of light in collagenous tissues.26 Mie scattering theory describes scattering by particles that are of a similar size to the wavelength of visible light such as collagen fibrils [20 to 500 nm (Ref. 27)] in bone matrix.28 The reduced scattering coefficient () for a two-phase material is the ratio of incident photon flux to the scattered flux normalized by the thickness of the scattering medium16,28,29 Equation (1) describes the scattering expected in collagenous tissues; is the radius of a scattering particle, is the wavelength of incident light, and is the volume of an individual particle causing scattering. The scattering equation has second-order dependence on the volume fraction of the collagen phase ().16 Scattering is at a maximum when and scattering is at a minimum when or 0, when the system has only a single phase. The ratio of the refractive index of the organic phase () to the refractive index of the surrounding fluid () has a large influence on scattering. The greater the difference in refractive index between the two phases, the greater the scattering. Both water and ethanol, the two fluids used in this investigation, have refractive indices below typical refractive indices of protein and collagenous tissues.28 Scattering within demineralized bone is therefore expected to increase with increasing refractive index of the collagenous phase. In general, refractive index of a material increases with both density and polarizability.30 (Polarizability is a fundamental property of matter and is experimentally measured as the ratio of the dipole moment to the electric field that causes it. Interaction between the electromagnetic field of matter and light is the cause of refraction.) The refractive index of the organic phase within collagenous tissues cannot be easily measured because it cannot be isolated from the fluid; for example, removing the fluid by lyophilization of specimens leaves voids, which is not an elimination of the second phase (water) but the replacement of the second phase with air. The apparent refractive index of a two-phase system can be approximated from Gladstone and Dale’s law of mixtures if the two phases are highly dispersed as in bone matrix The question remains what aspect of demineralized bone changes due to loading that causes the whiter appearance under mechanical load. Using Eq. (2) as a model, the volume fraction of the collagenous matrix () is not constant during loading because fluid (e.g., water or ethanol) can be drawn into or driven out of the tissue by loading. Therefore, the scattering [; Eq. (1)] increases or decreases with loading, as the fluid component moves. Equations (1) and (2) are model equations for demineralized bone, which couple changes in scattering with changes in apparent refractive index. 2.3.MethodsA surface force apparatus was used to measure the optical properties (refractive index; ) and thickness of the sections of matrix during compressive loading (Fig. 1): the specimens were deposited between two thin mica sheets (with outer faces silvered), creating an interferometer, sensitive to both the thickness and refractive index of the specimen.31,32 The mica sheets were glued to cylindrical glass-supporting disks: one fixed in the apparatus, and the other coupled to a cantilever spring. Fig. 1Compressive loading () of demineralized bone within surface force apparatus: collimated white light () is passed through specimens during compression. The resulting light was directed into a spectrometer and analyzed with multiple beam interferometry to determine the refractive index () and thickness () of the specimen. “” shows the direction over which the interference patterns are visualized (Fig. 2).  The optical setup used has previously been described.33,34 Samples were illuminated by a 100-W quartz-tungsten halogen lamp. The light was collimated and passed through an IR filter, reflected from a cold mirror and onto the sample. Light transmitted through the interferometer (silver–mica–sample–mica–silver) was magnified with a objective and directed into a 750-mm spectrometer with a 600-groove/mm diffraction grating (Acton, Acton, Massachusetts) and a slit opening of around 20 μm. The spectrometer was controlled with WinSpec software version 2.5.16.2 (Roper Scientific, Trenton, New Jersey) and our own custom software. Interference spectra were digitized using a CCD detector (Princeton Instruments, Trenton, New Jersey) with a resolution of 0.29 Å in wavelength and 1-μm lateral distance across the sample (Fig. 2). The uncertainty (0.03 Å) of the wavelength peak position was improved by fitting the spectra (IGOR, WaveMetrics, Portland, Oregon). Physical position changes with the -axis in the images from the spectrometer. Numerical spectral analysis of the constructive light interference patterns was undertaken to simultaneously determine the refractive index and thickness of the bone layer. A theoretical spectrum of stratified media can be calculated using the multilayer matrix method, which depends on both the refractive index and thickness of each layer in the interferometer.35 The properties of the bone layer were varied to find the values that allowed the best fit between the experimental and theoretical spectra. The fit was achieved by maximizing the fast spectral correlation fitting argument in MATLAB®.36 This parameter was calculated by first determining the wavelengths at which the peak intensities occurred in the experimental spectra (each peak was fit to a Lorentzian distribution) and then summing the corresponding intensities of the theoretical spectrum. When the calculated and measured spectra match, this value will be at a maximum, providing a unique solution for both the refractive index () and thickness () of the demineralized bone. A typical spectrum is shown in Fig. 2. Values for and were calculated for each pixel row from each image. The thickness and refractive index were determined as a function of lateral position in the demineralized bone sample by analyzing a series of compressive loading interferrence images (e.g., Fig. 2). Within each image, and values were averaged to obtain the value for that thickness and specimen.33 Fig. 2Interference spectra resulting from demineralized bone sample. Light from the specimen is separated based on wavelength () with a spectrometer and visualized. is the physical location within the specimen (Fig. 1). Constructive interference causes bright intensities (bright), while destructive interference causes no light signal (dark). The large distribution of refractive index present within the specimen was apparent from the discontinuous shape of the constructive interference. Constructive interference is predicted to occur as a periodic function of wavelength that is dependent on both specimen thickness and refractive index. 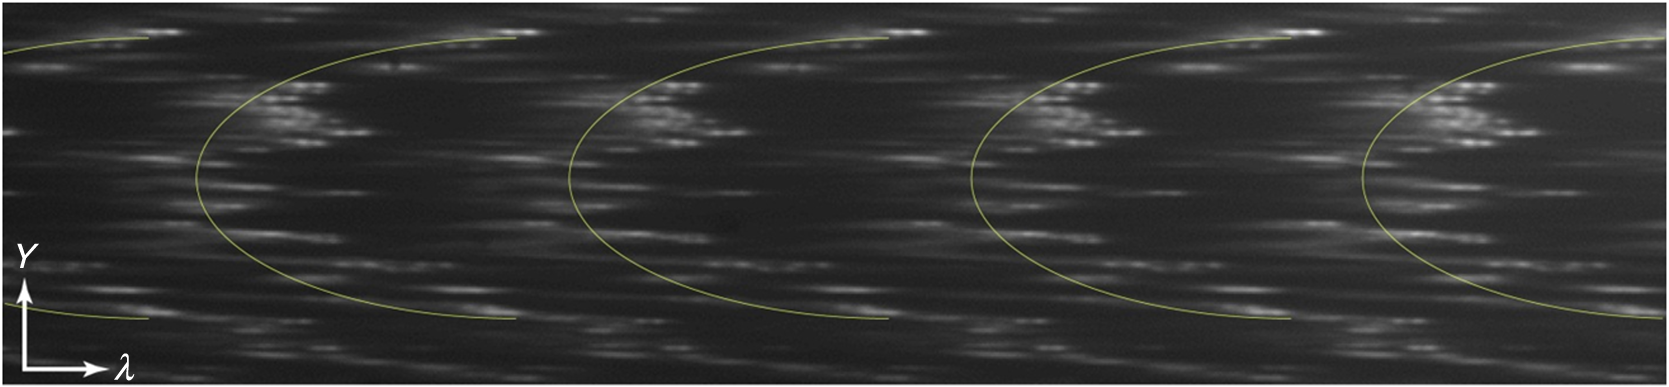 Loading was performed at room temperature with the specimens fully solvated by either deionized water () or ethanol (). Load was increased sequentially by deformation of a cantilever spring, supporting the lower surface. Changes in thickness () were expressed as a relative deformation (); this measure was calculated relative to the fully deformed thickness () of each specimen. This was done to account for any differences in specimen thickness. The definition used for was motivated by the following requirements: be positive and negatively related to . The fully deformed thickness was used over the unloaded height because of the relatively large error in unloaded thickness. The experiment was done in a load-controlled fashion with loads applied via the cantilever spring at discrete intervals; therefore, zero loads could only be determined to . The molecular volume fraction of the bone matrix () was estimated from the composite refractive index by rearranging Eq. (2). The refractive indices of both water () and ethanol (1.36) are well known. The value for the bone matrix was set to the refractive index of that previously measured for collagen fibrils (1.62) in the radial orientation.37 2.4.Statistical AnalysisA simple linear regression (R, The R Foundation for Statistical Computing, Vienna, Austria) was used to identify correlations between imposed force, deformation of the sample, and refractive index. Multivariable linear regression was used to look for a relationship combining the deformation of the sample with immersing fluid (ethanol or DI water) to predict the refractive index. Multiple variable linear regression was not pursued with the imposed force because of the obvious nonlinear relationship with refractive index that caused the residuals to be not uniformly distributed and because of the obvious linear relationship with imposed deformation. A specimen identifier was included within all regression analyses as a random effect, while all other parameters were included as fixed effects, and marginal was reported to quantify the variance explained by the fixed effects. 3.ResultsThe force–deformation relationship during compression of all samples was nonlinear; and specimens became stiffer with increasing load, resulting in thickness at high loads becoming insensitive to increased force (Fig. 3). The load () at which the specimens became insensitive (to increased loading) was variable between the samples. The large variability in the load at which insensitivity occurred was present within both groups (ethanol and water-immersed), thereby obscuring any possible difference between the ethanol- and water-immersed specimens. (Demineralized bone specimens did not adhere to the mica; therefore, tensile loading was not possible.) Fig. 3Thickness and refractive index variations of demineralized bone during compressive loading: an example of measured changes in average thickness, average refractive index, and changes in [calculated by Eq. (2)] during compression of specimens from both the ethanol and deionized water-immersed groups. Specimen thickness decreased linearly at low loads, and specimen thickness became insensitive at high loads. Refractive index behaved similarly to thickness, becoming insensitive to the changes in force at high loads. 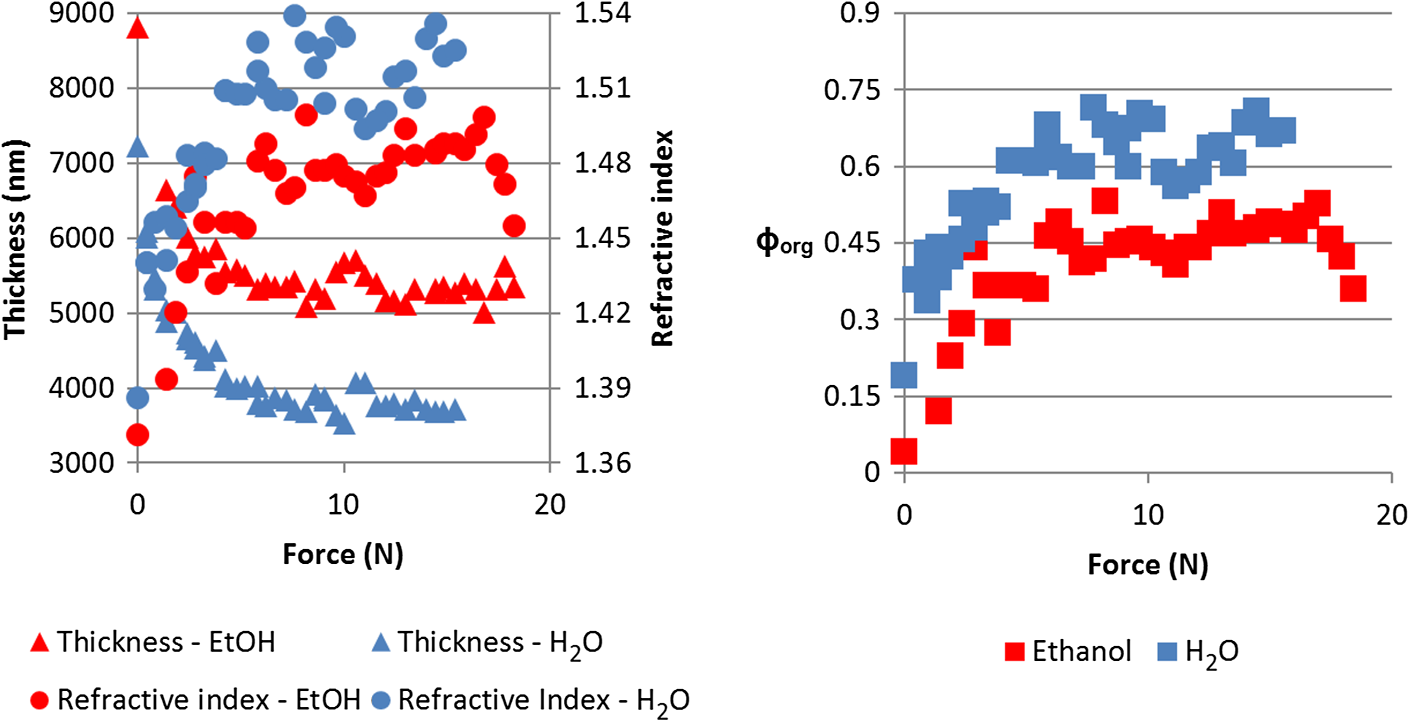 The refractive index was correlated with the imposed deformation (, ), force applied (, ), and immersing fluid () for uniformity. Refractive index increased with increasing load and was insensitive at high loads. Refractive index when insensitive to increased loading was significantly (-test, ) lower in ethanol ( corresponding to ) than in water ( corresponding to ). Multiple variable linear regression models did not show any improvement when more than one predictor variable were included. Specimens immersed in ethanol had lower refractive indices at all stages of loading (Fig. 3). Specimens in water had higher refractive indices, and the refractive indices were more sensitive to changes in thickness. Refreactive index variability was much greater within each individual specimen [] than between specimen averages (), indicating that the refractive index was very heterogeneous within the samples, possibly due to changes in orientation of collagen with position. Specimens immersed in ethanol appeared less transparent based upon the light observed at the spectrometer; however, this effect was not quantified. The volume fraction (unitless, range 0 to 1) of collagen [, Eq. (4)] varied linearly with deformation between 0.15 and 0.8, increasing with increasing deformation for specimens immersed in water and varied between 0.05 and 0.55 in ethanol. The linear relationship was consistent with the changes being due to pushing out the fluid phase, given that the fluid phase was nearly incompressible. 4.DiscussionThis investigation demonstrated a change in the optical properties of demineralized bone with applied load. The change in refractive index appeared to be related to the deformation of the specimen rather than the imposed load or force, given the linear relationship of apparent refractive index with relative deformation (Fig. 4). The values of refractive index () found were consistent with previous studies for mineralized bone osteons (),38 dry collagen (),39 and hydrated collagen fibrils ( to 1.62).37,40 Fig. 4Refractive index () and versus relative deformation: an example of the and plotted against the relative deformations. Relative deformation was calculated using Eq. (3).  This study was motivated by previous work within our laboratory that showed stress-whitening (an increase in light backscatter caused by tensile loading) in demineralized bone. This study was designed to more directly measure optical properties of demineralized bone. The findings of the present investigation were consistent with stress-whitening observed previously in specimens under tensile loading.10 The current understanding of the cause of the change in scattering due to mechanical loading is a contraction of collagen fibrils and an expression of the solvent within. Collagen fibril contraction and expression of solvent are expected to cause changes in the refractive index of both the whole construct and the collagen fibrils consistent with the observations made within this study. Specimens immersed in ethanol had lower refractive indices than those immersed in water. This was likely the result of a decrease in the volume fraction of the collagen because ethanol does not solvate collagen as well as water. Ethanol has lower hydrogen-bonding potential than water and therefore does not interact as strongly with the organic phase within the specimens, effectively shrinking the organic phase.41 Thus, hydrogen-bonding plays a key role in the material properties of bone. Collagen molecules will hydrogen-bond to other collagen molecules.42 The effect of dehydration has previously been studied in collagenous tissues by immersion in solutions with low Hansen hydrogen-bonding parameter ().41 Decreasing hydration has been shown to increase the stiffness and decrease the toughness of biological tissues.43 Solvation of the collagen lattice with water increases the toughness of bone matrix while simultaneously decreasing the stability of the collagen molecule.44 The values calculated for are only estimates of the values and are completely dependent upon the value of assumed in the calculation. In the present study, calculated values of varied over a large range (0.15 to 0.8). However, as stated above, has been variously reported as in the range of 1.4 to 1.62. Constraints on what values could have taken within the experiment do exist. cannot take values below the value of at any point; however, selecting values below 1.62, as was done above, would have increased the values calculated in Fig. 4. Further, the value for was assumed constant between the two immersing fluids, which was probably not correct given the differences in values observed in ethanol (1.48) and DI water. As a consequence, we conclude that the model equation [Eq. (2)] is too simple to fully capture the behavior of the tissue. Regardless, the dependence of apparent refractive index on applied loading was experimentally observed and, therefore, the hypothesis that load-induced changes in light scattering in bone are associated with changes in refractive index is supported. 4.1.Analysis of the Fluid Displacement EffectTo understand the mechanism that caused the change in refractive index, it was helpful to consider which parameters affected the specimen’s refractive index; according to Eq. (2), , , and all affect . The analysis presented below was focused on the load-induced changes in refractive index. The loads applied within this experiment were relatively low; the refractive index of water and ethanol was not expected to be strongly dependent on such low pressure, as such both and were assumed to be constant. Therefore, the two main mechanisms by which changed with load were by changes to or to . We examined the effect that these two properties were likely to have by examining them independently. The first remark to make about is that it was approximately related to the thickness () of the specimen where is the compressed volume of the specimen; is the volume of the organic constituent; and is the compressed area of the specimen. At this point in the analysis, no assumptions were made about the relationship of the volume of the organic constituent with respect to the thickness. Combining Eqs. (2) and (7) resulted in a dependence of with :Differences in specimen thickness (due to cryostat variability) can be accounted for by normalizing the data using the minimum (plateau) thickness, , under high loads yielding Further, we assumed that the area of the compressed specimen did not change with displacement. was put in terms of by combining Eqs. (8) and (10) to yield where , , , and () are all independent of . However, and are unknowns and more information was needed to predict the composite refractive index. The value of measured at maximum compression, , was used to predict the refractive indices ( against deformation) measured during the experiment. This has the effect of adjusting the model to match the experiment at exactly.Assuming that the changes in were entirely due to pushing fluid out of the specimen, then the volume of the organic component does not change (i.e., ), nor does the refractive index of the organic phase (i.e., ). Assumption that and do not change with means that Eq. (13) is true for all values of , and therefore Eq. (13) can be substituted into Eq. (1) These assumptions resulted in being dependent on , , and , which are all constant with . was therefore predicted to vary linearly with . Equation (14) represents values predicted to occur based purely on changes arising from the changes in volume fraction. The predictions [Eq. (14)] were similar to the data [Fig. 5, black line shows Eq. (14)]; but it was clear that the Eq. (14) did not explain everything observed experimentally. Equation (14) correlated with the experimental data (, ) better than simple linear models (, ) reported above. The values predicted by Eq. (14) were not as sensitive to changes in thickness as the experimental values were, particularly for the ethanol case (Fig. 5). The insensitivity of Eq. (14) implies that the assumptions made were not entirely correct. Fig. 5Predicted [black line, Eq. (14)] and experimental (markers) plotted against . Equation (14) was used to predict which required the assumption that the changes in were entirely due to pushing fluid out of the matrix. was more sensitive to than predicted, implying that both fluid flow and organic deformation contributed to the changes in . Different markers denote separate specimens.  The greater sensitivity than the predicted dependence implied that and/or may vary with . The refractive index, , may change with increasing load and compression due to structural rearrangements. Considering that decreasing occurred with increasing force, it was plausible that also decreased and that not all the changes in thickness [as assumed to derive Eq. (14)] resided with expulsion of fluid. In addition, the Lorentz–Lorenz equation predicts a positive relationship between refractive index and density.45 Therefore, increased values of would arise with decreased values of . The exact dependence of or on stress or strain was beyond the scope of this investigation and will be the subject of future work. 5.ConclusionRefractive index of demineralized bone samples increased with compression in a deformation-dependent manner. Refractive index values were lower and less sensitive to deformation when immersed in ethanol compared with deionized water. The changes in refractive index observed were likely the result of pushing fluid out of specimens due to loading and load-induced changes to the refractive index of the collagenous matrix—possibly caused by mechanically induced removal of fluid from the fibrils. This study has demonstrated that the optical properties of demineralized bone matrix change with load and surrounding environment in a manner consistent with stress-whitening. Stress-whitening is likely caused by a mechanism that dissipates mechanical energy—a greater ability to stress-whiten has been associated with tougher bone. Age-related changes in bone toughness (if attributable to stress-whitening) may be related to measurable changes in matrix optical properties. Understanding bone quality, particularly the stress-whitening mechanism investigated here, may lead to new therapeutic targets or possible noninvasive methods to assess bone quality. AcknowledgmentsSupported by National Institutes of Health AR040776. Acknowledgment is also made by DFK and TLK to the donors of the American Chemical Society Petroleum Research Fund for partial support of this research. ReferencesP. Kannuset al.,
“Epidemiology of hip fractures,”
Bone, 18
(1 Suppl), 57S
–63S
(1996). http://dx.doi.org/10.1016/8756-3282(95)00381-9 8756-3282 Google Scholar
R. RitchieM. BuehlerP. Hansma,
“Plasticity and toughness in bone,”
Phys. Today, 62
(6), 41
–47
(2009). http://dx.doi.org/10.1063/1.3156332 PHTOAD 0031-9228 Google Scholar
X. Wanget al.,
“Effects of collagen unwinding and cleavage on the mechanical integrity of the collagen network in bone,”
Calcif. Tissue Int., 71
(2), 186
–192
(2002). http://dx.doi.org/10.1007/s00223-001-1082-2 CTINDZ 0171-967X Google Scholar
L. Mulderet al.,
“The influence of mineralization on intratrabecular stress and strain distribution in developing trabecular bone,”
Ann. Biomed. Eng., 35
(10), 1668
–1677
(2007). http://dx.doi.org/10.1007/s10439-007-9345-3 ABMECF 0090-6964 Google Scholar
T. E. Ciarelliet al.,
“Vertebral fracture in humans is associated with lower variability in trabecular packet mineralization in the ilium,”
in Orthop. Res. Soc. Meeting (Abstract),
31
(2005). Google Scholar
G. BoivinP. J. Meunier,
“The degree of mineralization of bone tissue measured by computerized quantitative contact microradiography,”
Calcif. Tissue Int., 70
(6), 503
–511
(2002). http://dx.doi.org/10.1007/s00223-001-2048-0 CTINDZ 0171-967X Google Scholar
I. Manjubalaet al.,
“Spatial and temporal variations of mechanical properties and mineral content of the external callus during bone healing,”
Bone, 45
(2), 185
–192
(2009). http://dx.doi.org/10.1016/j.bone.2009.04.249 8756-3282 Google Scholar
C. Tjhiaet al.,
“Relating micromechanical properties and mineral densities in severely suppressed bone turnover patients, osteoporotic patients, and normal subjects,”
Bone, 51
(1), 114
–122
(2012). http://dx.doi.org/10.1016/j.bone.2012.04.010 8756-3282 Google Scholar
J. D. Currey, Bone: Structure and Mechanics, 456 Princeton University Press, Princeton
(2006). Google Scholar
M. R. Hardistyet al.,
“Stress-whitening occurs in demineralized bone,”
Bone, 57
(2), 367
–374
(2013). http://dx.doi.org/10.1016/j.bone.2013.08.029 8756-3282 Google Scholar
M. R. Hardistyet al.,
“Do stress-whitening and optical clearing of collagenous tissue occur by the same mechanism?,”
J. Biomech., 46
(14), 2411
–2418
(2013). http://dx.doi.org/10.1016/j.jbiomech.2013.07.026 JBMCB5 0021-9290 Google Scholar
Z. Xuet al.,
“Spectroscopic visualization of nanoscale deformation in bone: interaction of light with partially disordered nanostructure,”
J. Biomed. Opt., 15
(6), 060503
(2010). http://dx.doi.org/10.1117/1.3514633 JBOPFO 1083-3668 Google Scholar
X. Sunet al.,
“Visualization of a phantom post-yield deformation process in cortical bone,”
J. Biomech., 43
(10), 1989
–1996
(2010). http://dx.doi.org/10.1016/j.jbiomech.2010.03.011 JBMCB5 0021-9290 Google Scholar
P. J. Thurneret al.,
“High-speed photography of the development of microdamage in trabecular bone during compression,”
J. Mater. Res., 21
(5), 1093
–1100
(2006). http://dx.doi.org/10.1557/jmr.2006.0139 JMREEE 0884-2914 Google Scholar
A. A. Poundariket al.,
“Dilatational band formation in bone,”
Proc. Natl. Acad. Sci. U. S. A., 109
(47), 19178
–19183
(2012). http://dx.doi.org/10.1073/pnas.1201513109 PNASA6 0027-8424 Google Scholar
C. RylanderO. StumppT. Milner,
“Dehydration mechanism of optical clearing in tissue,”
J. Biomed. Opt., 11
(4), 041117
(2006). http://dx.doi.org/10.1117/1.2343208 JBOPFO 1083-3668 Google Scholar
J. Hirshburget al.,
“Collagen solubility correlates with skin optical clearing,”
J. Biomed. Opt., 11
(4), 040501
(2006). http://dx.doi.org/10.1117/1.2220527 JBOPFO 1083-3668 Google Scholar
E. A. GeninaA. N. BashkatovV. V. Tuchin,
“Optical clearing of cranial bone,”
Adv. Opt. Technol., 2008
(2008), 8
(2008). http://dx.doi.org/10.1155/2008/267867 1687-6393 Google Scholar
A. N. Bashkatovet al.,
“Optical properties of human cranial bone in the spectral range from 800 to 2000 nm,”
Proc. SPIE, 6163 616310
(2006). http://dx.doi.org/10.1117/12.697305 PSISDG 0277-786X Google Scholar
J. BehariS. K. GuhaP. N. Agarwal,
“Absorption spectra of bone,”
Calcif. Tissue Res., 23
(1), 113
–114
(1977). http://dx.doi.org/10.1007/BF02012774 CATRBZ 0008-0594 Google Scholar
M. Firbanket al.,
“Measurement of the optical properties of the skull in the wavelength range 650–950 nm,”
Phys. Med. Biol., 38
(4), 503
–510
(1993). http://dx.doi.org/10.1088/0031-9155/38/4/002 PHMBA7 0031-9155 Google Scholar
A. BoskeyN. P. Camacho,
“FT-IR imaging of native and tissue-engineered bone and cartilage,”
Biomaterials, 28
(15), 2465
–2478
(2007). http://dx.doi.org/10.1016/j.biomaterials.2006.11.043 BIMADU 0142-9612 Google Scholar
M. D. MorrisG. S. Mandair,
“Raman assessment of bone quality,”
Clin. Orthop. Relat. Res., 469
(8), 2160
–2169
(2011). http://dx.doi.org/10.1007/s11999-010-1692-y CORTBR 0009-921X Google Scholar
W. R. WalshD. L. Christiansen,
“Demineralized bone matrix as a template for mineral—organic composites,”
Biomaterials, 16
(18), 1363
–1371
(1995). http://dx.doi.org/10.1016/0142-9612(95)96871-V BIMADU 0142-9612 Google Scholar
Y. N. Yeniet al.,
“Prestress due to dimensional changes caused by demineralization: a potential mechanism for microcracking in bone,”
Ann. Biomed. Eng., 30
(2), 217
–225
(2002). http://dx.doi.org/10.1114/1.1451078 ABMECF 0090-6964 Google Scholar
V. Tuchin,
“Optical properties of tissues with strong (multiple) scattering,”
in Tissue Optics. Light Scattering Methods Instruments for Medical Diagnosis,
3
–142
(2000). Google Scholar
J. Y. RhoL. Kuhn-SpearingP. Zioupos,
“Mechanical properties and the hierarchical structure of bone,”
Med. Eng. Phys., 20
(2), 92
–102
(1998). http://dx.doi.org/10.1016/S1350-4533(98)00007-1 MEPHEO 1350-4533 Google Scholar
H. Liuet al.,
“Dependence of tissue optical properties on solute-induced changes in refractive index and osmolarity,”
J. Biomed. Opt., 1
(2), 200
–211
(1996). http://dx.doi.org/10.1117/12.231370 JBOPFO 1083-3668 Google Scholar
I. S. SaidiS. L. JacquesF. K. Tittel,
“Mie and Rayleigh modeling of visible-light scattering in neonatal skin,”
Appl. Opt., 34
(31), 7410
–7418
(1995). http://dx.doi.org/10.1364/AO.34.007410 APOPAI 0003-6935 Google Scholar
É. Lalor,
“A note on the Lorentz-Lorenz formula and the Ewald-Oseen extinction theorem,”
Opt. Commun., 1
(2), 50
–52
(1969). http://dx.doi.org/10.1016/0030-4018(69)90004-2 OPCOB8 0030-4018 Google Scholar
J. IsraelachviliG. Adams,
“Measurement of forces between two mica surfaces in aqueous electrolyte solutions in the range 0–100 nm,”
J. Chem. Soc. Faraday Trans. 1 , 74 975
–1001
(1978). http://dx.doi.org/10.1039/f19787400975 0300-9599 Google Scholar
M. HeubergerG. LuengoJ. Israelachvili,
“Topographic information from multiple beam interferometry in the surface forces apparatus,”
Langmuir, 13
(14), 3839
–3848
(1997). http://dx.doi.org/10.1021/la960942a LANGD5 0743-7463 Google Scholar
R. Orozco-AlcarazT. L. Kuhl,
“Interaction forces between DPPC bilayers on glass,”
Langmuir, 29
(1), 337
–343
(2013). http://dx.doi.org/10.1021/la3039329 LANGD5 0743-7463 Google Scholar
N. W. MooreD. J. MulderT. L. Kuhl,
“Adhesion from tethered ligand-receptor bonds with microsecond lifetimes,”
Langmuir, 24
(4), 1212
–1218
(2008). http://dx.doi.org/10.1021/la702202x LANGD5 0743-7463 Google Scholar
M. Clarkson,
“Multiple-beam interferometry with thin metal films and unsymmetrical systems,”
J. Phys. D. Appl. Phys., 22 475
–482
(1989). http://dx.doi.org/10.1088/0022-3727/22/4/001 JPAPBE 0022-3727 Google Scholar
M. Heuberger,
“The extended surface forces apparatus. Part I. Fast spectral correlation interferometry,”
Rev. Sci. Instrum., 72
(3), 1700
–1707
(2001). http://dx.doi.org/10.1063/1.1347978 RSINAK 0034-6748 Google Scholar
S. LeesN. TaoS. Lindsay,
“Studies of compact hard tissues and collagen by means of Brillouin light scattering,”
Connect. Tissue Res., 24
(3–4), 187
–205
(1990). CVTRBC 0300-8207 Google Scholar
A. AscenziC. Fabry,
“Technique for dissection and measurement of refractive index of osteones,”
J. Biophys. Biochem. Cytol., 6
(1), 139
–142
(1959). http://dx.doi.org/10.1083/jcb.6.1.139 JBBCAH 0095-9901 Google Scholar
D. Maurice,
“The structure and transparency of the cornea,”
J. Physiol., 136
(2), 263
–286
(1957). JPHYA7 0022-3751 Google Scholar
K. M. MeekS. DennisS. Khan,
“Changes in the refractive index of the stroma and its extrafibrillar matrix when the cornea swells,”
Biophys. J., 85
(4), 2205
–2212
(2003). http://dx.doi.org/10.1016/S0006-3495(03)74646-3 BIOJAU 0006-3495 Google Scholar
R. K. Nallaet al.,
“Effects of polar solvents on the fracture resistance of dentin: role of water hydration,”
Acta Biomater., 1
(1), 31
–43
(2005). http://dx.doi.org/10.1016/j.actbio.2004.08.002 ABCICB 1742-7061 Google Scholar
N. KuznetsovaS. ChiS. Leikin,
“Sugars and polyols inhibit fibrillogenesis of type I collagen by disrupting hydrogen-bonded water bridges between the helices,”
Biochemistry, 37
(34), 11888
–11895
(1998). http://dx.doi.org/10.1021/bi980089+ MIRBD9 0144-0578 Google Scholar
Z. L. Shenet al.,
“Stress-strain experiments on individual collagen fibrils,”
Biophys. J., 95
(8), 3956
–3963
(2008). http://dx.doi.org/10.1529/biophysj.107.124602 BIOJAU 0006-3495 Google Scholar
J. Yanet al.,
“Fracture toughness and work of fracture of hydrated, dehydrated, and ashed bovine bone,”
J. Biomech., 41
(9), 1929
–1936
(2008). http://dx.doi.org/10.1016/j.jbiomech.2008.03.037 JBMCB5 0021-9290 Google Scholar
G. G. Fuller,
“Optical rheometry,”
Annu. Rev. Fluid Mech., 22
(1), 387
–417
(1990). http://dx.doi.org/10.1146/annurev.fl.22.010190.002131 ARVFA3 0066-4189 Google Scholar
BiographyMichael R. Hardisty is a postdoctoral scholar in the Department of Orthopaedic Surgery at the University of California, Davis. He received his Bachelor of Engineering Science and Master of Biomedical Engineering from the University of Toronto. He obtained his PhD degree in biomedical engineering from the University of California, Davis. His research interests include bone biomechanics; bone quality; medical image analysis; collagenous tissue toughness; fracture mechanics; and finite element modeling. Daniel F. Kienle is a doctoral student in the Department of Chemical Engineering and Materials Science at the University of California at Davis, studying under Professor Tonya Kuhl. His research interests include interfacial phenomena and properties of thin films and confined liquids. Current work uses the surface force apparatus to measure the interaction between hydrophobic surfaces in water and the properties of the confined water. Tonya L. Kuhl is a professor of chemical engineering and materials science, biomedical engineering, and a faculty member of the Biophysics Graduate Group at the University of California, Davis. She received her bachelor’s in chemical engineering from the University of Arizona and a PhD degree in chemical engineering from the University of California, Santa Barbara (UCSB). Her research interests are in the general area of intermolecular and intersurface forces in complex fluid systems. Susan M. Stover is a veterinarian and director of the JD Wheat Veterinary Orthopedic Research Laboratory at the University of California at Davis. She received her bachelor’s and DVM degrees from Washington State. She obtained her PhD degree from the University of California, Davis. Her research interests are biomechanics of repetitive, overuse injuries in elite equine athletes, and osteoporosis in horses with chronic granulomatous pulmonary disease. David P. Fyhrie is a professor of orthopaedic surgery and biomedical engineering and holds the David Linn Chair in Orthopaedic Surgery at the University of California, Davis. He received his bachelor’s in mechanical engineering at Gonzaga University, and his master’s and PhD in mechanical engineering from Stanford University. His research interests include bone biomechanics, bone remodeling, cartilage mechanical properties, bone cell mechanobiology, bone remodeling, fracture mechanics, and finite element modeling. |


