
|
|
1.IntroductionThe type 2 cannabinoid receptors () are G protein-coupled receptors (GPCR) that belong to the endocannabinoid signaling system. They play a fundamental role in the regulation of a variety of physiopathological processes involving the immune system, including diseases that affect the cardiovascular and respiratory systems, bone remodeling and gastrointestinal, and liver diseases.1 Under healthy conditions, high- expression is present only in B cells of the immune system that are localized in spleen and lymph nodes.2 In a number of additional cell types under disease conditions, expression is greatly up-regulated.3 The richness of involvement has positioned the receptor as an attractive therapeutic target for treating an array of pathologies, such as cancers,4,5 neurodegenerative diseases,2,6 inflammation,7,8 pain,9 osteoporosis,10 immunological disorders,11–13 and drug abuse.14 As such, there has been an explosion of research over the past 12 years that focused on the biology and therapeutic promises of . However, the precise role of in the regulation of diseases remains unclear.15 The ability to specifically image would contribute to develop reliable -based therapeutic approaches with a better understanding of the mechanism of action in these diseases. Molecular imaging (MI) has emerged as a valuable tool for the visualization, characterization, and measurement of biological processes at the molecular and cellular levels in humans and other living systems.16 To overcome the current challenge of identifying , we therefore set out to develop MI tools that can specifically label , quantify the expression level and image the receptor in a living system. One clear strength of -targeted MI agents is the potential for high-contrast imaging. expression is high only in spleen and lymph nodes, and low—or even undetectable—in brain, thyroid, retina, placenta, skeletal muscle, kidney, liver, adrenal gland, heart, prostate, and ovary.17,18 This allows for imaging of physiological activity in the immune system with low background elsewhere. In certain pathological conditions, expression is greatly up-regulated in the diseased cells. For example, is over-expressed in various types of cancers,19 endometrial inflammation,20 and atherosclerotic plaques.21 expression also increases in diseased central nervous system cells, including astrocytomas,22 activated microglia and neurons,14,15,23 astrocytes of Alzheimer’s disease,24 as well as T-lymphocytes, microglia, and astrocytes in multiple sclerosis.25 Because expression is nearly absent in these areas under basal conditions, and increases as much as 100-fold in diseases,3 imaging can achieve a high-imaging contrast in diseased tissues. Accordingly, is a promising target for MI applications. imaging remains a largely unexplored field. Few contrast agents that can identify the receptor specifically at the cellular scale have been developed. We recently reported a -targeted near-infrared (NIR) fluorescent probe, NIR760-mbc94, which was successfully used to image the receptor in vitro and in vivo.26 Although the specific binding of NIR760-mbc94 to has been demonstrated, the probe also showed nonspecific binding. Specifically, SR144528, a ligand, partially inhibited the uptake of NIR760-mbc94 in vitro (40%) and ex vivo (35%).26 Recently, Dr. Frangioni’s group found that replacing charged NIR fluorescent dyes with a zwitterionic () NIR dye significantly reduced the nonspecific binding of integrin -targeted imaging agents.27 Inspired by this report, in this study, we introduced zwitterionic properties into our -targeted agents. We found that our zwitterionic probe, ZW760-mbc94, enhanced blocking effect from 40% to 50% in vitro and 35% to 47% ex vivo when compared with NIR760-mbc94. Such improvement may greatly improve the outcome of -targeted imaging. 2.Methods and Materials2.1.Synthesis of -Targeted Zwitterionic NIR Probe ZW760-mbc94The solvents used are of commercial grade. The precursor dye ZW-Cl and the ligand mbc94 were synthesized using the previously reported procedure.18,28 A Biotage (Charlotte, North Carolina) microwave reactor (model: US/JPN 356007) was employed for the synthesis of the dye ZW760. Flash column chromatography was performed on a Teledyne ISCO (Lincoln, Nebraska) (combiflash RF) purification system with silica gel (standard grade, 60A, Sorbtech, Norcross, Georgia) or C18-reversed phase silica gel (20 to 40 μm, RediSepRf). and nuclear magnetic resonance (NMR) spectra were recorded on a Brucker Avance III 400-MHz instrument. Mass spectra were recorded on a Waters LCT Premier mass spectrometer. UV/Vis spectra were recorded on a Cary 100 Bio UV−Vis spectrophotometer, and fluorescence spectra were recorded on a Cary Eclipse fluorescence spectrophotometer. ZW760. Dye ZW-Cl (70 mg, 78 μM), 4-Carboxyphenylboronic acid (20 mg, 120 μM) and catalyst tetrakis(triphenylphosphine)palladium(0) were suspended in water (7 mL). The mixture was heated to 160°C and stirred at this temperature for 30 min under the microwave reactor. ZW760 was collected as a green solid (15 mg, 20%) after purification over a C18-reversed phase column using (20% MeOH to 100% MeOH) as the eluent. NMR (-MeOD): (d, 2 H, ), 7.97 (d, 2 H, ), 7.74 (d, 2 H, ), 7.68 (s, 2 H), 7.16-7.2 (m, 3 H), 7.09 (d, 2 H, ), 6.24 (d, 2 H, ), 3.98 (br.s, 4 H), 3.51 to 3.55 (m, 4 H), 3.16 (s, 18 H), 2.79 (t, 4 H, ), 2.18 (br.s, 4 H), 2.06 to 2.09 (m, 2 H), 1.07 (s, 12 H). MS (ESI): , calcd. for . ZW760-mbc94. A mixture of ZW760 (11 mg, 11 μmol), HBTU (5 mg, 13 μmol), and HOBt (1.8 mg, 13 μmol) in anhydrous DMF (2.5 mL) was stirred at room temperature for 10 min. DIEA (3 μL, 17 μmol) was then added and the resulting mixture was stirred for another 10 min. After a solution of mbc94 (7 mg, 12 μmol) in anhydrous DMF (1 mL) was added, the reaction mixture was stirred at room temperature under argon atmosphere in the absence of light for 24 h. The solvent was then removed by rotary evaporation and the resulting solid was purified by semipreparative high-performance liquid chromatography using a Phenomenex (Torrance, California) Luna C-18 column () at a flow rate of . Flow A was 0.1% trifluoroacetic acid (TFA) in water and flow B was 0.1% TFA in acetonitrile. The elution method started with a linear gradient from 40% to 100% B over 30 min, held at 100% B for 5 min, and finally returned to 40% B over 5 min. After being dried by lyophilization, ZW760-mbc94 (3.4 mg, 20%) was obtained as a green solid. NMR (-MeOD): (t, 1H, ), 8.15 (d, 2 H, ), 7.82(dd, 2 H, & 1.6 Hz), 7.7 (s, 2 H), 7.5 (d, 2 H, ), 7.4 (, 1 H, ), 7.32 to 7.37 (m, 6 H), 7.27 (d, 2 H, ), 7.2 (dd, 1 H, & 1.6 Hz), 7.12 (d, 2 H, ), 6.85 (s, 1 H), 6.32 (d, 2 H, ), 5.51 (s, 2 H), 4.2 (m, 5 H), 3.77 (, 1 H, ), 3.48 to 3.58 (m, 6 H), 3.17 (s, 18 H), 3.07 (t, 2 H, ), 2.8 (t, 4 H, ), 2.36 (s, 3 H), 2.26 to 2.28 (m, 4 H), 2.06 to 2.07 (m, 2 H), 1.73 to 1.80 (m, 7 H), 1.49 to 1.53 (m, 6 H), 1.19 (s, 12 H), 1.16 (s, 3H), 1.09 (s, 3 H), 0.87 (s, 3 H). NMR (-MeOD): , 168.65, 164.14, 150.58, 144.58, 143.44, 142.02, 139.76, 138.04, 136.51, 135.78, 135.72, 134.18, 132.57, 132.24, 131.67, 131.64, 130.92, 130.58, 128.95, 128.88, 128.61, 128.19, 121.32, 111.30, 108.21, 101.97, 64.91, 64.52, 53.77, 43.69, 40.71, 31.48, 30.49, 28.12, 28.02, 27.83, 27.54, 26.90, 25.55, 22.17, 21.67, 20.04. MS (ESI): , calcd. for . 2.2.Cell Culture and Animal ModelA mouse malignant astrocytoma cell line transfected with , -mid delayed brain tumor (DBT), which expresses at endogenous level, was used to test the efficiency of the probe in vitro and in vivo.29 Cells were cultured in Dulbecco’s-modified Eagle’s medium supplemented with 10% heat-inactivated fetal bovine serum, 4-mM glutamine, penicillin and streptomycin. Subcutaneous tumors of -mid DBT were induced subcutaneously into the flank of 6- to 8-week-old female Nu/nu mice by injecting subconfluent cells in 100-μL phosphate buffered saline (PBS). All studies were performed in accordance with institutional guidelines for animal use after obtaining approval for the experimental protocols from University of Pittsburgh. 2.3.In Vitro Saturation Binding AssayIntact cell saturation binding assay was carried out to determine the binding affinity of ZW760-mbc94 to using a similar method as we previously reported.26 Briefly, -mid DBT cells were seeded onto 96 well optical bottom plates with 5000 cells per well and incubated for 24 h. Hank’s balanced salt solution with 1 mM , 0.1% BSA, 0.1% was used as the binding buffer. Cells were incubated for 30 min with an increasing concentration of ZW760-mbc94 (2.0, 5.0, 10.0, 40.0, 100.0, and 160.0 nM) at 37°C. For nonspecific binding measurements, 1 μM (final concentration) of the blocking agent 4-Quinolone-3-Carboxamide (4Q3C, Cayman Chemicals) was added with ZW760-mbc94 to each well, while for total binding measurements, no blocking agent was added. Cells were then rinsed with serum free medium and fluorescence intensity at 790 nm (relative fluorescence units) was recorded with a Synergy H4 hybrid multimode microplate reader. DRAQ-5, a commonly used cell nuclear DNA labeling dye, was used to normalize cell numbers based on fluorescence intensity at 690 nm (excited at 650 nm) using the protocol provided by the manufacturer. The specific binding was obtained by the subtraction of nonspecific binding from total binding. The dissociation constant (Kd) and receptor density (Bmax) were estimated from the nonlinear fitting of specific binding versus of ZW760-mbc94 concentration using Prism software (GraphPad Prism 6.01, San Diego, California). 2.4.In Vitro Fluorescence Imaging of ZW760-mbc94Fluorescence microscopy was performed using a Zeiss Axio Observer (Carl Zeiss MicroImaging, LLC, Thornwood, New York) fluorescence microscope equipped with the ApoTome 2 imaging system. ZW760-mbc94 or ZW-acid (free dye control) fluorescence images were captured using a NIR camera with an indocyanine green (ICG) filter set (excitation/emission: 750 to to 875 nm). Nuclear images were obtained with a 4',6-diamidino-2-phenylindole (DAPI) filter set (excitation/emission: 335 to to 470 nm). Differential interference contrast (DIC) images were obtained through Trans light DIC. A multiplate reader system (Synergy H4) was used for quantitative analysis of the fluorescent probe uptake (). Cells were divided to four groups to test the binding specificity of ZW760-mbc94 to : (1) -mid DBT cells treated with 5 μM of ZW760-mbc94 for 30 min; (2) -mid DBT cells treated with 5 μM of ZW760-mbc94 together with 10 μM of 4Q3C as the blocking agent for 30 min; (3) -mid DBT cells treated with 5 μM of free ZW760 dye without targeting moiety for 30 min; and (4) wild type (WT) DBT-cells (-)-treated with 5 μM of ZW760-mbc94 for 30 min. All experiments were carried out at 37°C. -mid DBT cells and WT DBT-cells were plated at 5000 cells per well in 8-well chamber slides (for fluorescence microscopy) or 96-well plates (for quantitative optical imaging using multiplate reader) 24 h before the treatment. ZW760-mbc94 with or without 4Q3C, or free ZW760 was added to cells in culture medium. After being incubated for 30 min, the cells were washed three times with serum-free medium and fixed with 4% paraformaldehyde/PBS for 20 min at room temperature. The cell nucleus was stained with DAPI for 15 min at room temperature. Each group of cells was triplicated. 2.5.In Vivo Optical ImagingAnimal experiments were conducted in accordance with the guidelines for the Care and Use of Laboratory Animals of the Medical Research Council of University of Pittsburgh. NIR-based fluorescent imaging was performed with a Xenogen IVIS Spectrum imaging system (IVIS Lumina XR; excitation, 745 nm; emission, 800 nm; exposure time, 1 s; binning, small; field of view, 10; , 2; open filter). Imaging and quantification of signals were controlled by the acquisition and analysis software Living Image 2.5 software (Xenogen, Alameda, California). Experiments with tumor-bearing mice were performed 10 days after the injection of tumor cells when the tumor size reached 6 to 7 mm in diameter. Mice were divided into three groups, each of which was injected with the following agents (dissolved in 100-μL saline) via the tail vein: three mice with 10-nmol ZW760-mbc94, three with 10-nmol 4Q3C, and three with 10-nmol free ZW760 dye. Mice were anesthetized by continuous exposure to 2.5% isoflurane. Images at the following time points were collected: preinjection, 0.02-, 0.5-, 1-, 2-, 4-, 6-, 12-, 24-, 48-, and 72-h postinjection (PI). The signal intensity was expressed as the average radiance . To determine tumor contrast, the radiant efficiency of the tumor area at the right flank of the animal (T) and of the area at the left leg muscle [normal tissue (N)] was calculated by the region of interest (ROI) function of Living Image software. The ratio of T/N is the contrast between the tumor and normal tissue. 2.6.Ex Vivo Optical Imaging and BiodistributionAfter the last imaging time point (72-h PI), tumor-bearing mice were sacrificed by cervical dislocation under isoflurane anesthesia. The tumor and organs (blood, heart, lung, liver, spleen, pancreas, kidney, muscle, and brain) were collected for ex vivo optical imaging studies and biodistribution analysis. The ex vivo imaging contrast was calculated by comparing the average fluorescence intensities in the tumor with that in the left leg muscle from the same animal. 2.7.Statistical AnalysisAll of the data were given as the of independent measurements. The results were evaluated using the IBM statistical software (SPSS Statistics version 21). Student’s -test (two tailed) was applied for the analysis of statistical differences. value was considered to be statistically significant. 3.Results and DiscussionThe structure of the -targeted zwitterionic probe, ZW760-mbc94, was designed with the following considerations: (1) We chose mbc94 as the targeting moiety, which was previously reported by us to have specific binding to .3,18,26 (2) We developed a novel zwitterionic NIR dye, ZW760, which has a robust linkage at the meso position of the polymethine chain, as compared with the enol ether linkage in the recently reported ZW800 dyes.28 Previous studies indicate that heptamethine cyanine dyes with an enol ether linkage have significant stability issues, which can be overcome by replacing the enol ether with a linkage.26,30 In addition, the carboxylate group on ZW760 allows for universal conjugation to various targeting moieties. ZW760-mbc94 was synthesized by following the pathway described in Fig. 1. Briefly, we first prepared ZW-Cl and mbc94 using the previously reported methods.18,28 Next, Suzuki-Miyaura coupling reaction between 4-carboxyphenylboronic acid and ZW-Cl in the presence of yielded ZW760. Finally, mbc94 was coupled to ZW760 using an amide-coupling reaction. Upon the syntheses of ZW760 and ZW760-mbc94, we characterized the spectroscopic properties of these two-fluorescent molecules. When dissolved in methanol or dimethyl sulfoxide (DMSO), ZW760 molecules exist mainly as monomers at a concentration of 1 μM, as indicated by the absorption spectra (Fig. 2). ZW760 showed an intense absorption peak at 786 nm with a weak shoulder at 720 nm in DMSO. The small-shoulder peak is ascribed to the well-known H-type aggregation.31 The shape of the ZW760 absorption spectrum in methanol is similar to that in DMSO, except that the absorption peak is blue shifted for 20 nm. ZW760 exhibited strong NIR fluorescence in methanol and DMSO. The fluorescent peak is located at 805 and 786 nm in DMSO and methanol, respectively. When water was used as the solvent, ZW760 showed two major absorption bands at 681 and 756 nm with molar extinction coefficient of and , respectively. As discussed above, the strong absorption at 681 nm is ascribed to the H-aggregation of the dye in water. The aggregation of ZW760 in water was further evidenced by the concentration dependent absorption studies. When the concentration of ZW760 increased from to in water, the intensity of the two absorption bands increased simultaneously [Fig. 3(a)]. However, the ratio of absorption at increased greatly [Fig. 3(b)], indicating enhanced H-aggregation at higher concentration. As expected, the fluorescence quantum yields decreased dramatically when concentration increased [Fig. 3(e)]. Due to the reabsorption effect at high concentration,32 the fluorescent peaks are red shifted gradually from 775 to 781 nm [Figs. 3(c) and 3(d)]. Fig. 2UV–Vis absorption and emission of ZW760 and ZW760-mbc94 in water at a concentration of 1 μM ().  Fig. 3The concentration-dependent spectra of ZW760 in water. (a) UV–Vis absorption spectra; (b) absorption spectra normalized at 720 nm; (c) emission spectra; (d) the normalized emission spectra (); and (e) the concentration-dependent fluorescence quantum yield change. 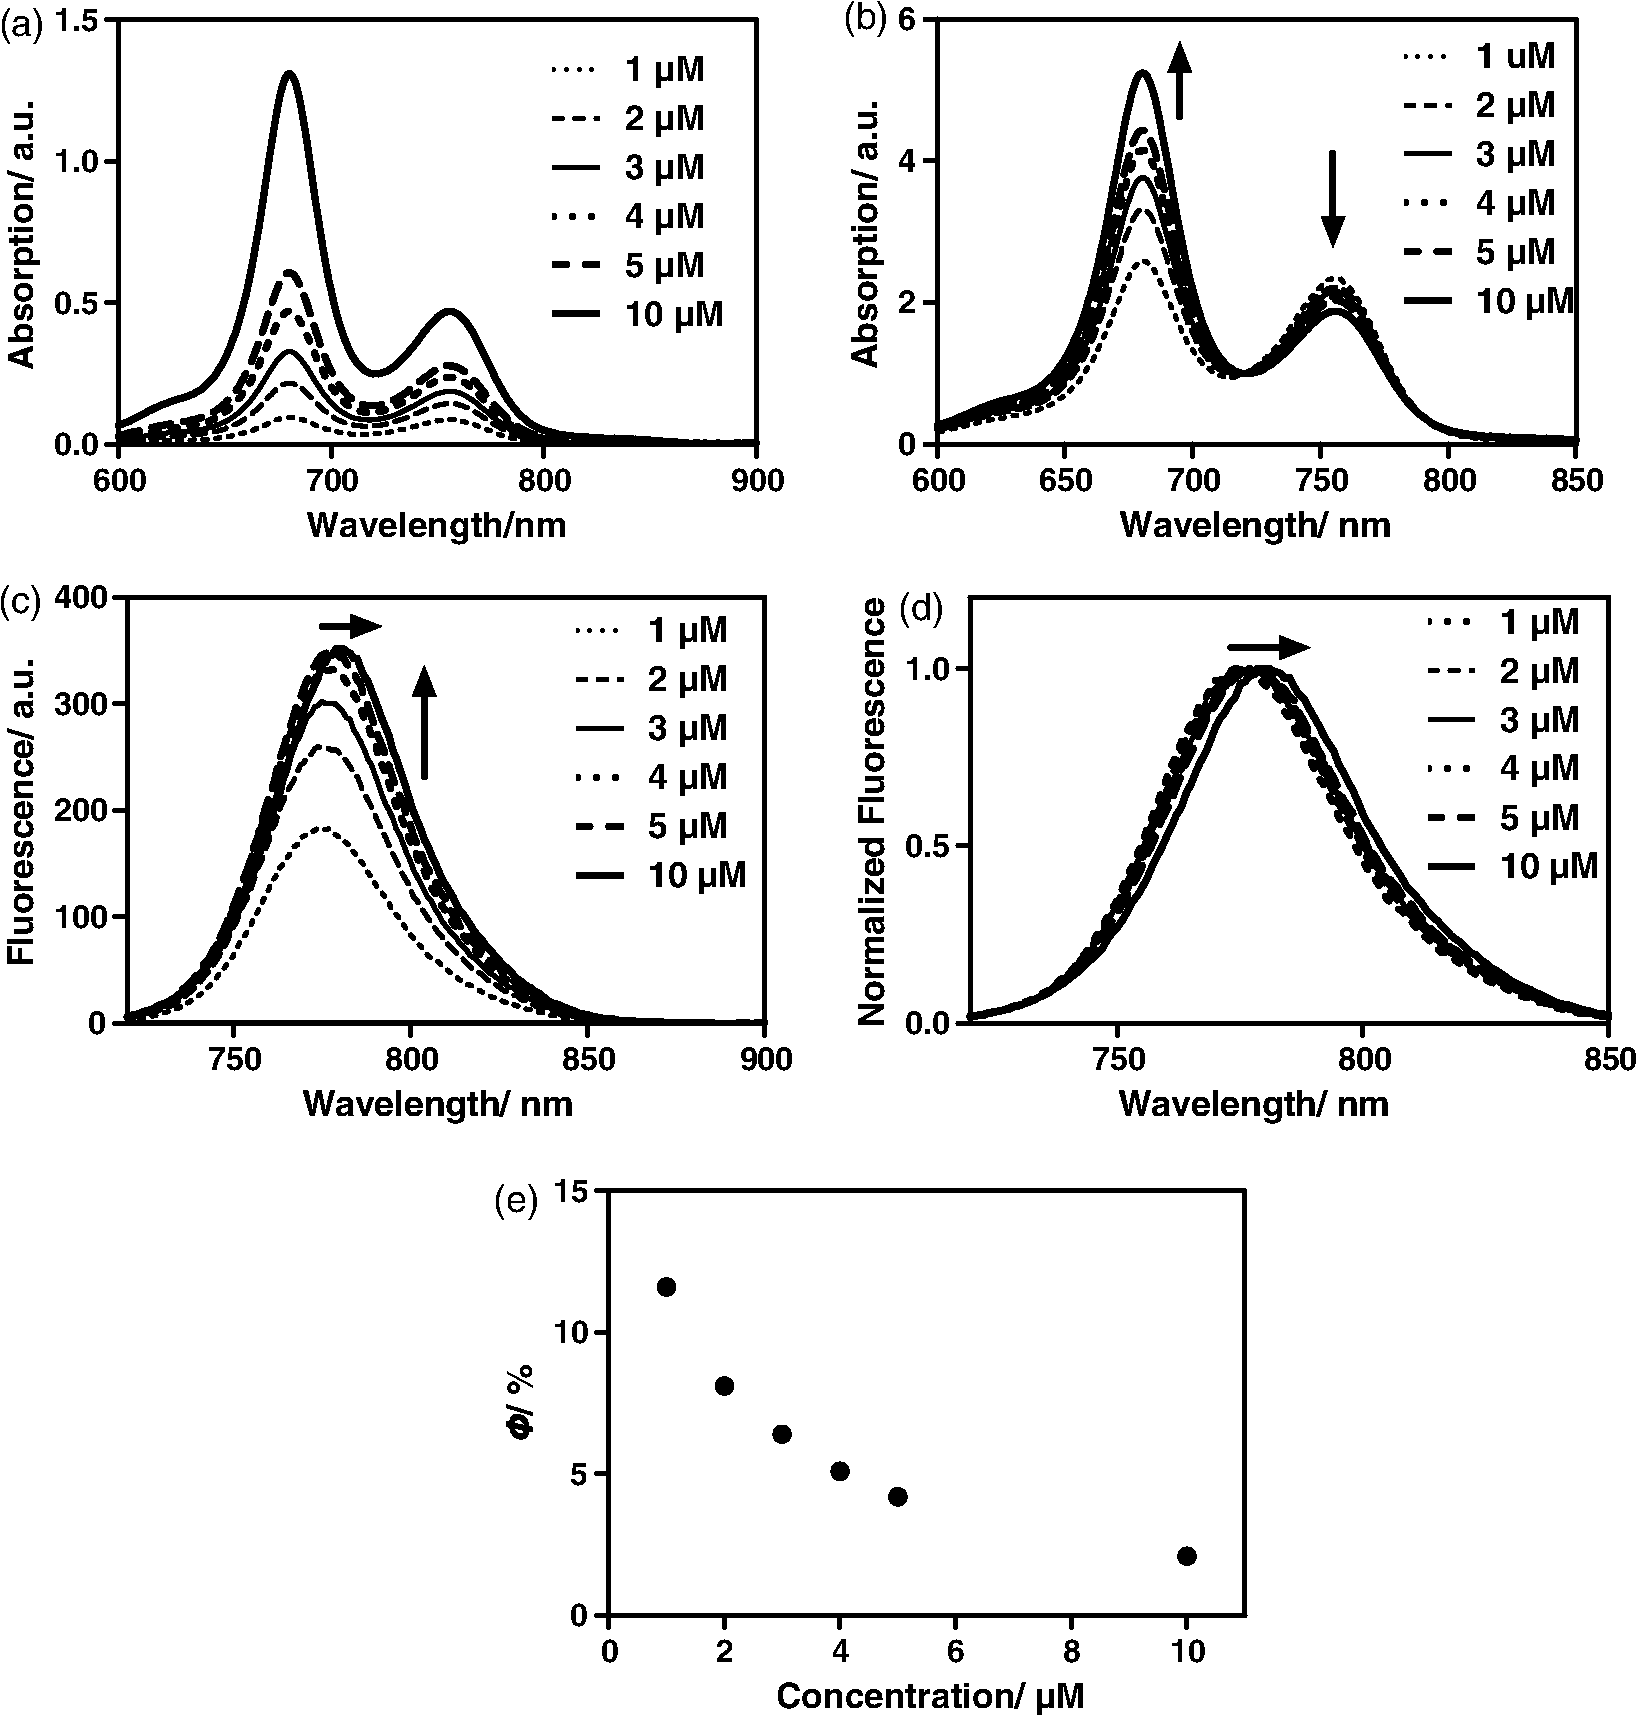 Attachment of the targeting moiety to ZW760 significantly reduced the aggregation. As displayed in Fig. 4, ZW760-mbc94 showed an intense absorption band centered at 762 nm in water and the band profile is similar to that of ZW760 in DMSO and methanol. This indicated that ZW760-mbc94 existed mainly as monomers in water at the concentration of 1 μM. The dissociation of the aggregate significantly improved the absorption and emission of ZW760-mbc94. Compared with the free dye ZW760, the absorption peak of ZW760-mbc94 is slightly red shifted to 762 nm and the molar extinction coefficient almost doubled ( and for ZW760 and ZW760-mbc94, respectively). The emission peak of ZW760-mbc94 is also red shifted from 775 to 781 nm as compared with ZW760. Importantly, the fluorescence quantum yield of ZW760-mbc94 in water is 15.2%, which is 31% higher than that of ZW760 (11.6%). Fig. 4UV–Vis absorption (solid) and emission spectra (dash) of ZW760 (red) and ZW760-mbc94 (black) in water at a concentration of 1 μM ().  Cellular uptake of ZW760-mbc94 was investigated in -mid DBT cells that express at endogenous levels.29 All fluorescence images taken are confocal-like images using a Zeiss Axio Observer fluorescence microscope equipped with the ApoTome 2 imaging system. Figure 5(a) shows fluorescence images of -mid DBT cells and WT DBT-cells (non- expressing control) after incubation with 5 μM of ZW760-mbc94, -Quinolone-3-Carboxamide (4Q3C, blocking agent), or ZW760 (free dye control) for 30 min at 37°C. Strong-fluorescence signal was shown throughout the intracellular cytoplasm of -mid DBT cells treated with ZW760-mbc94 probes. No accumulation in the nucleus was observed. It is noteworthy that the cell membrane did not appear to be the primary location of the probe uptake, which may seem unexpected as belongs to the transmembrane GPCR family. However, recent studies have shown that ’s distribution was predominantly intracellular in many -expressing cell lines.33 When blocked with 4Q3C, ZW760-mbc94 showed a much lower degree of cellular uptake. Furthermore, no significant fluorescence signal was seen from -mid DBT cells incubated with the free dye (ZW760) control or WT DBT-cells treated with ZW760-mbc94. The combined fluorescence imaging results indicate that ZW760-mbc94 binds to specifically and expression in -mid DBT cells is mainly intracellular. Fig. 5ZW760-mbc94 specifically binds to in -mid DBT cells. Four groups: (1) -mid DBT cells treated with 5 μM of ZW760-mbc94 without the blocking agent; (2) -mid DBT cells treated with 5 μM of ZW760-mbc94 together with 10 μM of 4Q3C; (3) -mid DBT cells treated with 5 μM of free ZW760 dye; (4) wild type DBT-cells (-) treated with 5 μM of ZW760-mbc94. All cells were incubated at 37°C for 30 min and washed three times with serum free medium. (a) Fluorescence images were obtained using a Zeiss Axio Observer fluorescent microscopy with ApoTome 2 imaging system. From top to bottom: ICG filter (red), ICG filter (red) + DAPI filter (blue) merged, differential interference contrast (DIC). Scale: 20 μm. (b) Quantitative fluorescent signal was measured using a Synergy™ H4 hybrid multimode microplate reader. Each data point represents the (SD) based on triplicate samples. (****).  As mentioned in Sec. 1, the main purpose of this study is to evaluate whether replacing the charged NIR760 dye, with zwitterionic ZW760 dye would significantly reduce the nonspecific binding of -targeted imaging agents. To quantitatively study the specific uptake of ZW760-mbc94, we screened -mid DBT and WT DBT-cells using a multiplate reader. As shown in Fig. 5(b), the uptake of ZW760-mbc94 in -mid DBT was effectively blocked by 4Q3C ( versus , ). This roughly 50% blocking effect is higher than our previous result using NIR760-mbc94 as the imaging probe,26 indicating reduced nonspecific binding. In addition, fluorescence signal from -mid DBT cells treated with free dye is only 6.6% of that with ZW760-mbc94 ( versus , ). Furthermore, the uptake of ZW760-mbc94 in WT DBT cells was lower than in -mid DBT cells ( versus , ). Therefore, the results provided additional evidence for the specificity of ZW760-mbc94, which was improved over the previously reported NIR760-mbc94 probe. The specific binding of ZW760-mbc94 to was further demonstrated by the in vitro fluorescence saturation binding study. ZW760-mbc94 served as the fluorescent ligand and 4Q3C was used as the blocking agent to account for nonspecific binding. A representative saturation binding curve is shown in Fig. 6. Similar to NIR760-mbc94, ZW760-mbc94 binds to with a nanomolar affinity (). Fig. 6In vitro fluorescence saturation binding assay of ZW760-mbc94. The equilibrium dissociation constant (Kd) and the maximum specific binding (Bmax) were calculated from in vitro saturation-binding assay using Prism software. -mid DBT cells were incubated for 30 min with an increasing concentration of ZW760-mbc94 with or without the blocking agent (4Q3C). Cells were then rinsed with serum free medium and fluorescence at 790 nm was recorded with a Synergy™ H4 hybrid multimode microplate reader. Each data point represents the based on triplicate samples.  To study the targeting specificity of ZW760-mbc94 in living systems, in vivo optical imaging was performed postinoculation of -mid DBT tumor cells subcutaneously. The tumor sizes in all mice showed no significant difference. Three groups of mice (three in each group) were administrated with ZW760-mbc94, , and ZW760, respectively. The representative in vivo time-dependent fluorescence images are shown in Fig. 7(a). All images are displayed on the same scale to allow for direct visual comparison among the uptake profiles of ZW760-mbc94, , and ZW760 dye. The free ZW760 dye showed rather quick clearance profile. Right after the injection, intense fluorescence signal was observed throughout the whole body. Most dye molecules were cleared out only 30 min after injection, and no significant fluorescence signal was observed from the animals after the 1-h PI time point. On the contrary, ZW760-mbc94 showed much slower bioclearance profiles, with or without the blocking agent (4Q3C). Significant fluorescence signal was observed from the whole body even at the last imaging time point (72-h PI). Fig. 7In vivo tumor optical imaging and competitive blocking studies. -mid DBT cells were subcutaneously implanted into the right flank of 6- to 8-week-old female Nu/nu mice. Experiments with tumor-bearing mice were performed 10 days after injection of tumor cells. To examine tumor -targeted imaging, all mice were injected with the following agents dissolved in 100-μL saline via the tail vein: 3 with 10-nmol ZW760-mbc94, 3 with 10-nmol ZW760-mbc94 + 100 nmol 4Q3C, 3 with 10-nmol free ZW760. (a) Mice were anesthetized with 2.5% isoflurane and imaged with a charge-coupled device camera-based bioluminescence imaging system IVIS Lumina XR, at preinjection, 0.02-, 0.5-, 1-, 2-, 4-, 6-, 12-, 24-, 48-, and 72-h postinjection (PI). (b) Time activity curves of the average radiant efficiency of the tumor area among three groups. Radiant efficiency of the tumor area was calculated by the region of interest (ROI) function of Living Image software. (c) Time activity curves of tumor/background ratio among three groups. Radiant efficiency of the tumor area at the right flank of the animal (T) and of the area at the left flank [normal tissue (N)] was calculated by the ROI function of Living Image software. Dividing T by N yielded the contrast between the tumor tissue and the normal tissue. (d) Previously published in vivo imaging results using NIR 760-mbc94 for comparison.26 In vivo images were collected at preinjection, 0.02-, 1-, 2-, 6-, 12-, 24-, 48- and 72-h PI. (*). 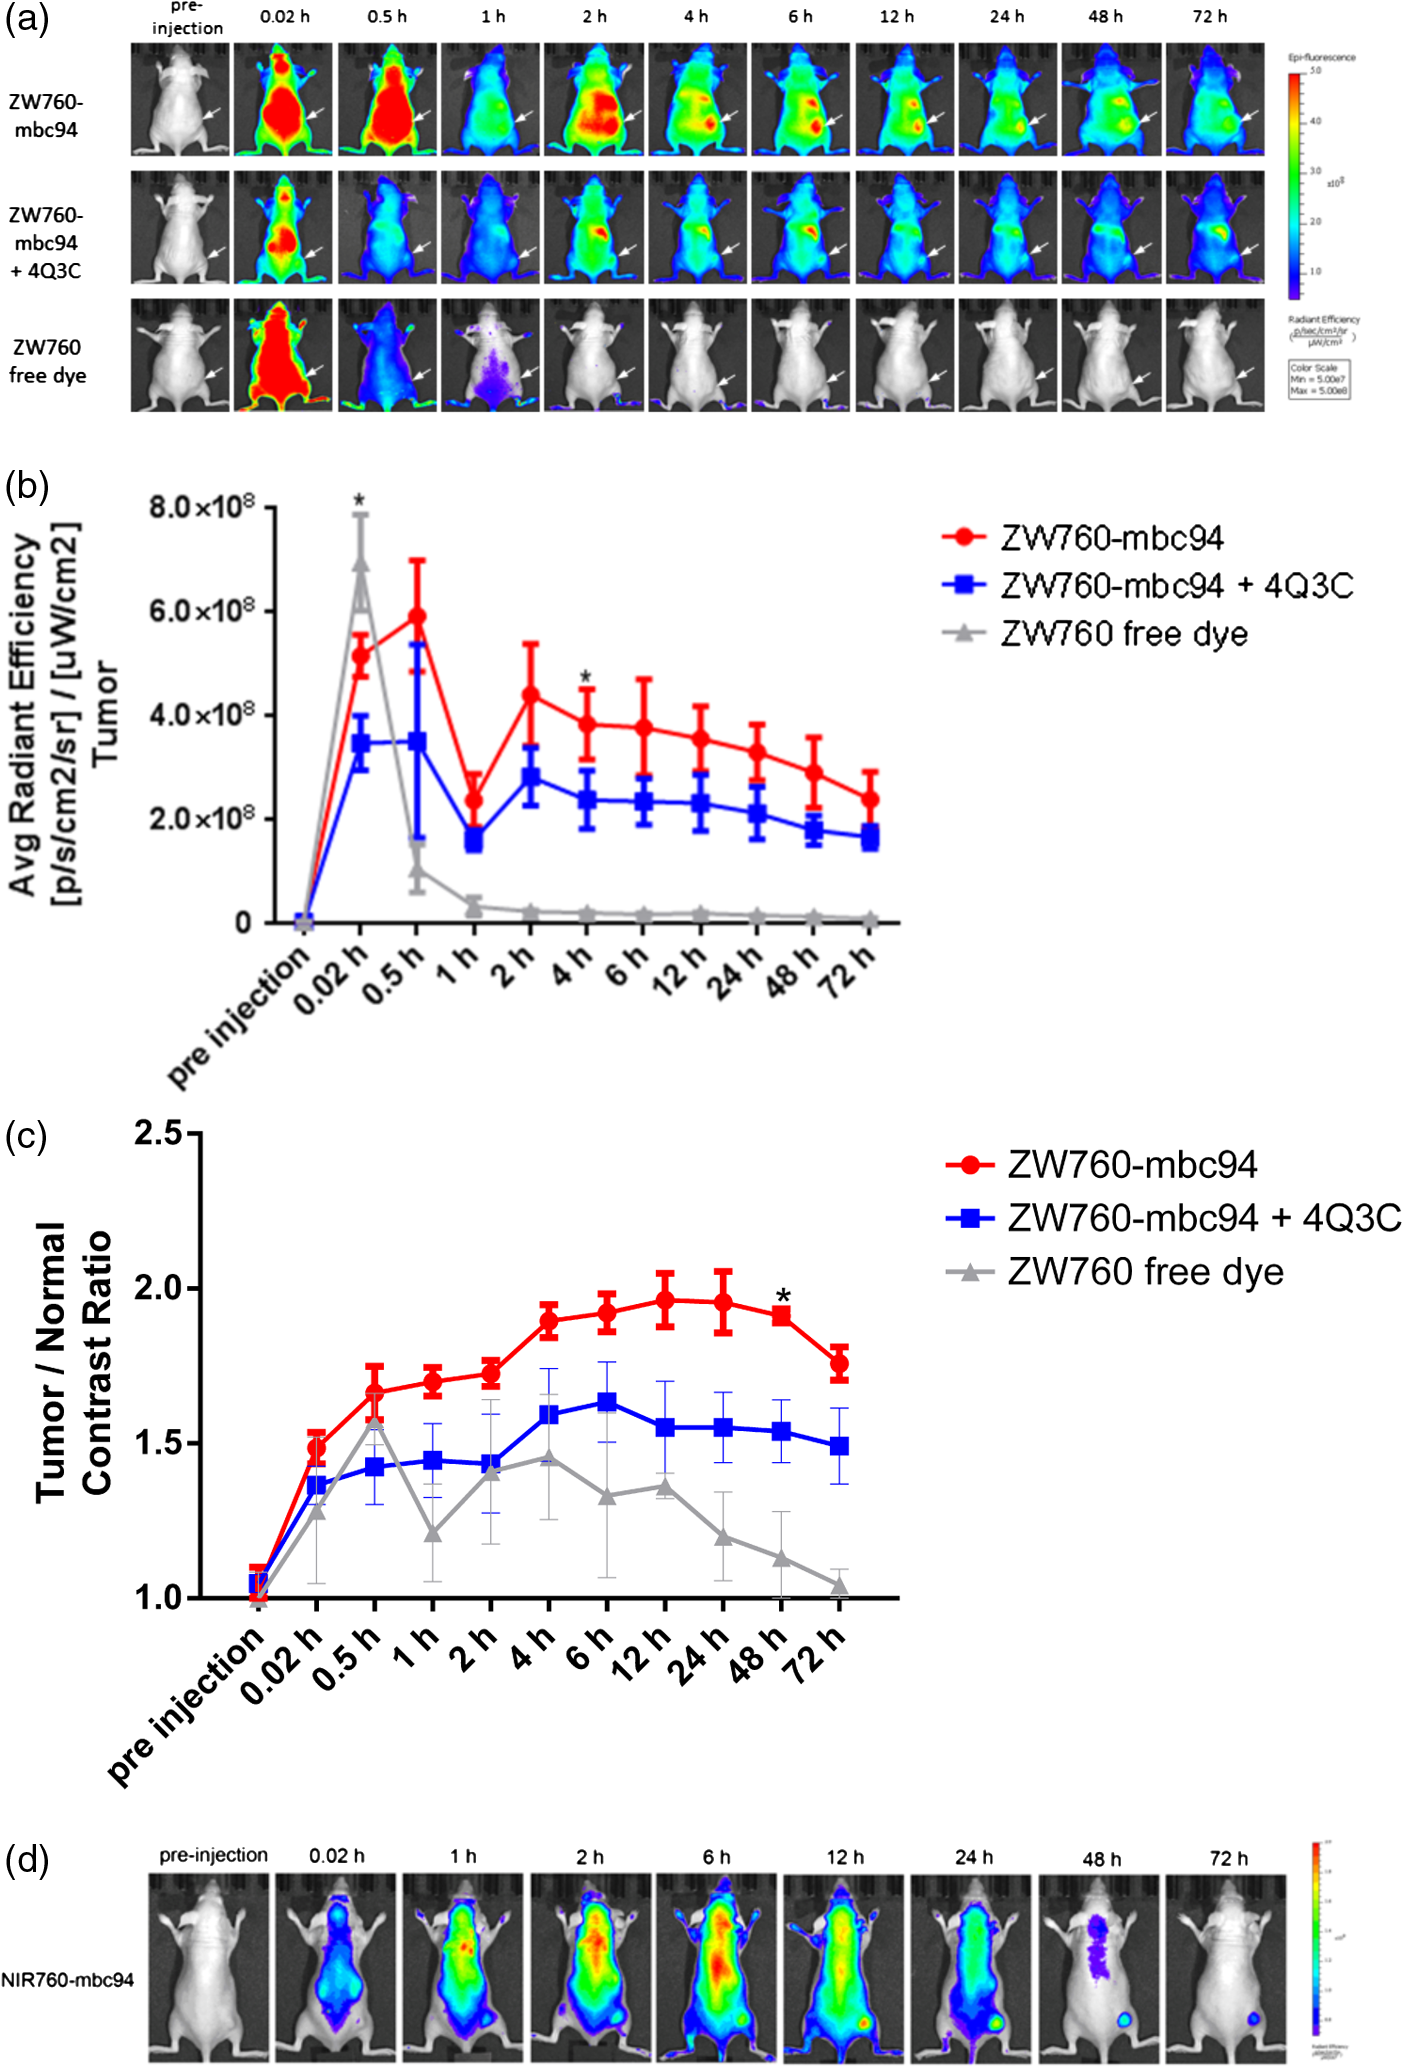 The tumor (located at the right flank) of the mice injected with ZW760-mbc94 showed higher fluorescence signal than that in the blocked animals at almost all time points [Fig. 7(b)], with statistical significance () achieved at 4-h PI. The ratio of the fluorescence signal at the tumor area (T) over that at the left leg [normal tissue (N)] was used to calculate the tumor contrast (T/N). For the free dye control mice, intense fluorescent signal was observed throughout the whole body within the first-hour PI without visual tumor contrast, whereas no fluorescence signal was observed anywhere at other time points. For the mice injected with ZW760-mbc94, the T/N ratio gradually increased over time and reached the maximum () at about 12-h PI [Fig. 7(c)]. Mice treated with showed lower T/N ratio at all time points [Fig. 7(c)], with the peak T/N ratio () at 6-h PI. As shown in Fig. 7(c), significant difference of the T/N ratio between the probe and blocking group was achieved at 48-h (20% blockage effect, ) PI. Because of the signal interference caused by systemic probe uptake at these time points [Fig. 7(a)], these percentages may not represent the true blocking effect. As such, we will use the ex vivo imaging results to evaluate the specificity of ZW760-mbc94 in the living system. After the last imaging time point (72-h PI), the mice were sacrificed, and the major organs (blood, heart, lung, liver, spleen, pancreas, kidney, muscle from left leg, and brain) were harvested for ex vivo biodistribution analysis [Fig. 8(a)]. The fluorescent intensities in tumor and organs were measured, and the signal contrast (fluorescence signal from tumor or organ/signal from muscle) values are presented in Fig. 8(b). Mice treated with ZW760-mbc94 showed an ex vivo T/N ratio of 2.88 (), whereas blocked mice showed a T/N ratio of 1.54 (), with 47% blocking effect. The free dye control mice showed a T/N ratio of 1.28 (). Fig. 8Ex vivo optical imaging and biodistribution study. (a) Ex vivo imaging of tumor and selected organs 72-h PI of ZW760-mbc94, , or free ZW760 dye. (b) Graphical representation of target/normal contrast ratio for ex vivo study, among three groups.  High-signal contrast in the liver was observed in both probe group () and blocking group (), whereas the signal contrast in the kidney was much lower ( in the probe group; in the blocking group). These results indicate that ZW760-mbc94 was cleared mainly from liver. The high-organ uptake caused relatively low in vivo tumor imaging contrast [Fig. 7(a)], as compared with the in vivo imaging results [Fig. 7(d) and Ref. 26] using our previously reported probe, NIR760-mbc94. Importantly, despite the high-probe uptake in the liver and kidney, blocking effect was only observed in the tumor, indicating specificity of ZW760-mbc94 in the living system. 4.SummaryIn summary, we developed a -targeted zwitterionic NIR fluorescent probe, ZW760-mbc94, which showed specific binding to the target receptor in vitro and in vivo. When compared with the charged NIR probe (NIR760-mbc94) that possesses the same targeting moiety, ZW760-mbc94 showed enhanced blocking effect in vitro (from 40% to 50%) and ex vivo (from 35% to 47%). Overall, ZW760-mbc94 appears to be a promising -targeted imaging probe. Moreover, replacing a charged NIR dye with a zwitterionic one appears to be an effective approach to reduce nonspecific binding. AcknowledgmentsWe thank Dr. Nephi Stella at the University of Washington for providing DBT cells and technical advice. We also thank Dr. Xiangqun Xie at the University of Pittsburgh for providing support to this project. This work was supported by the startup fund provided by the Department of Radiology, University of Pittsburgh. This project used the UPCI imaging facilities supported, in part, by award P30CA047904. ReferencesF. Rodriguez de Fonsecaet al.,
“The endocannabinoid system: physiology and pharmacology,”
Alcohol Alcohol., 40
(1), 2
–14
(2004). http://dx.doi.org/10.1093/alcalc/agh110 ALALDD 0735-0414 Google Scholar
E. L. ScotterM. E. AboodM. Glass,
“The endocannabinoid system as a target for the treatment of neurodegenerative disease,”
Br. J. Pharmacol., 160
(3), 480
–498
(2010). http://dx.doi.org/10.1111/bph.2010.160.issue-3 BJPCBM 0007-1188 Google Scholar
M. Sextonet al.,
“NIR-mbc94, a fluorescent ligand that binds to endogenous CB(2) receptors and is amenable to high-throughput screening,”
Chem. Biol., 18
(5), 563
–568
(2011). http://dx.doi.org/10.1016/j.chembiol.2011.02.016 CBOLE2 1074-5521 Google Scholar
G. Velascoet al.,
“Cannabinoids and gliomas,”
Mol. Neurobiol., 36
(1), 60
–67
(2007). http://dx.doi.org/10.1007/s12035-007-0002-5 MONBEW 0893-7648 Google Scholar
P. PacherS. BatkaiG. Kunos,
“The endocannabinoid system as an emerging target of pharmacotherapy,”
Pharmacol. Rev., 58
(3), 389
–462
(2006). http://dx.doi.org/10.1124/pr.58.3.2 PAREAQ 0031-6997 Google Scholar
B. G. Ramirezet al.,
“Prevention of Alzheimer’s disease pathology by cannabinoids: neuroprotection mediated by blockade of microglial activation,”
J. Neurosci., 25
(8), 1904
–1913
(2005). http://dx.doi.org/10.1523/JNEUROSCI.4540-04.2005 Google Scholar
T. Sugiuraet al.,
“Evidence for the involvement of the cannabinoid receptor and its endogenous ligand 2-arachidonoylglycerol in 12-O-tetradecanoylphorbol-13-acetate-induced acute inflammation in mouse ear,”
J. Biol. Chem., 280
(18), 18488
–18497
(2005). http://dx.doi.org/10.1074/jbc.M413260200 JBCHA3 0021-9258 Google Scholar
H. Iwamuraet al.,
“In vitro and in vivo pharmacological characterization of JTE907, a novel selective ligand for cannabinoid receptor,”
J. Pharmacol. Exp. Ther., 296
(2), 420
–425
(2001). JPETAB 0022-3565 Google Scholar
M. M. Ibrahimet al.,
“Activation of cannabinoid receptors by AM1241 inhibits experimental neuropathic pain: pain inhibition by receptors not present in the CNS,”
Proc. Natl. Acad. Sci. U. S. A., 100
(18), 10529
–10533
(2003). http://dx.doi.org/10.1073/pnas.1834309100 PNASA6 0027-8424 Google Scholar
M. Karsaket al.,
“The cannabinoid receptor: a potential target for the diagnosis and treatment of osteoporosis,”
J. Bone Miner. Res., 19
(S1), S383
–S383
(2004). JBMREJ 0884-0431 Google Scholar
A. Ortega-Alvaroet al.,
“Deletion of cannabinoid receptor induces schizophrenia-related behaviors in mice,”
Neuropsychopharmacology, 36
(7), 1489
–1504
(2011). http://dx.doi.org/10.1038/npp.2011.34 NEROEW 0893-133X Google Scholar
M. S. Garcia-GutierrezJ. Manzanares,
“Overexpression of cannabinoid receptors decreased vulnerability to anxiety and impaired anxiolytic action of alprazolam in mice,”
J. Psychopharmacol., 25
(1), 111
–120
(2011). http://dx.doi.org/10.1177/0269881110379507 JOPSEQ 0269-8811 Google Scholar
M. S. Garcia-Gutierrezet al.,
“Chronic blockade of cannabinoid receptors induces anxiolytic-like actions associated with alterations in GABA(A) receptors,”
Br. J. Pharmacol., 165
(4), 951
–964
(2012). http://dx.doi.org/10.1111/j.1476-5381.2011.01625.x BJPCBM 0007-1188 Google Scholar
Z. X. Xiet al.,
“Brain cannabinoid receptors modulate cocaine’s actions in mice,”
Nat. Neurosci., 14
(9), 1160
–1166
(2011). http://dx.doi.org/10.1038/nn.2874 NANEFN 1097-6256 Google Scholar
B. K. AtwoodK. Mackie,
“: a cannabinoid receptor with an identity crisis,”
Br. J. Pharmacol., 160
(3), 467
–479
(2010). http://dx.doi.org/10.1111/bph.2010.160.issue-3 BJPCBM 0007-1188 Google Scholar
D. A. Mankoff,
“A definition of molecular imaging,”
J. Nucl. Med., 48
(6), 18N
–21N
(2007). JNMEAQ 0161-5505 Google Scholar
S. Galiegueet al.,
“Expression of central and peripheral cannabinoid receptors in human immune tissues and leukocyte subpopulations,”
Eur. J. Biochem., 232
(1), 54
–61
(1995). http://dx.doi.org/10.1111/ejb.1995.232.issue-1 EJBCAI 0014-2956 Google Scholar
M. F. Baiet al.,
“MBC94, a conjugable ligand for cannabinoid receptor imaging,”
Bioconjugate Chem., 19
(5), 988
–992
(2008). http://dx.doi.org/10.1021/bc700419e BCCHES 1043-1802 Google Scholar
J. GuindonA. G. Hohmann,
“The endocannabinoid system and cancer: therapeutic implication,”
Br. J. Pharmacol., 163
(7), 1447
–1463
(2011). http://dx.doi.org/10.1111/j.1476-5381.2011.01327.x BJPCBM 0007-1188 Google Scholar
T. Iuvoneet al.,
“Selective up-regulation in women affected by endometrial inflammation,”
J. Cell Mol. Med., 12
(2), 661
–670
(2008). http://dx.doi.org/10.1111/j.1582-4934.2007.00085.x JCMMC9 1582-1838 Google Scholar
S. Steffenset al.,
“Low dose oral cannabinoid therapy reduces progression of atherosclerosis in mice,”
Nature, 434
(7034), 782
–786
(2005). http://dx.doi.org/10.1038/nature03389 NATUAS 0028-0836 Google Scholar
A. Ellert-Miklaszewskaet al.,
“Distinctive pattern of cannabinoid receptor type II () expression in adult and pediatric brain tumors,”
Brain Res., 1137
(1), 161
–169
(2007). http://dx.doi.org/10.1016/j.brainres.2006.12.060 BRREAP 1385-299X Google Scholar
M. D. Van Sickleet al.,
“Identification and functional characterization of brainstem cannabinoid receptors,”
Science, 310
(5746), 329
–332
(2005). http://dx.doi.org/10.1126/science.1115740 SCIEAS 0036-8075 Google Scholar
C. Benitoet al.,
“Cannabinoid receptors and fatty acid amide hydrolase are selectively overexpressed in neuritic plaque-associated glia in Alzheimer’s disease brains,”
J. Neurosci., 23
(35), 11136
–11141
(2003). Google Scholar
C. Benitoet al.,
“Cannabinoid and receptors and fatty acid amide hydrolase are specific markers of plaque cell subtypes in human multiple sclerosis,”
J. Neurosci., 27
(9), 2396
–2402
(2007). Google Scholar
S. ZhangP. ShaoM. Bai,
“In vivo type 2 cannabinoid receptor-targeted tumor optical imaging using a near infrared fluorescent probe,”
Bioconjugate Chem., 24
(11), 1907
–1916
(2013). http://dx.doi.org/10.1021/bc400328m BCCHES 1043-1802 Google Scholar
H. S. Choiet al.,
“Targeted zwitterionic near-infrared fluorophores for improved optical imaging,”
Nat. Biotechnol., 31
(2), 148
–153
(2013). http://dx.doi.org/10.1038/nbt.2468 NABIF9 1087-0156 Google Scholar
H. S. Choiet al.,
“Synthesis and in vivo fate of zwitterionic near-infrared fluorophores,”
Angew. Chem. Int. Edit., 50
(28), 6258
–6263
(2011). http://dx.doi.org/10.1002/anie.201102459 ACIEF5 1433-7851 Google Scholar
E. Cudabacket al.,
“The expression level of and receptors determines their efficacy at inducing apoptosis in astrocytomas,”
Plos One, 5
(1), e8702
(2010). http://dx.doi.org/10.1371/journal.pone.0008702 1932-6203 Google Scholar
H. LeeJ. C. MasonS. Achilefu,
“Heptamethine cyanine dyes with a robust C-C bond at the central position of the chromophore,”
J. Org. Chem., 71
(20), 7862
–7865
(2006). http://dx.doi.org/10.1021/jo061284u JOCEAH 0022-3263 Google Scholar
M. Ogawaet al.,
“H-type dimer formation of fluorophores: a mechanism for activatable, in vivo optical molecular imaging,”
ACS Chem. Biol., 4
(7), 535
–546
(2009). http://dx.doi.org/10.1021/cb900089j ACBCCT 1554-8929 Google Scholar
P. Juzenaset al.,
“Spectroscopic evidence of monomeric aluminium phthalocyanine tetrasulphonate in aqueous solutions,”
J. Photoch. Photobiol. B, 75
(1–2), 107
–110
(2004). http://dx.doi.org/10.1016/j.jphotobiol.2004.05.011 JPPBEG 1011-1344 Google Scholar
J. T. Castanedaet al.,
“Differential expression of intracellular and extracellular CB(2) cannabinoid receptor protein by human peripheral blood leukocytes,”
J. Neuroimmune Pharmacol., 8
(1), 323
–332
(2013). http://dx.doi.org/10.1007/s11481-012-9430-8 1557-1890 Google Scholar
BiographyZhiyuan Wu received his MD degree from Shanghai Jiao Tong University School of Medicine in China and is currently working as a postdoctoral fellow in Dr. Mingfeng Bai’s lab at the University of Pittsburgh. His research interests include molecular imaging of cancer and imaging biomarkers research. He has published more than 40 peer-reviewed journal articles in these fields. Pin Shao is currently a research associate in Dr. Mingfeng Bai’s lab at the Department of Radiology, University of Pittsburgh. She obtained her PhD degree in chemistry from Wuhan University, PR China, and her research interests are in the development of novel near-infrared fluorescent compounds for optical and/or photoacoustic imaging, as well as drug delivery. Shaojuan Zhang earned her PhD degree at Gunma University in Japan and is currently a postdoctoral fellow at University of Pittsburgh, under the mentorship of Dr. Mingfeng Bai. Her research interests are targeted optical imaging and cancer therapeutics using molecular probes. Mingfeng Bai is an assistant professor of radiology at the University of Pittsburgh. He received his MSc and PhD degrees in chemistry from Vanderbilt University and BS degree in chemistry from Nankai University, PR China. His research group is focused on developing novel molecular imaging probes for diagnostic imaging and phototherapy. He has been successful publishing peer-reviewed journal articles, holds various patents, and has given many presentations nationally and internationally. |


