|
|
1.IntroductionCoherent Raman scattering (CRS) techniques are sensitive to the same molecular vibrations that are probed in spontaneous Raman spectroscopy. Unlike linear Raman spectroscopy, however, CRS techniques exhibit a nonlinear dependence on the incoming light fields and produce coherent radiation. It is this latter property that has popularized CRS as a microscopy modality, as it is intimately related to the technique’s strong optical signals that enable fast imaging applications. CRS microscopy makes it possible to generate images based on vibrational Raman contrast at imaging speeds much faster than attained with conventional Raman microscopes. Clearly, this attribute is very attractive for biological imaging, where imaging speed is an important experimental parameter. Nonetheless, the qualities of CRS in the area of optical imaging were not immediately evident when the phenomenon was first demonstrated in 1962.1,2 Its use as a contrast mechanism in optical microscopy was still 20 years ahead.3 Early applications of CRS included frequency conversion of laser light and gas phase spectroscopy measurements.4–6 Driven by the development of pulsed lasers with increasingly shorter temporal pulse widths, the technique was later used as a time-resolved spectroscopy tool for precision measurements of molecular vibrations in the condensed phase.7–9 Intrinsic to condensed phase CRS measurements were the relatively long lengths over which the incident pulses interact with the material to generate the signal, a condition that needed special beam geometries to avoid phase mismatching of the light fields, most notably in coherent anti-Stokes Raman scattering (CARS).10 Interestingly, it is the notion of phase mismatching that held back a practical implementation of CRS in an optical microscope. It was believed that the complex beam geometries associated with conventional CRS spectroscopy were difficult to combine with the use of high numerical aperture lenses. In hindsight, this notion was wrong, as beautifully demonstrated in 1999:11 due to the much shorter interaction lengths, phase mismatching is much less of a concern in microscopy, especially when the signal is detected in the forward-propagating direction.12 This realization simplified the beam configuration and turned CRS into a workable tool, triggering the exponential growth of the coherent Raman microscopy field. More than a decade later, the CRS microscope has matured into a user-friendly instrument that is now firmly part of the tool set available for biological research.13 Similar to other nonlinear optical imaging techniques that came before it, CRS imaging systems can be purchased commercially from leading microscope manufacturers.14,15 Consequently, the focus has shifted from technique development to biological applications. Indeed, the availability of label-free vibrational contrast at realistic image acquisition rates represents a major step forward in dynamic imaging of tissues and cells, as shown in numerous studies. Examples include studying the health of the nervous system through CRS imaging of myelin,16–20 following lipid metabolism in living organisms,21,22 mapping cholesterol content in atherosclerotic plaques,23–27 and recording water diffusion in cells and tissues.28,29 In this tutorial, we highlight some of the most important imaging properties of CRS microscopy. We explain the basics of CRS in a simple yet intuitive way to emphasize the unique character of this technique compared to related imaging methods. We also discuss the experimental advantages and disadvantages of this imaging approach and illustrate its utility with several biomedical imaging applications. We emphasize that what follows is a tutorial, which does not attempt to provide the most comprehensive overview of what has been achieved in the field of CRS microscopy to date. Technological developments and applications of CRS microscopy have been vast over the last decade, yet it is not the purpose of this contribution to broadly cover these achievements. Instead, this tutorial focuses on the principles of CRS and provides student-level explanations of basic features of the CRS microscope. For more inclusive reviews on technical advances and biological imaging applications, the reader is referred elsewhere.13,30–33 2.Principles2.1.CRS Probes Raman Active VibrationsThe vibrationally sensitive CRS signal relies on the Raman effect. Spontaneous Raman scattering involves two photons, an incident photon with frequency , called pump, and a scattered photon with frequency , called Stokes. Assuming that the molecule is initially in its ground state, the Raman scattered photon is of lower frequency than the incident photon. The energy difference between the photons, , corresponds to the vibrational energy of the molecule, which is left in a vibrationally excited state after the light-matter interaction (see Fig. 1). Fig. 1Spontaneous and coherent Raman scattering (CRS). (a) In spontaneous Raman scattering, the presence of Raman active molecular mode dresses the incoming light with red- and blue-shifted frequency components. (b) In coherent Raman scattering, two incident fields drive the molecule at , producing coherent Raman signals at and .  Classically, the Raman effect can be understood as follows. The radiation produced by the molecule can be modeled as a radiating dipole positioned at . In the presence of a classical field with frequency , the dipole will oscillate at as well. This motion physically corresponds to the adiabatic motion of the molecule’s most moveable electrons, typically its valence electrons. However, the electron cloud, and thus the effective dipole, is capable of oscillating at different frequencies as well. This happens when electron motion is coupled to motional degrees of freedom of the nuclei.34 We can model nuclear motion along a generalized coordinate in terms of vibrational motion with a characteristic frequency . When coupling exists, the electronic polarizability can change with the nuclear displacement, i.e., , a property that is intimately related to the symmetry of the molecule. The component of the dipole that is driven at and radiating at is written as where is the amplitude of the driving field , is the equilibrium position of the nuclear coordinate, and is the arbitrary phase of the ground-state nuclear mode vibration. This is the dipole component that corresponds to Raman scattered radiation. We see that the Raman effect relies on , the degree of coupling between the electron and the nuclear motions. This parameter is a property of the chemical bonds and groups that are part of a molecule.CRS senses the same molecular property. The radiating dipole in CRS can be summarized as where is the amplitude of a second driving field at frequency and is a frequency-dependent function. Equation (2) can be explained as follows. The electron motion is actively driven by two incident fields, and . In case of , the motion at the difference frequency can be significant when the difference frequency corresponds to the characteristic frequency of a nuclear mode, as described by . The actively driven motion of the electrons, in turn, acts as a modulation on the light fields and as they propagate through the sample and dresses them with side bands. These new radiative frequency components at and are the CRS signals. The four basic CRS signals are called coherent Stokes Raman scattering (CSRS; ), stimulated Raman gain (SRG; ), stimulated Raman loss (SRL; ), and CARS (). Table 1 summarizes some of the properties of the different CRS signals.Table 1Properties of different coherent Raman scattering (CRS) imaging techniques.
CSRS, coherent Stokes Raman scattering; SRG, stimulated Raman gain; SRL, stimulated Raman loss; CARS, coherent anti-Stokes Raman scattering. This discussion above underlines the similarity between CRS and spontaneous Raman as they both depend on the molecular property . But there are also important differences, which we highlight next. 2.2.CRS is Nonlinear and CoherentThe detected signal resulting from the single radiating dipole described above is given as Upon inserting the expressions of Eqs. (1) and (2) in Eq. (3), it is clear that the spontaneous Raman scattering and CRS signals exhibit different dependencies on the intensity of the incident fields. The spontaneous Raman signal scales as , the intensity of the incoming field. It is, therefore, classified as a linear optical signal. The CRS signals, on the other hand, are nonlinear, as they depend nonlinearly on the intensity of the incoming fields. Another important difference is the presence of the phase in the oscillating dipole in Eq. (1), which is absent in the CRS expression in Eq. (2). In spontaneous Raman, the phase of the nuclear mode at equilibrium is different for each molecule. As a consequence, the phase of the radiating field from a given molecule is uncorrelated with the phase of the field from a different molecule. The total Raman scattered signal is a sum of the intensities of the individual dipole radiators. with the total number of molecules in the interaction volume. The spontaneous Raman signal is incoherent and, as is evident from Eq. (4), scales linearly with .The situation is different in CRS. Here the incident fields dictate the phase of the oscillatory electron motion, a direct consequence of the active driving of the molecule. The random phase of the ground-state nuclear mode is no longer a factor. Because all molecules in the interaction volume see the same driving fields, their electron motions are now phase correlated as they all move in step. The total signal is a coherent sum of the dipole contributions: The coherence of the CRS signal is one of its most celebrated features. It is partly responsible for the inherently much higher signal yields in CRS compared to spontaneous Raman scattering. In the next subsection, we will illuminate this aspect for both CARS and SRL. Another important practical implication of coherence is that the signal propagates in a well-defined direction in a manner that is similar to the propagation of a laser beam (see Fig. 2). This implies that the signal can be very efficiently collected with a collimating lens, which yields high detection efficiencies of the CRS signal.12 This is particularly relevant when imaging transparent samples, in which case the detector can be placed in the forward-propagation direction—the direction in which the CRS signals are commonly phase-matched. The situation in spontaneous Raman is different: incoherent radiation does not exhibit a well-defined propagation direction. Hence, the signal collection efficiency is generally less in spontaneous Raman microscopy. Fig. 2Sketch depicting that spatial coherence in CRS leads to strong and directional radiation. (a) The waves resulting from spontaneous Raman emission by separate dipoles (black dots) in the focal volume are not phase coherent, and no constructive interference occurs in a particular direction. (b) The CRS radiation from different dipole emitters constructively interferes in the forward-propagating direction, indicated by the red dotted lines.  2.3.Measuring the CRS ResponseThe CRS techniques can be roughly divided into two classes: signals that are measured at a new frequency, i.e., color, and signals that are measured at a frequency similar to that of the incident light fields ( and ). CSRS and CARS fall into the first category, while both SRG and SRL fall into the second. Although all CRS signals are derived from the same Raman interaction with the molecule, the two classes display different dependencies on such factors as excitation intensity and concentration of molecules. We will illustrate some of these differences for the cases of CARS and SRL. The CARS signal has the frequency . This is a new optical frequency that can be detected with a photodetector equipped with spectral bandpass filters. In this detection mode, the CARS intensity can be written as where is the nonlinear susceptibility, which captures the effects of the factor and function in Eq. (2), both properties of the molecule. The CARS signal scales with the intensities of three fields and exhibits a square modulus dependence on the material’s nonlinear susceptibility. Comparison of Eqs. (5) and (6) reveals that , i.e., the nonlinear susceptibility is linearly dependent on the molecular number density, whereas the CARS signal itself has a quadratic dependence on the number density. This quadratic dependence is a direct consequence of the coherent summation and is one of the main reasons why CARS signals can be orders of magnitude stronger than spontaneous Raman signals, especially in the high concentration limit.The SRL signal is detected at the optical frequency . This frequency is the same as the frequency of the pump light. Since CRS is coherent, there is a phase relation between this CRS radiation and the incident light. Consequently, the SRL signal is detected as the interference between the pump beam and the radiated CRS response. Using high-frequency modulation techniques,35–37 the first two terms on the right-hand side can be suppressed and only the latter term is detected. Although the signal depends on the same molecular property as measured in the CARS experiment, the detected SRL signal, , shows a different dependence on the nonlinear susceptibility and the incident intensities. The signal scales linearly with and depends on the intensities of two fields rather than three. Like spontaneous Raman, the SRL signal is linearly dependent on the molecular number density. Unlike incoherent Raman, however, the radiation is coherent and is interferometrically enhanced. The efficiency of interferometric enhancement scales with the intensity of the Stokes beam, yielding higher signals than what can be obtained with the noninterferometric, spontaneous Raman process. We, thus, see that the coherent character of the CRS interaction in both CARS and SRL boosts the overall signal yield relative to spontaneous Raman scattering, albeit in slightly different ways. However, the coherent character of CRS alone is not enough to produce the strong signals necessary for high-speed microscopy applications. The use of pulsed excitation also plays an important role, which we will discuss in Sec. 3.2. Whether the CRS response is best detected through a CARS or an SRL detection scheme depends on the nature of the experiment. For detection of compounds with high local concentrations in the sample, such as the detection of lipid molecules in lipid droplets, both CARS and SRL provide excellent chemically selective signals with high signal-to-noise-ratios (SNR). When the concentration of the target compound is low, SRL oftentimes offers better SNR in imaging mode compared to CARS. The main reason for this up to 10 times better sensitivity is the lack of background contributions in SRL that can otherwise be prevalent in CARS. Since the total nonlinear susceptibility is a sum of both vibrationally resonant and nonresonant contributions, the CARS image can be overwhelmed by nonresonant contributions, which appear as an interfering background. SRL, on the other hand, detects the imaginary part of , which contains only vibrationally resonant contributions. For high-speed imaging applications beyond the visualization of lipids, SRL has proven to be often a better choice, although it requires a slightly more complicated setup that includes a high-frequency amplitude modulator plus demodulation detection electronics. 3.Technical Merits3.1.Microscope ConfigurationBecause CRS uses visible or near-infrared excitation light, the standard optics of a laser-scanning multiphoton microscope are compatible with CRS modalities. In particular, CRS uses the same high numerical aperture (NA) lenses that are employed in multiphoton microscopes. In fact, a CRS imaging modality shares many of the imaging properties of a multiphoton microscope, including fast image acquisition, submicrometer resolution, and ease-of-use (see Table 2). Commercial laser-scanning microscopes can be upgraded with a CRS module with only minimal modification. In its simplest form, a CRS microscope can be constructed from a fluorescence laser-scanning microscope by equipping an epi-detector with proper bandpass filters and interfacing the system with a CRS light source. The epi-CRS signal from lipids in tissues is generally strong and comparable with multiphoton fluorescence signals. Because a CRS modality can be added to a standard microscope platform multimodal imaging is possible, whereby the CRS contrast is one of many optical contrast mechanisms available on the imaging system (Fig. 3).23,38,39 Table 2CRS microscopy compared to other nonlinear optical imaging techniques.
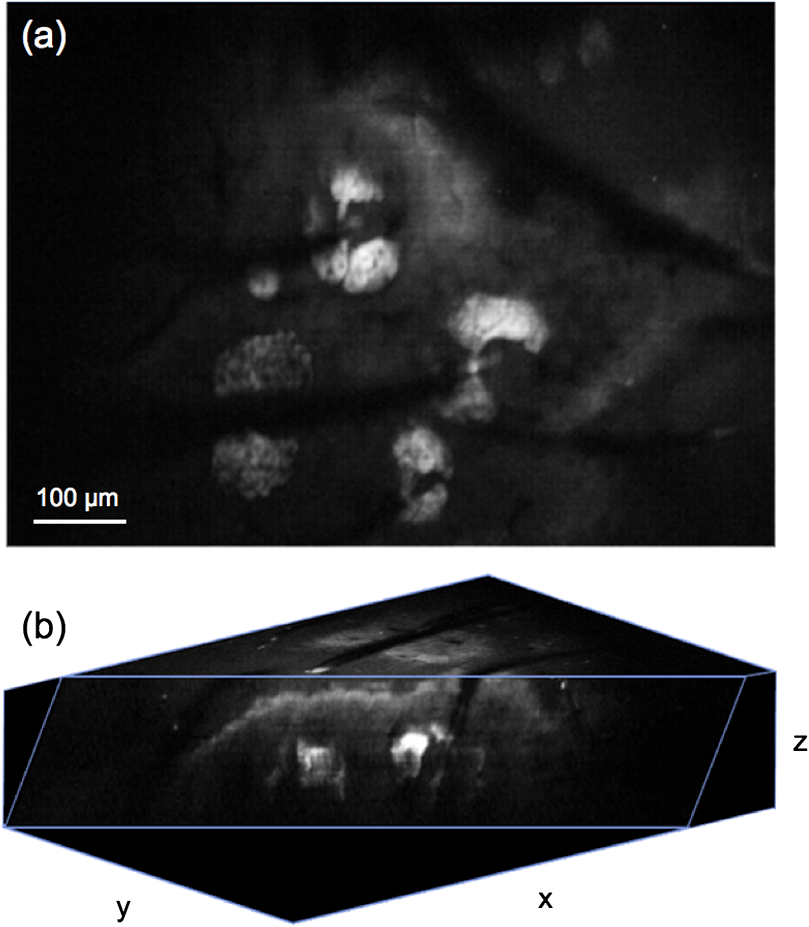
THG, third-harmonic generation. Fig. 3Multimodal imaging with CRS microscopy. (a) Stimulated Raman loss (SRL) image of a mouse meibomian gland, visualizing the lipid-rich meibum at . (b) SRL image (green) overlaid with fluorescence images from 4’,6-diamidino-2-phenylindole (DAPI) (red), showing cell nuclei, and phalloidin (blue), highlighting the extracellular matrix. Image adapted with permission from Ref. 40.  Perhaps the most relevant configuration difference with a conventional laser-scanning microscope system is the frequent use of a forward detector in CRS, which is uncommon in fluorescence microscopes (Fig. 4). Since the CRS signals are phase-matched in the forward-propagation direction, strongest signals are expected in that direction when thin samples are used.12 Although standard condensers, which have a NA of , suffice to capture a significant portion of the forward-propagating signal, better collection efficiencies are obtained with higher-NA condensers. This is especially important for the stimulated Raman scattering (SRS, which includes both SRL and SRG) techniques, where photothermal and position-dependent interference effects may introduce artifacts in the image.41,42 Such effects can be mitigated by choosing a high-NA condenser. 3.2.Light SourcesThe choice of light source has important consequences for the strength of the signal. To illustrate this, let us consider the CARS signal generated by the two frequencies and . We can write Eq. (6) more explicitly as where the summation runs over the optical frequency modes of the laser light source near and . In the case where single-mode continuous wave (cw) lasers are used, the summation is only over one mode for the pump and Stokes frequencies. However, Eq. (8) shows that if more modes are used, many more combinations are possible. Under the condition that the modes are coherent with one another, the coherent summation holds and the signal grows relative to an incoherent summation. This is the situation that applies when mode-locked lasers are employed for CARS, which deliver pulses with spectra composed of many modes that are closely spaced and phase-locked. We, thus, see from this frequency-domain picture that the CARS signal grows stronger when the laser spectrum broadens, which in the time domain corresponds to shorter pulses. In general, CRS signals increase when the temporal pulse width is decreased.In terms of practical experimental parameters, the magnitude of the CRS signal can be written as follows: where is the pixel dwell time, is the pulse repetition rate, is the temporal pulse duration, and is the effective, time-integrated excitation power. The combinatorial power is for CARS-type measurements and for SRS-type experiments. Although CRS microscopy can, in principle, be carried out with cw lasers,43 the use of pulsed excitation has the distinct advantage of providing high peak intensities while the average power of the incident light remains at tolerable levels. Equation (9) captures the growth of the overall signal if the pulse width is decreased. The use of ultrafast pulses, thus, provides a mechanism to raise CRS levels significantly.Using a 5-ps, 800-nm pulse with a pulse energy of 0.1 nJ, a peak intensity of more than is obtained when focusing the light pulse by a 1.2 NA water immersion lens. At such excitation intensities, CARS signals of photon per shot are regularly detected from a single lipid bilayer, which contains oscillators in the interaction volume. In the case where a pulse repetition rate of 80 MHz is used, detected photons per microsecond can be registered, which is sufficient to visualize the lipid membrane at high scanning speeds ( per frame for a image). Note that at 80 MHz, the average power of a pulse train with 0.1-nJ pulses is only 8 mW. Such average powers are generally tolerable by biological samples, especially under fast imaging conditions and with excitation wavelengths in the near-infrared range. The shorter the pulse, the stronger the CRS signal. However, by shortening the pulse, the spectral bandwidth of the excitation light increases, which implies that the spectral resolution of the experiment is affected. For a bandwidth limited pulse of around 800 nm, the spectral width is . Broad Raman features, such as the OH-stretching band of water28 or the complete CH-stretching band of lipids,44 are suitable targets for femtosecond-excitation sources. Nonetheless, many individual Raman lines in the condensed phase have much narrower widths (), and the use of femtosecond pulses reduces the ability to resolve individual signatures. The most direct solution to improve spectral resolution is the use of picosecond pulses with a width comparable to the width of the Raman lines. An added benefit of picosecond pulses is the greatly improved resonant-to-nonresonant signal ratio in CARS relative to shorter pulses.45 Picosecond light sources have been used with great success for biological imaging applications where speed is important. To achieve comparable spectral resolution with femtosecond sources, advanced spectral shaping of the excitation pulses can be employed, including the use of phase-only masks46–48 and combined phase and amplitude shaping.49 Equation (9) also suggests that reducing the repetition rate under constant average power increases the CRS signal. As long as the dominant mechanism of photodamaging in the sample scales linearly with intensity, lowering the repetition rate while keeping the average power at a fixed level is a good strategy. However, nonlinear photodamaging mechanisms put a limit to the maximum peak power that can be tolerated by the sample and, thus, regulate the range of practical pulse repetition rates for imaging applications. The combination of nonlinear photodamaging and the requirement for short pixel dwell times () puts the useable range of repetition rates for the CRS light source between 1 and 100 MHz.50 All CRS techniques need coherent incident radiation at and . This condition is typically satisfied by using two laser beams of different color, either by synchronizing two independent lasers51 or by utilizing synchronously pumped optical parametric oscillator systems.52 Similar conditions can be achieved with an ultrafast oscillator in combination with a fiber-based frequency conversion device.53,54 An alternative approach is to use broadband light sources, which span a spectral range that includes both and , and is often used in combination with spectral shapers to obtain sufficient spectral resolution.46 An important recent development is the design of all-fiber-based light sources for CRS microscopy, offering a more compact and often cheaper alternative to solid-state laser light sources.55 Fiber sources have been successfully demonstrated for CARS microscopy56–58 and, in combination with balanced detection techniques, have also signaled their potential for SRS imaging.59 3.3.SpeedFast image acquisition rates are the prime advantage of CRS imaging over spontaneous Raman microscopy.60 As stated above, using high repetition rate picosecond pulse trains with average powers in the 10 mW range routinely produces CRS signals with acceptable SNR in as little as a few microsecond per pixel. For an image with , this translates in acquisition rates of less than a frame per second. Such imaging speeds are on par with those of linear and multiphoton fluorescence microscopy techniques. When the number of Raman oscillators in the focal volume is relatively high, such as the number of oscillators in a micrometer-sized lipid droplet, the resulting signals are correspondingly strong and permit even shorter pixel dwell times well below a microsecond. These conditions enable video-rate scanning speeds of frames per second (see Fig. 5). Both video-rate CARS and SRS have been successfully utilized for visualization of live tissues.20,61,62 This form of real-time imaging with label-free vibrational contrast is where the imaging capabilities of CRS microscopy are most evident: it is currently impossible to accomplish such dynamic imaging studies with any other vibrational microscopy technique. 3.4.Spectral ImagingThe fastest CRS imaging studies so far have been performed in the single-frequency limit: a relatively narrow region of the spectrum is probed in which the spectral information is integrated. However, important information contained in the vibrational spectrum is not utilized in this mode of operation, thus limiting the analytical capabilities of the technique. In some studies, such as the quantitative mapping of lipid distributions in cells and tissues, operating CRS in the fast-scanning single-frequency mode is very useful.32 Yet, in other biological imaging applications, the separation of multiple spectral signatures is essential for identifying target compounds.63,64 Improving the analytical capabilities of the CRS microscope is a subtle balancing act between fast image acquisition and expanding the instrument’s sensitivity along the spectral dimension. Some of the many possible methods are sketched in Fig. 6. A straightforward approach is to broaden the spectral range in a picosecond-CRS microscope by sweeping the optical frequency of either the pump or Stokes beam, while collecting an image consecutively for each setting of the frequency.65–67 This procedure yields a spectral stack of images that can be used for further multivariate analysis (see Fig. 7).68–70 Effective spectral acquisition times are typically in the millisecond range, which is much faster than a spontaneous Raman microscope, but much slower than the microsecond dwell times of the single-frequency mode. Alternative methods include clever use of broadband sources and single photodetectors, such as sweeping a narrow spectral segment of a broader pulse spectrum,71 rapidly scanning the Raman shift in the spectral focusing technique,72,73 or collecting temporal interferograms followed by a Fourier transformation.74–76 Relative to the single-frequency mode, all these methods involve additional time to acquire the spectral information. Fig. 6Several hyperspectral CRS schemes, here shown for CARS. (a) Spectral sweeping of with narrow band pump and Stokes pulse spectra. A single point detector is used. (b) Temporal sweeping of spectrally chirped pump and Stokes pulses, also called spectral focusing. Temporal scan results in a spectral scan of with narrowband resolution while using a single point detector. (c) Temporal sweeping of two replicas of a broadband pulse, resulting in temporal interferences. A Fourier transform of the interferogram yields the spectral content. Spectral resolution is determined by the Nyquist sampling of the temporal scan. A single point detector is used. (d) Multiplex CARS with a narrowband pump pulse and a broadband Stokes pulse. The spectral resolution is determined by the width of the pump pulse. The signal is spectrally dispersed and detected by a detector array.  Fig. 7Hyperspectral SRL imaging of C. elegans. (a) SRL image at . Scale bar is 25 μm. (b) Hyperspectral image taken in the 2800 to range with spectral resolution. Colors are the RGB representation based on the weights of the three largest components from a vertex component analysis. (c) Hyperspectral image represented by the retrieved Raman spectra from a principal component analysis. Each color corresponds to a distinct Raman spectrum.  Rather than collecting the spectral dimension in a sequential manner, spectra can be acquired in a single shot by the use of spectral dispersion in combination with detector arrays. Multiplex CARS, for instance, uses a spectrometer equipped with a CCD camera for rapid acquisition of CARS spectra.77 In this fashion, broadband CARS hyperspectral imaging has been achieved in tissues and cells with effective spectral acquisition times in the tens of milliseconds range.78–80 This broadband modality is most similar to spontaneous Raman scattering, where virtually the entire vibrational spectrum is captured, which allows discovery-based spectral imaging. Note that in the complete spectral imaging mode, multiplex CARS is still more than an order of magnitude faster than the fastest spontaneous Raman microscope. As camera technology continues to improve, even faster acquisition times can be expected, taking full advantage of stronger signal levels in CRS relative to incoherent Raman. Although recording vibrational spectra is the most intuitive approach for strengthening the analytical capabilities of the CRS microscope, the coherent character of the technique allows for elegant excitation schemes that can be used to identify specific chemicals among compounds with relatively similar Raman spectra. Spectral tailoring of the excitation pulses in both amplitude and phase to optimally drive the CRS response of one particular compound, while coherently suppressing the response from others, has proven a useful strategy.49,81,82 This method takes advantage of a single photodetector, which enables data acquisition that is currently many orders of magnitude faster than what can be achieved with array-based detectors. Multifrequency CRS microscopy can, thus, be performed at the high acquisition speeds that have popularized the single-frequency approach. 3.5.Scattering and Image DepthThe imaging properties of CRS microscopy are ideally suited for generating chemical maps of tissues: submicrometer resolution, fast image acquisition, and label-free chemical contrast are essential for successful tissue imaging. The applicability of CRS is limited, however, by linear interactions of photons with tissue components: absorption and scattering of light. These processes are effectively described by the absorption coefficient and the scattering coefficient .83 At near-infrared wavelengths, in most tissue types, which makes the process of light scattering the dominant limiting factor in tissue imaging studies with focused beam geometries. Light scattering affects CRS imaging in several ways. First, scattering of incident radiation distorts the wavefront and compromises the quality of the focal volume. Due to scattering, the average shape of the focal volume increases in all dimensions, most notably along the axial coordinate. In addition to a decrease in spatial resolution, the enlarged focal spot is accompanied by a reduced density of the excitation field and, thus, a lower CRS signal. Since CRS signal generation depends on both the amplitude and phase of the focal excitation fields, spatial distortions of the focus affect CRS signals more prominently than fluorescence signals, which only scale with the focal intensity. Second, scattering can alter the propagation direction of the incident photon waves, lowering the total amount of photons that constructively interfere at the location of the focal spot. Assuming that light scattering in a given optical tissue can be described by a single scattering coefficient, the intensity in the focus at depth in the tissue is roughly for each beam, where is the incident intensity before entering the specimen. This effect alone results in an exponential decay of the CRS excitation efficiency as the probing volume is focused deeper into the tissue. Third, after the CRS signal is generated, light scattering impacts the propagation of the signal in the tissue and, thus, influences the amount of signal that can be retrieved at the photodetector. In general, the effect of light scattering on CRS imaging is akin to the problems encountered in virtually all forms of focused beam microscopy, including confocal microscopy and multiphoton fluorescence microscopy. In addition, the enhanced sensitivity of CRS to focal field distortions due to the coherent nature of the signal is very similar to the situation in SHG microscopy. Nonetheless, because CRS relies on focusing different color incident fields to the same focal spot, chromatic aberrations related to the dispersive properties of the sample can reduce the depth-dependent image quality in CRS microscopy relative to SHG and multiphoton fluorescence microscopy. The combined effects of light scattering compromise the ability to acquire images deeper in the tissue.84 In CRS, depending on the tissue type and excitation wavelength, typical penetration depths are between 0.15 and 0.50 mm when high-NA lenses are used. The shallow imaging depth of CRS microscopy is a serious limitation for tissue imaging applications, especially in vivo. Many tissue abnormalities manifest themselves at tissue layers deeper than 0.5 mm, emphasizing the need to push the technical capabilities beyond the current numbers. Research in the area of adaptive optics85 and the development of modulation techniques86 for improving the SNR deeper in the tissue are examples of efforts in this direction. An alternative strategy is the use of excitation frequencies in a spectral window where tissue scattering is inherently small. This approach has been successfully used in multiphoton fluorescence and third-harmonic generation (THG) microscopy, where imaging depths down to 1 mm were achieved with excitation wavelengths in the 1.2 to 1.7 μm range.87,88 Despite the deleterious effects of light scattering, the redirection of light in the tissue is nonetheless an essential mechanism that enables epi-detection of CRS signals from thick tissue samples. CRS radiation in thick scattering samples is generally attenuated to undetectable levels in the forward-propagating direction, rendering epi-detection the only feasible option for intercepting the CRS signal in, for instance, tissue imaging of animals in vivo.61 Because the CRS signal is phase-matched in the forward direction, most of the signal would go undetected in the absence of light scattering, as signal photons would not be redirected toward the epi-detector. The principle of backscattering of CRS signals is sketched in Fig. 8. Up to 40 to 45% of the forward-propagating CRS signal is backscattered, and a significant portion of this light can be detected, especially when the aperture of the detector is large.62 Note that although most of the signal detected in the epi-direction is backscattered, the spatial resolution of the image is not compromised by the detection configuration. This is because the resolution is defined by the size of the probing volume, and not by scattering that occurs after generation of the CRS radiation. Similarly, postgeneration scattering also does not affect the interference between the signal field and incident field that underlies the SRS process [Eq. (7)]. Because the fields have the same optical frequency and are phase coherent in the interaction volume, subsequent light scattering in the tissue, which is deterministic, affects both fields in exactly the same manner and, thus, preserves coherence among them.89 Fig. 8Backscattering of CRS radiation in turbid media. Although most CRS signal is initially propagating in the phase-matched forward direction, linear scattering at tissue structures redirects a large portion of the CRS signal in the backward direction, enabling epi-detection with acceptable collection efficiency.  3.6.PhotodamageEquation (9) suggests that the CRS signal rapidly grows when the average excitation intensity is increased. Nonetheless, photodamaging of the sample prevents a continual increase of the signal with incident power as higher powers inevitably lead to damage of the specimen. Photodamage may result from a plethora of mechanisms, which are all highly dependent on the excitation conditions and the material properties of the specimen. General rules that predict photodamage are, therefore, difficult to synthesize. A useful categorization of photodamaging mechanisms takes into consideration the intensity dependence of the damaging process. As indicated above, both linear and nonlinear photodamage may occur to the sample. Linear photodamage is the result of linear absorption and subsequent heating of the sample. For instance, local increases in the temperature of a few degrees or more can negatively impact cell functions and may result in cell abnormalities or trigger apoptosis. Substantial rises in local temperature may occur when strong absorbers are present in the sample at relatively high concentrations. Examples include chromophores such as carotenoids and chlorophylls in plant tissues and melanin in human skin. When the tissue is devoid of strongly absorbing chromophores, linear heating in aqueous environments is generally small, much less than a degree in fast imaging applications, for near-infrared pulsed excitation and average powers .90,91 Nonlinear photodamage includes heating of UV chromophores after multiphoton absorption, Raman heating, and the excitation of high-energy molecular states that are reactive. The latter process can generate photoproducts that are toxic, such as highly reactive radicals.92 In the high intensity limit, nonlinear processes can also ionize the sample and generate local plasmas.93 Several experiments indicate that under typical CRS conditions, using high-repetition rate, near-infrared picosecond pulses at average powers of 10 mW or more, both linear and nonlinear effects contribute to photodamaging in live cells.50,94 Although the effects of laser illumination on biological samples can never be fully avoided, keeping average powers and pulse energies has been shown to minimize the impact of light-induced changes to cell cultures under fast CRS imaging conditions. 4.Applications4.1.When is CRS a Good Choice?Many biological microscopy studies rely on the use of fluorescent markers to achieve molecular selectivity. There is no doubt that labeling with fluorescent agents is a highly successful strategy in cellular biology, yet there are many applications in which label-free imaging is essential. Fluorescent labeling is not without artifacts. First, labeling target compounds can be incomplete or nonuniform. An example is found in visualizing lipids with established fluorophores, such as Oil Red O and Nile Red. It has been reported that these agents label lipid distributions unevenly and sometimes color nonlipid structures.95,96 Labeling artifacts complicate quantitative analysis of lipids in cells and tissues considerably. Second, some fluorescent agents interfere with cellular function, especially at higher concentrations. Putative toxicity of labeling agents is a serious issue that may affect, implicitly and/or explicitly, the interpretation of fluorescence microscopy measurements. Third, virtually all fluorophores photobleach over time, which limits the observation time window of the experiment. Fourth, not all molecular compounds can be associated with a fluorescent label. This shortcoming is particularly relevant to small molecules, such as water, inorganic polyatomic ions, and small molecular metabolites, for which fluorescent probes currently do not exist. Label-free imaging avoids all of these issues. CRS microscopy fills in an important void in the field biological imaging by offering label-free molecular imaging at speeds that are relevant to cell and tissue biology. However, CRS microscopy is not a cure-all solution for biological problems where fluorescence imaging fails. The molecular selectivity of CRS is linked to information contained in the sample’s Raman spectrum. The Raman effect is sensitive to particular chemical bonds and chemical groups. Many biomolecular compounds are composed of a limited set of chemical motifs, most notably motifs formed from chemical bonds among carbon, hydrogen, oxygen, and nitrogen atoms. This implies that the number of distinct Raman resonances is finite and that many molecules that share similar motifs also exhibit comparable Raman signatures. A case in point is the Raman spectrum of protein structures. Although proteins are functionally incredibly diverse, chemically they display limited variation: all proteins are built from polypeptide chains, which contain only a limited set of chemical groups. Hence, differences in the vibrational spectra of different proteins are either negligible or extraordinarily subtle, rendering vibrational imaging virtually inadequate for discriminating proteins. CRS microscopy is a good choice for visualizing biomolecular compounds in biological samples when the molecular target (1) is present at locally high concentrations such that it is spatially separated from other sample components or (2) exhibits unique Raman signatures that can be discriminated from other compounds in the sample. The first situation is relevant when imaging lipids, water, or the overall protein distribution in biological materials. These molecular classes are present at high local concentrations in cells and tissues and can be identified with confidence in a CRS microscope. Using hyperspectral CRS, lipid pools can be analytically examined and information on degree of saturation, lipid packing density, and lipid class (sterols versus aliphatic lipids) can be retrieved from the vibrational spectra. Discrimination of these molecular classes is important in tissue imaging, where lipid and protein densities demarcate cells and tissue components, generating tissue maps with essential diagnostic contrast akin to what can be obtained with traditional hematoxylin/eosin stains.97,98 Many successful CRS studies have used the strong signatures of methyl, methylene, and methine stretching modes in the Raman spectrum (2800 to ) as the contrast mechanism for fast imaging. However, the application of CRS is by no means limited to the CH-stretching range of the vibrational spectrum. Many CRS studies have focused on the fingerprint region ( to ), which harbors a rich set of molecular vibrations that enable a deeper level of chemical analysis than what can be attained with the modes in the CH-stretching range alone. Broadband CARS studies are a good example in which the full range of fingerprint signatures are used to discriminate cellular compartments.78,80 In addition, the number of single-frequency CRS studies that use fingerprint contrast for biological imaging is steadily growing.40,64 Although many molecular compounds in biology exhibit similar chemical groups, there are many others that can be uniquely identified by means of their vibrational signatures. Many exogenous molecules, such as pharmaceuticals and their carrier materials, have spectral features that are notably different from the spectral properties of tissues. For instance, the strong aromatic ring-breathing mode () of a drug like ketoprofen is not very abundant in endogenous compounds of the tissue matrix, enabling a reliable identification of the drug when dialing in at the Raman frequency of this band.99,100 Another excellent example is the use of deuterated analogs of the targeted biomolecule. When replacing hydrogen with deuterium, vibrational mode frequencies shift often to a quiet range of the vibrational spectrum where bands of endogenous constituents are scarce (see Fig. 9). This approach has been widely used in high-speed CRS microscopy to rapidly identify the compound of interest in tissues and cells, including flowing water,28 phospholipids,101,102 neutral lipids,103 and drug compounds.100,104 Recently, the unique vibrational contrast of isotope-labeled compounds has also been employed to visualize de novo synthesis of macromolecules in cells by feeding them small deuterated precursor molecules that become permanently incorporated in newly synthesized biomolecular components.105 Fig. 9Improving selectivity in CRS imaging with isotope labeling. Shown here is the Raman spectrum of partially deuterated (d-) cholesterol, introducing C-D specific bands in the 2000 to range. Insets show SRL images of d-cholesterol crystals, demonstrating the good spectral selectivity that can be obtained with isotope labeling. Scale bar is 100 μm.  The use of isotope labels is part of a wider strategy that aims to develop efficient Raman labels.106 In contrast to fluorescence labeling, Raman labels can be very small. In the case of isotope labeling, a single element in the molecule is replaced with its isotope, which has minimal chemical impact, yielding a probe with virtually the same size as the original molecule. The advantage of Raman labels over fluorescent labels is clear: the probes minimally disrupt regular cell function and do not photobleach, allowing persistent imaging over long timescales. The discussion above underlines that CRS microscopy is an excellent choice for biological imaging when molecular compounds with strong and accessible vibrational signatures are targeted. In these cases, fast imaging of cells and tissue can be performed. The enhanced speed of CRS imaging over spontaneous Raman scattering microscopy not only enables dynamic measurements of biological samples in vivo, but also facilitates studies that necessitate examination of larger tissue areas. CRS microscopy makes it possible to quantitatively analyze mesoscale tissue samples without compromising spatial resolution. In next subsections, we illustrate the utility of CRS microscopy by discussing two typical applications. 4.2.CellsLipids have been the most successful molecular targets in CRS microscopy applications. The reason for strong and distinct lipid CRS signals is the high local concentration of carbon-hydrogen bonds that can be found in lipid deposits, producing bright CARS and SRS signals when tuned to the C-H stretching range of the spectrum. Submicrometer-sized lipid droplets give rise to CRS signals that are many times higher than other resonant and nonresonant contributions from the cell, allowing their rapid identification in live cells. Although other label-free techniques, such as THG, have been shown to display sensitivity to lipid droplets as well, CRS is superior in terms of chemical selectivity and contrast.107 Lipid droplets are the cell’s prime reservoirs of neutral lipids and they are implicated in many key cellular processes. CRS microscopy is fast enough to track the motions of such intracellular droplets. But CRS is also the method of choice for quantitative analysis of lipid quantities in cell cultures. Such quantitative studies require sampling of many cells, and speed is of essence to cover significant parts of the cell population within a realistic time frame. An example is shown in Fig. 10, where the lipid content in macrophages is determined as a function of external signaling molecules (cytokines) and the presence of endotoxins. CRS enables rapid imaging of hundreds of cells, and in combination with automated lipid droplet counting algorithms,108 it facilitates the discovery of statistically significant trends among cell populations. Fig. 10Statistics of lipid droplets with CRS imaging. (a) CARS image of lipid droplets in macrophage cell. Scale bar is 25 μm. (b) Automatic recognition of lipid droplets enables rapid counting of the number of lipid droplets per cell (light blue indicates a recognized droplet). (c) Fast CRS imaging makes it possible to examine lipid droplet contents in hundreds of cells, giving rise to reliable statistics. Here the number of lipid droplets per cell is determined for macrophage cells exposed to different cytokines and endotoxin, from a total of 1200 cells.  4.3.TissuesThe desired imaging properties for interrogating cell cultures versus three-dimensional tissues are not exactly the same. Although imaging of individual cells requires high spatial resolution and contrast to visualize intracellular details, tissue-level imaging is more forgiving in terms of the ultimate spatial resolution but requires fast acquisition of large volumetric datasets with sustained signal quality. CRS microscopy is well suited for the task of generating mesoscale tissue maps with micrometer resolution. In addition, the CRS chemical contrast from molecular classes in the tissue, such as lipids, protein distributions, and water, are meaningful and can be routinely achieved at high imaging speeds. In many cases, sufficient information about proteins and lipids can be obtained by examining a very limited region of the vibrational spectrum. Relative to collecting broad spectra, limiting the spectral range increases acquisition rates, which is essential for mapping tissues over larger areas. Hyperspectral datasets from a limited spectral range, such as the CH-stretching range of the spectrum, may yield enough discriminatory spectral features to identify tissue components.109 Figure 11 shows an example of a narrow hyperspectral stack acquired from muscle tissue. The protein matrix, which displays a low concentration of aliphatic molecules, can be readily separated from areas with higher concentrations of lipid-like compounds, which in muscle tissue most likely correspond to mitochondrial tubules.110 Note that the differences in the spectra are subtle, yet are sufficient for a reliable mapping of functional units in the tissue. These are the types of applications where the imaging properties of CRS are in full effect: label-free chemical contrast, fast image acquisition, and (sub)micrometer resolution. Fig. 11Hyperspectral SRL imaging of mouse muscle tissue. (a) RGB image representation of the dataset based on the three largest components from a vertex component analysis (VCA). (b) VCA retrieved spectra showing a protein-rich spectrum (green), a protein spectrum mixed with lipids (red), and a water-dominated spectrum (blue). Image size is .  5.ConclusionIn this tutorial, we have discussed the physical origin of CRS signals, its implementation in microscopy, and its usefulness for biological research. CRS contrast is now a trusted complement to existing contrast mechanisms in optical microscopy. Its uses are rapidly expanding, as witnessed by the explosive rise in the number of publications that use CRS as a tool for solving biological problems. With the availability of commercial CRS systems and modules, its impact in biology is likely to grow even more significant. Nonetheless, as CRS microscopy gradually finds its way into the mainstream, the quality of future imaging studies remains contingent on a basic understanding of the principles of the technique, its technical merits, and the scope of its applicability. These relevant issues formed the basis of this tutorial and were touched on herein. AcknowledgmentsWe acknowledge support from NSF grant CHE-0847097, NIH grant P41-RR01192 (Laser Microbeam and Medical Program, LAMMP), the Balsells Fellowship Program, and the Agilent University Research Grant. E.S.L. thanks the support from Bio-signal Analysis Technology Innovation Program funded by the Ministry of Science, ICT and Future Planning, Republic of Korea. ReferencesE. J. WoodburyW. K. Ng,
“Ruby laser operation in the near IR,”
Proc. IRE, 50
(11), 2347
–2348
(1962). http://dx.doi.org/10.1109/JRPROC.1962.287962 PIREAE 0096-8390 Google Scholar
G. Eckhardtet al.,
“Stimulated Raman scattering from organic liquids,”
Phys. Rev. Lett., 9
(11), 455
–457
(1962). http://dx.doi.org/10.1103/PhysRevLett.9.455 PRLTAO 0031-9007 Google Scholar
M. DuncanJ. ReintjesT. J. Manuccia,
“Scanning coherent anti-Stokes Raman microscope,”
Opt. Lett., 7
(8), 350
–352
(1982). http://dx.doi.org/10.1364/OL.7.000350 OPLEDP 0146-9592 Google Scholar
M. D. Levenson,
“Inteference of resonant and nonresonant three-wave mixing in diamond,”
Phys. Rev. B, 6 3962
–3965
(1972). http://dx.doi.org/10.1103/PhysRevB.6.3962 PRBMDO 0163-1829 Google Scholar
R. F. BegleyA. B. HarveyR. L. Byer,
“Coherent anti-Stokes Raman spectroscopy,”
Appl. Phys. Lett., 25
(7), 387
–390
(1974). http://dx.doi.org/10.1063/1.1655519 APPLAB 0003-6951 Google Scholar
R. J. HallA. C. Eckbreth,
“Coherent anti-Stokes Raman spectroscopy: applications to combustion diagnostics,”
Laser Applications, Academic, New York
(1982). Google Scholar
A. LaubereauW. Kaiser,
“Vibrational dynamics of liquids and solids investigated by picosecond light pulses,”
Rev. Mod. Phys., 50
(3), 607
–665
(1978). http://dx.doi.org/10.1103/RevModPhys.50.607 RMPHAT 0034-6861 Google Scholar
K. A. NelsonE. P. Ippen,
“Femtosecond coherent spectroscopy,”
Adv. Chem. Phys., 75 1
–35
(1989). http://dx.doi.org/10.1002/SERIES2007 ADCPAA 0065-2385 Google Scholar
S. Mukamel,
“Femtosecond optical spectroscopy: a direct look at elementary chemical events,”
Annu. Rev. Phys. Chem., 41 647
–681
(1990). http://dx.doi.org/10.1146/annurev.pc.41.100190.003243 ARPLAP 0066-426X Google Scholar
A. C. Eckbreth,
“BOXCARS: crossed-beam phase-matched CARS generation in gases,”
Appl. Phys. Lett., 32
(7), 421
–423
(1978). http://dx.doi.org/10.1063/1.90070 APPLAB 0003-6951 Google Scholar
A. ZumbuschG. HoltomX. S. Xie,
“Vibrational microscopy using coherent anti-Stokes Raman scattering,”
Phys. Rev. Lett., 82
(20), 4142
–4145
(1999). http://dx.doi.org/10.1103/PhysRevLett.82.4142 PRLTAO 0031-9007 Google Scholar
J.-X. ChengA. VolkmerX. S. Xie,
“Theoretical and experimental characterization of coherent anti-Stokes Raman scattering microscopy,”
J. Opt. Soc. Am. B, 19
(6), 1363
–1375
(2002). http://dx.doi.org/10.1364/JOSAB.19.001363 JOBPDE 0740-3224 Google Scholar
J. X. ChengX. S. Xie, Coherent Raman Scattering Microscopy, CRC Press, Boca Raton
(2013). Google Scholar
Leica-MicroSystems, “TCS CARS,”
http://www.leica-microsystems.com/products/confocal-microscopes/details/product/leica-tcs-cars/ Google Scholar
Olympus, “FV1200 MPE FemtoCARS,”
http://www.olympusamerica.com/seg_section/product.asp?product=1068&intCmp=seg_rdct_cars Google Scholar
Y. Fuet al.,
“Coherent anti-Stokes Raman scattering imaging of myelin degradation reveals a calcium-dependent pathway in lyo-PtdCho-induced demyelination,”
J. Neurosci. Res., 85
(13), 2870
–2881
(2007). http://dx.doi.org/10.1002/(ISSN)1097-4547 JNREDK 0360-4012 Google Scholar
T. B. HuffJ. X. Cheng,
“In vivo coherent anti-Stokes Raman scattering imaging of sciatic nerve tissues,”
J. Microsc., 225
(2), 175
–182
(2007). http://dx.doi.org/10.1111/jmi.2007.225.issue-2 JMICAR 0022-2720 Google Scholar
T. B. Huffet al.,
“Multimodel nonlinear optical microscopy and applications to central nervous system,”
IEEE J. Sel. Topics Quantum Electron., 14
(1), 4
–9
(2008). http://dx.doi.org/10.1109/JSTQE.2007.913419 IJSQEN 1077-260X Google Scholar
F. Henryet al.,
“Real-time in vivo assessment of the nerve microenvironment with coherent anti-Stokes Raman scattering microscopy,”
Plast. Reconstr. Surg., 123
(S2), 123S
–130S
(2009). http://dx.doi.org/10.1097/PRS.0b013e318191c5b8 PRSUAS 0032-1052 Google Scholar
E. Bélangeret al.,
“In vivo evaluation of demyelination and remyelination in a nerve crush injury model,”
Biomed. Opt. Express, 2
(9), 2698
–2708
(2011). http://dx.doi.org/10.1364/BOE.2.002698 BOEICL 2156-7085 Google Scholar
A. FolickW. MinM. C. Wang,
“Label-free imaging of lipid dynamics using coherent anti-Stokes Raman scattering (CARS) and stimulated Raman scattering microscopy,”
Curr. Opin. Genet. Dev., 21
(5), 585
–590
(2011). http://dx.doi.org/10.1016/j.gde.2011.09.003 COGDET 0959-437X Google Scholar
C. H. Chienet al.,
“Label-free imaging of Drosophila in vivo by coherent anti-Stokes Raman scattering and two-photon excitation fluorescence microscopy,”
J. Biomed. Opt., 16
(1), 016012
(2011). http://dx.doi.org/10.1117/1.3528642 JBOPFO 1083-3668 Google Scholar
T. T. Leet al.,
“Label-free molecular imaging of atherosclerotic lesions using multimodal nonlinear optical microscopy,”
J. Biomed. Opt., 12
(5), 054007
(2007). http://dx.doi.org/10.1117/1.2795437 JBOPFO 1083-3668 Google Scholar
H. W. Wanget al.,
“Imaging and quantitative ananlysis of atherosclerotic lesions by CARS-based multimoddal nonlinear optical microscopy,”
Artherioscler. Thromb. Vasc. Biol., 29 1342
–1342
(2009). http://dx.doi.org/10.1161/ATVBAHA.109.189316 1079-5642 Google Scholar
S. H. Kimet al.,
“Multiplex coherent anti-Stokes Raman spectroscopy images intact atheromatous lesions and concomitantly identifies distinct chemical profiles of atherosclerotic lipids,”
Circ. Res., 106 1332
–1341
(2010). http://dx.doi.org/10.1161/CIRCRESAHA.109.208678 CIRUAL 0009-7330 Google Scholar
L. B. Mostaço-Guidolinet al.,
“Differentiating atherosclerotic plaque burden in arterial tissues using femtosecond CARS-based multimodal nonlinear imaging,”
Biomed. Opt. Express, 1
(1), 59
–73
(2010). http://dx.doi.org/10.1364/BOE.1.000059 BOEICL 2156-7085 Google Scholar
J. L. Suhalimet al.,
“Characterization of cholesterol crystals in atherosclerotic plaques using stimulated Raman scattering and second-harmonic generation microscopy,”
Biophys. J., 102
(8), 1988
–1995
(2012). http://dx.doi.org/10.1016/j.bpj.2012.03.016 BIOJAU 0006-3495 Google Scholar
E. O. Potmaet al.,
“Real-time vizualization of intracellular hydrodynamics,”
Proc. Natl. Acad. Sci. U. S. A., 98
(4), 1577
–1582
(2001). http://dx.doi.org/10.1073/pnas.98.4.1577 1091-6490 Google Scholar
Y.-C. Yuet al.,
“Direct visualization and quantitative analysis of water diffusion in complex biological tissues using CARS microscopy,”
Sci. Rep., 3 2745
(2013). http://dx.doi.org/10.1038/srep02745 BANRAR 0068-1261 Google Scholar
C. Y. ChungJ. C. BoikE. O. Potma,
“Biomolecular imaging with coherent nonlinear vibrational microscopy,”
Annu. Rev. Anal. Chem., 64 77
–99
(2013). http://dx.doi.org/10.1146/annurev-physchem-040412-110103 ARACFU 1936-1327 Google Scholar
J. P. Pezackiet al.,
“Chemical contrast for imaging living systems: molecular vibrations drive CARS microscopy,”
Nat. Chem. Biol., 7 137
–145
(2011). http://dx.doi.org/10.1038/nchembio.525 1552-4450 Google Scholar
T. T. LeS. YueJ. X. Cheng,
“Shedding new light on lipid biology with coherent anti-Stokes Raman scattering microscopy,”
J. Lipid Res., 51 3091
–3102
(2010). http://dx.doi.org/10.1194/jlr.R008730 JLPRAW 0022-2275 Google Scholar
C. L. EvansX. S. Xie,
“Coherent anti-Stokes Raman scattering microscopy: chemical imaging for biology and medicine,”
Annu. Rev. Anal. Chem., 1 883
–909
(2008). http://dx.doi.org/10.1146/annurev.anchem.1.031207.112754 ARACFU 1936-1327 Google Scholar
G. Placzek,
“Rayleigh Streuung und Raman-Effeckt,”
Handbuch der Radiologie, 205 Academische-Verlag, Leipzig
(1934). Google Scholar
C. W. Freudigeret al.,
“Label-free biomedical imaging with high sensitivity by stimulated Raman scattering microscopy,”
Science, 322
(5909), 1857
–1861
(2008). http://dx.doi.org/10.1126/science.1165758 SCIEAS 0036-8075 Google Scholar
W. Minet al.,
“Coherent nonlinear optical microscopy: beyond fluorescence microscopy,”
Annu. Rev. Phys. Chem., 62 507
–530
(2011). http://dx.doi.org/10.1146/annurev.physchem.012809.103512 ARPLAP 0066-426X Google Scholar
P. NandakumarA. KovalevA. Volkmer,
“Vibrational imaging based on stimulated Raman scattering,”
New. J. Phys., 11 033026
(2009). http://dx.doi.org/10.1088/1367-2630/11/3/033026 NJOPFM 1367-2630 Google Scholar
Q. Sunet al.,
“Label-free multimodal nonlinear optical microscopy reveals fundamental insights of skeletal muscle development,”
Biomed. Opt. Express, 5
(1), 158
–166
(2014). http://dx.doi.org/10.1364/BOE.5.000158 BOEICL 2156-7085 Google Scholar
F. Luet al.,
“Integrated coherent anti-Stokes Raman scattering and multiphoton microscopy for biomolecular imaging using spectral filtering of a femtosecond laser,”
Appl. Phys. Lett., 96
(13), 133701
(2010). http://dx.doi.org/10.1063/1.3377905 APPLAB 0003-6951 Google Scholar
J. L. Suhalimet al.,
“Effect of desiccating stress on mouse meibomian gland function,”
Ocul. Surf., 12
(1), 59
–68
(2014). http://dx.doi.org/10.1016/j.jtos.2013.08.002 1542-0124 Google Scholar
K. I. Popovet al.,
“Image formation in CARS and SRS: effect of an inhomogeneous nonresonant background medium,”
Opt. Lett., 37
(4), 473
–475
(2012). http://dx.doi.org/10.1364/OL.37.000473 OPLEDP 0146-9592 Google Scholar
C.-Y. Chunget al.,
“Controlling stimulated coherent spectroscopy and microscopy by a position-dependent phase,”
Phys. Rev. A, 87
(3), 033833
(2013). http://dx.doi.org/10.1103/PhysRevA.87.033833 PLRAAN 1050-2947 Google Scholar
C.-R. Huet al.,
“Stimulated Raman scattering imaging by continuous-wave laser excitation,”
Opt. Lett., 38
(9), 1479
–1481
(2013). http://dx.doi.org/10.1364/OL.38.001479 OPLEDP 0146-9592 Google Scholar
D. ZhangM. N. SlipchenkoJ.-X. Cheng,
“Highly sensitive vibrational imaging by femtosecond pulse stimulated Raman loss,”
J. Phys. Chem. Lett., 2
(11), 1248
–1253
(2011). http://dx.doi.org/10.1021/jz200516n 1948-7185 Google Scholar
J. X. Chenget al.,
“An epi-detected coherent anti-Stokes Raman scattering (E-CARS) microscope with high resolution and high sensitivity,”
J. Phys. Chem. B, 105 1277
–1280
(2001). http://dx.doi.org/10.1021/jp003774a JPCBFK 1520-6106 Google Scholar
N. DudovichD. OronY. Silberberg,
“Single-pulse coherently controlled nonlinear Raman spectroscopy and microscopy,”
Nature, 418 512
–514
(2002). http://dx.doi.org/10.1038/nature00933 NATUAS 0028-0836 Google Scholar
A. C. W. van Rhijnet al.,
“Exploring, tailoring, and traversing the solution landscape of a phase-shaped CARS process,”
Opt. Express, 18
(3), 2695
–2709
(2010). http://dx.doi.org/10.1364/OE.18.002695 OPEXFF 1094-4087 Google Scholar
T. HellererA. M. K. EnejderA. Zumbusch,
“Spectral focusing: high spectral resolution spectroscopy with broad-bandwidth laser pulses,”
Appl. Phys. Lett., 85
(1), 25
–27
(2004). http://dx.doi.org/10.1063/1.1768312 APPLAB 0003-6951 Google Scholar
C. W. Freudigeret al.,
“Highly specific label-free molecular imaging with spectrally tailored excitation-stimulated Raman scattering (STE-SRS) microscopy,”
Nat. Photonics, 5 103
–109
(2011). http://dx.doi.org/10.1038/nphoton.2010.294 1749-4885 Google Scholar
X. NanE. O. PotmaX. S. Xie,
“Nonperturbative chemical imaging of organelle transport in living cells with coherent anti-Stokes Raman scattering microscopy,”
Biophys. J., 91
(2), 728
–735
(2006). http://dx.doi.org/10.1529/biophysj.105.074534 BIOJAU 0006-3495 Google Scholar
E. O. Potmaet al.,
“High-sensitivity coherent anti-Stokes Raman scattering microscopy with two tightly synchronized picosecond lasers,”
Opt. Lett., 27
(13), 1168
–1170
(2002). http://dx.doi.org/10.1364/OL.27.001168 OPLEDP 0146-9592 Google Scholar
S. Brustleinet al.,
“Optical parametric oscillator-based light source for coherent Raman scattering microscopy: practical overview,”
J. Biomed. Opt., 16
(2), 021106
(2011). http://dx.doi.org/10.1117/1.3533311 JBOPFO 1083-3668 Google Scholar
E. R. Andresenet al.,
“Broadband multiplex coherent anti-Stokes Raman scattering microscopy employing photonic-crystal fibers,”
J. Opt. Soc. Am. B, 22
(9), 1934
–1938
(2005). http://dx.doi.org/10.1364/JOSAB.22.001934 JOBPDE 0740-3224 Google Scholar
T. W. KeeM. T. Cicerone,
“Simple approach to one-laser, broadband coherent anti-Stokes Raman scattering microscopy,”
Opt. Lett., 29
(23), 2701
–2703
(2004). http://dx.doi.org/10.1364/OL.29.002701 OPLEDP 0146-9592 Google Scholar
C. XuF. W. Wise,
“Recent advances in fibre lasers for nonlinear microscopy,”
Nat. Photonics, 7 875
–882
(2013). http://dx.doi.org/10.1038/nphoton.2013.284 1749-4885 Google Scholar
M. Baumgartlet al.,
“All-fiber laser source for CARS microscopy based on fiber optical parametric frequency conversion,”
Opt. Express, 20
(4), 4484
–4493
(2012). http://dx.doi.org/10.1364/OE.20.004484 OPEXFF 1094-4087 Google Scholar
A. F. Pegoraroet al.,
“All-fiber CARS microscopy of live cells,”
Opt. Express, 17
(23), 20700
–20706
(2009). http://dx.doi.org/10.1364/OE.17.020700 OPEXFF 1094-4087 Google Scholar
E. R. Andresenet al.,
“Fiber laser-based light source for coherent anti-Stokes Raman scattering microspectroscopy,”
Opt. Express, 15
(8), 4848
–4856
(2007). http://dx.doi.org/10.1364/OE.15.004848 OPEXFF 1094-4087 Google Scholar
K. Noseet al.,
“Sensitivity enhancement of fiber-laser-based stimulated Raman scattering microscopy by collinear balanced detection technique,”
Opt. Express, 20
(13), 13958
–13965
(2012). http://dx.doi.org/10.1364/OE.20.013958 OPEXFF 1094-4087 Google Scholar
J. L. Suhalimet al.,
“The need for speed,”
J. Biophotonics, 5
(5–6), 387
–396
(2012). http://dx.doi.org/10.1002/jbio.v5.5/6 JBOIBX 1864-063X Google Scholar
C. L. Evanset al.,
“Chemical imaging of tissue in vivo with video-rate coherent anti-Stokes Raman scattering (CARS) microscopy,”
Proc. Natl. Acad. Sci. U. S. A., 102
(46), 16807
–16812
(2005). http://dx.doi.org/10.1073/pnas.0508282102 1091-6490 Google Scholar
B. G. Saaret al.,
“Video-rate molecular imaging in vivo with stimulated Raman scattering,”
Science, 330
(6009), 1368
–1370
(2010). http://dx.doi.org/10.1126/science.1197236 SCIEAS 0036-8075 Google Scholar
T. Meyeret al.,
“Expanding multimodal microscopy by high spectral resolution coherent anti-Stokes Raman scattering imaging for clinical disease diagnostics,”
Anal. Chem., 85
(14), 6703
–6715
(2013). http://dx.doi.org/10.1021/ac400570w ANCHAM 0003-2700 Google Scholar
P. Wanget al.,
“Label-free quantitative imaging of cholesterol in intact tissues by hyperspectral stimulated Raman scattering microscopy,”
Angew. Chem. Int. Ed., 52
(49), 13042
–13046
(2013). http://dx.doi.org/10.1002/anie.v52.49 ACIEAY 0570-0833 Google Scholar
C. Y. Linet al.,
“Picosecond spectral coherent anti-Stokes Raman scattering (CARS) imaging with prinicpal component analysis of meibomian glands,”
J. Biomed. Opt., 16
(2), 021104
(2011). http://dx.doi.org/10.1117/1.3533716 JBOPFO 1083-3668 Google Scholar
S. Béginet al.,
“Coherent anti-Stokes Raman scattering hyperspectral tissue imaging with a wavelength-swept system,”
Biomed. Opt. Express, 2
(5), 1296
–1306
(2011). http://dx.doi.org/10.1364/BOE.2.001296 BOEICL 2156-7085 Google Scholar
E. T. Garbaciket al.,
“Rapid identification of heterogeneous mixture components with hyperspectral coherent anti-Stokes Raman scattering imaging,”
J. Raman Spectrosc., 43
(5), 651
–655
(2012). http://dx.doi.org/10.1002/jrs.4064 JRSPAF 0377-0486 Google Scholar
D. Zhanget al.,
“Quantitative vibrational imaging by hyperspectral stimulated Raman scattering microscopy and multivariate curve resolution analysis,”
Anal. Chem., 85
(1), 98
–106
(2012). http://dx.doi.org/10.1021/ac3019119 ANCHAM 0003-2700 Google Scholar
R. S. Limet al.,
“Identification of cholesterol crystals in plaques of atherosclerotic mice using hyperspectral CARS imaging,”
J. Lipid Res., 52 2177
–2186
(2011). http://dx.doi.org/10.1194/jlr.M018077 JLPRAW 0022-2275 Google Scholar
F. Masiaet al.,
“Quantitative chemical imaging and unsupervised analysis using hyperspectral coherent anti-Stokes Raman scattering microscopy,”
Anal. Chem., 85
(22), 10820
–10828
(2013). http://dx.doi.org/10.1021/ac402303g ANCHAM 0003-2700 Google Scholar
P. WangJ. R. RajianJ.-X. Cheng,
“Spectroscopic imaging of deep tissue through photoacoustic detection of molecular vibration,”
J. Phys. Chem. Lett., 4
(13), 2177
–2185
(2013). http://dx.doi.org/10.1021/jz400559a 1948-7185 Google Scholar
D. Fuet al.,
“Hyperspectral imaging with stimulated Raman scattering by chirped femtosecond lasers,”
J. Phys. Chem. B, 117
(16), 4634
–4640
(2013). http://dx.doi.org/10.1021/jp308938t JPCBFK 1520-6106 Google Scholar
A. F. Pegoraroet al.,
“Hyperspectral multimodal CARS microscopy in the fingerprint region,”
J. Biophotonics, 7
(1–2), 49
–58
(2014). http://dx.doi.org/10.1002/jbio.v7.1/2 JBOIBX 1864-063X Google Scholar
J. P. Ogilvieet al.,
“Fourier-transform coherent anti-Stokes Raman scattering microscopy,”
Opt. Lett., 31
(4), 480
–482
(2006). http://dx.doi.org/10.1364/OL.31.000480 OPLEDP 0146-9592 Google Scholar
P. D. Chowdaryet al.,
“High speed nonlinear interferometric vibrational analysis of lipids by spectral decomposition,”
Anal. Chem., 82
(9), 3812
–3818
(2010). http://dx.doi.org/10.1021/ac100222c ANCHAM 0003-2700 Google Scholar
T. Ideguchiet al.,
“Coherent Raman spectro-imaging with laser frequency combs,”
Nature, 502 355
–358
(2013). http://dx.doi.org/10.1038/nature12607 NATUAS 0028-0836 Google Scholar
M. MüllerJ. M. Schins,
“Imaging the thermodynamic state of lipid membranes with multiplex CARS microscopy,”
J. Phys. Chem. B, 106
(14), 3715
–3723
(2002). http://dx.doi.org/10.1021/jp014012y JPCBFK 1520-6106 Google Scholar
S. H. Parekhet al.,
“Label-free cellular imaging by broadband coherent anti-Stokes Raman scattering microscopy,”
Biophys. J., 99
(8), 2695
–2704
(2010). http://dx.doi.org/10.1016/j.bpj.2010.08.009 BIOJAU 0006-3495 Google Scholar
C. PohlingT. BuckupM. Motzkus,
“Hyperspectral data processing for chemoselective multiplex coherent anti-Stokes Raman scattering microscopy of unknown samples,”
J. Biomed. Opt., 16
(2), 021105
(2011). http://dx.doi.org/10.1117/1.3533309 JBOPFO 1083-3668 Google Scholar
M. Okunoet al.,
“Quantitative CARS molecular fingerprinting of single living cells with the use of the maxium entropy method,”
Angew. Chem., 49
(38), 6773
–6777
(2010). http://dx.doi.org/10.1002/anie.201001560 ANCEAD 0044-8249 Google Scholar
H. L. Offerhauset al.,
“Phase aspects of (broadband) stimulated Raman scattering,”
Rev. Anal. Chem., 31
(1), 1
–6
(2012). http://dx.doi.org/10.1515/revac.2011.122 RACYAX 0048-752X Google Scholar
Y. Silberberg,
“Quantum coherent control for nonlinear spectroscopy and microscopy,”
Annu. Rev. Phys. Chem., 60 277
–292
(2009). http://dx.doi.org/10.1146/annurev.physchem.040808.090427 ARPLAP 0066-426X Google Scholar
V. Tuchin, Tissue Optics, SPIE Press, Bellingham, WA
(2007). Google Scholar
E. O. Potma,
“Tissue imaging with coherent anti-Stokes Raman scattering microscopy,”
Vibrational Spectroscopic Imaging for Biomedical Applications, McGraw Hill, New York
(2010). Google Scholar
A. J. Wrightet al.,
“Adaptive optics for enhanced signal in CARS microscopy,”
Opt. Express, 15
(26), 18209
–18219
(2007). http://dx.doi.org/10.1364/OE.15.018209 OPEXFF 1094-4087 Google Scholar
K. Isobeet al.,
“Background-free deep imaging by spatial overlap modulation nonlinear optical microscopy,”
Biomed. Opt. Express, 3
(7), 1594
–1608
(2012). http://dx.doi.org/10.1364/BOE.3.001594 BOEICL 2156-7085 Google Scholar
D. Kobatet al.,
“Deep tissue multiphoton microscopy using longer wavelength excitation,”
Opt. Express, 17
(16), 13354
–13364
(2009). http://dx.doi.org/10.1364/OE.17.013354 OPEXFF 1094-4087 Google Scholar
N. G. Hortonet al.,
“In vivo three-photon microscopy of subcortical structures within an intact mouse brain,”
Nat. Photonics, 7 205
–209
(2013). http://dx.doi.org/10.1038/nphoton.2012.336 1749-4885 Google Scholar
P. Wanget al.,
“Mechanisms of epi-detected stimulated Raman scattering microscopy,”
IEEE J. Sel. Topics Quantum Electron., 18
(1), 384
–388
(2012). http://dx.doi.org/10.1109/JSTQE.2011.2157463 IJSQEN 1077-260X Google Scholar
A. SchönleS. W. Hell,
“Heating by absorption in the focus of an objective lens,”
Opt. Lett., 23
(5), 325
–327
(1998). http://dx.doi.org/10.1364/OL.23.000325 OPLEDP 0146-9592 Google Scholar
A. HoptE. Neher,
“Highly nonlinear photodamage in two-photon fluorescence microscopy,”
Biophys. J., 80
(4), 2029
–2036
(2001). http://dx.doi.org/10.1016/S0006-3495(01)76173-5 BIOJAU 0006-3495 Google Scholar
K. Koniget al.,
“Cellular response to near-infrared femtosecond laser pulses in two-photon fluorescence microscopy,”
Opt. Lett., 22
(2), 135
–136
(1997). http://dx.doi.org/10.1364/OL.22.000135 OPLEDP 0146-9592 Google Scholar
A. VogelV. Venugopalan,
“Mechanisms of pulsed laser ablation of biological tissues,”
Chem. Rev., 103
(2), 577
–644
(2003). http://dx.doi.org/10.1021/cr010379n CHREAY 0009-2665 Google Scholar
Y. Fuet al.,
“Characterization of photodamage in coherent anti-Stokes Raman scattering microscopy,”
Opt. Express, 14
(9), 3942
–3951
(2006). http://dx.doi.org/10.1364/OE.14.003942 OPEXFF 1094-4087 Google Scholar
K. Yenet al.,
“A comparative study of the fat storage quantitation in nematode Caenorhabditis elegans using label and label-free methods,”
PLoS One, 5 e12810
(2010). http://dx.doi.org/10.1371/journal.pone.0012810 1932-6203 Google Scholar
S. FukumotoT. Fujimoto,
“Deformation of lipid droplets in fixed samples,”
Histochem. Cell. Biol., 118
(5), 423
–428
(2002). http://dx.doi.org/10.1007/s00418-002-0462-7 HCBIFP 0948-6143 Google Scholar
C. W. Freudigeret al.,
“Multicolored stain-free histopathology with coherent Raman imaging,”
Lab Invest., 92 1492
–1502
(2012). http://dx.doi.org/10.1038/labinvest.2012.109 LAINAW 0023-6837 Google Scholar
M. Jiet al.,
“Rapid, label-free detection of brain tumors with stimulated Raman scattering microscopy,”
Sci. Transl. Med., 5
(201), 201ra119
(2013). http://dx.doi.org/10.1126/scitranslmed.3005954 STMCBQ 1946-6242 Google Scholar
B. G. Saaret al.,
“Label-free, real-time monitoring of biomass processing with stimulated Raman scattering microscopy,”
Angew. Chem. Int. Ed., 49
(32), 5476
–5479
(2010). http://dx.doi.org/10.1002/anie.201000900 ACIEAY 0570-0833 Google Scholar
B. G. Saaret al.,
“Imaging drug delivery to skin with stimulated Raman scattering microscopy,”
Mol. Pharm., 8
(3), 969
–975
(2011). http://dx.doi.org/10.1021/mp200122w MOPMA3 0026-895X Google Scholar
E. O. PotmaX. S. Xie,
“Direct visualization of lipid phase segregation in single lipid bilayers with coherent anti-Stokes Raman scattering (CARS) microscopy,”
ChemPhysChem, 6
(1), 77
–79
(2005). http://dx.doi.org/10.1002/(ISSN)1439-7641 CPCHFT 1439-4235 Google Scholar
L. LiH. WangJ. X. Cheng,
“Quantitative coherent anti-Stokes Raman scattering imaging of lipid distribution in coexisting domains,”
Biophys. J., 89
(5), 3480
–3490
(2005). http://dx.doi.org/10.1529/biophysj.105.065607 BIOJAU 0006-3495 Google Scholar
O. Burkackyet al.,
“Dual-pump coherent anti-Stokes-Raman scattering microscopy,”
Opt. Lett., 31
(24), 3656
–3658
(2006). http://dx.doi.org/10.1364/OL.31.003656 OPLEDP 0146-9592 Google Scholar
G. Bergneret al.,
“Quantitative detection of C-deuterated drugs by CARS microscopy and Raman microspectroscopy,”
Analyst, 136
(18), 3686
–3693
(2011). http://dx.doi.org/10.1039/c0an00956c ANLYAG 0365-4885 Google Scholar
L. Weiet al.,
“Vibrational imaging of newly synthesized proteins in live cells by stimulated Raman scattering microscopy,”
Proc. Natl. Acad. Sci., 110
(28), 11226
–11231
(2013). http://dx.doi.org/10.1073/pnas.1303768110 PMASAX 0096-9206 Google Scholar
N. M. Sijtsemaet al.,
“Imaging with extrinsic Raman labels,”
Appl. Spectrosc., 50
(5), 545
–551
(1996). http://dx.doi.org/10.1366/0003702963905989 APSPA4 0003-7028 Google Scholar
H. Chenet al.,
“A multimodal platform for nonlinear optical microscopy and microspectroscopy,”
Opt. Express, 17
(3), 1282
–1290
(2009). http://dx.doi.org/10.1364/OE.17.001282 OPEXFF 1094-4087 Google Scholar
W.-W. Chenet al.,
“Automated quantitative analysis of lipid accumulation and hydrolysis in living macrophages with label-free imaging,”
Anal. Bioanal. Chem., 405
(26), 8549
–8559
(2013). http://dx.doi.org/10.1007/s00216-013-7251-0 ABCNBP 1618-2642 Google Scholar
D. Fuet al.,
“Quantitative chemical imaging with multiplex stimulated Raman scattering microscopy,”
J. Am. Chem. Soc., 134
(8), 3623
–3626
(2012). http://dx.doi.org/10.1021/ja210081h JACSAT 0002-7863 Google Scholar
N. Billeckeet al.,
“Chemical imaging of lipid droplets in muscle tissues using hyperspectral coherent Raman microscopy,”
Histochem. Cell Biol., 1
–11
(2013). http://dx.doi.org/10.1007/s00418-013-1161-2 HCBIFP 0948-6143 Google Scholar
BiographyAlba Alfonso-García obtained a BS in physics from University of Barcelona, Spain, and a MSc in optics and photonics from the Karlsruhe Institute of Technology, Germany. She is currently a PhD student in the biomedical engineering program at the University of California, Irvine. She is interested in applying nonlinear optical techniques to image biological processes, with a particular focus on cholesterol metabolism. Richa Mittal is a PhD graduate student in the Chemical Engineering and Material Science Department at University of California-Irvine. She works at Beckman Laser Institute at UCI on miniaturizing nonlinear optical microscopy techniques for in vivo skin imaging. Eun Seong Lee is a principal research scientist in Korea Research Institute of Standards and Science in South Korea. His research interests include nonlinear optical imaging of biological samples and developing spectrometers for material study. Eric O. Potma is an associate professor in the Department of Chemistry at the University of California, Irvine (UCI). He holds an adjunct position in the Beckman Laser Institute and Medical Clinic at UCI. His research group is active in developing nonlinear optical imaging techniques for the purpose of interrogating biological tissues and nanostructured materials. |