|
|
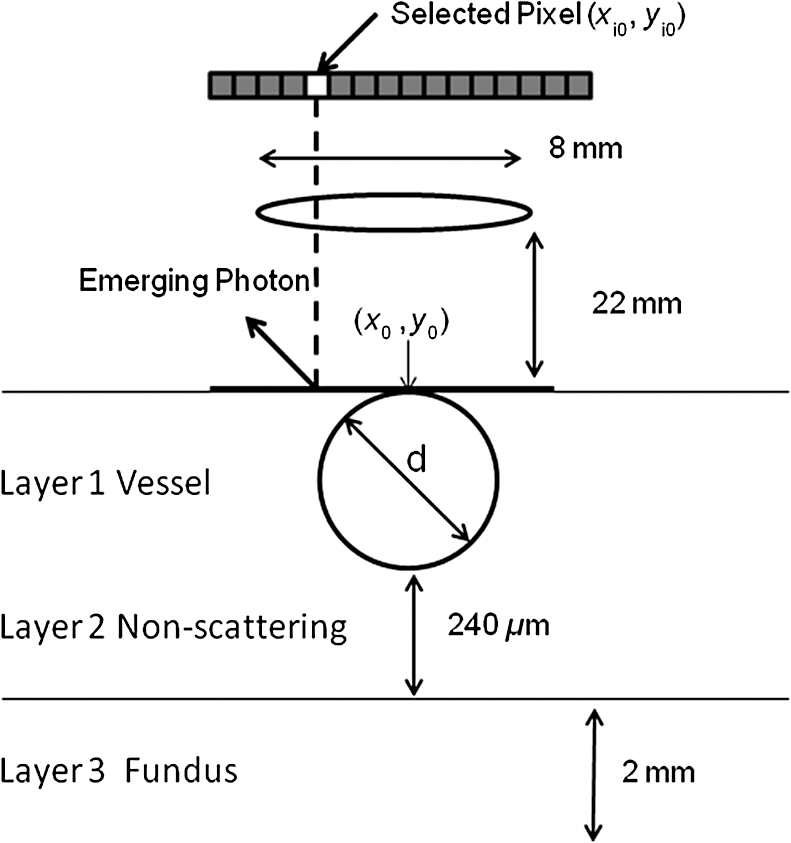
1.IntroductionThe measurement of oxygen saturation in retinal vessels is useful as a diagnostic aid in a number of ocular vascular disorders such as glaucoma,1 diabetic retinopathy,2 and central retinal vein occlusion,3 where hypoxia of the retina and optic-nerve head4–6 are believed to contribute. Spectral imaging is also potentially a useful tool for making reliable measurements of oxygen saturation in the human ocular fundus; however, a deeper understanding of light propagation from the illumination source through the various layers of the retina and to the detector is needed to enable these measurements to be made accurately.7 Measured retinal-vessel oxygenation is affected by various parameters that are in general not accurately known such as hematocrit, retinal vessel profile and dimension (since the optical magnification is not well known), and the concentration and location of a range of retinal chromophores, in particular macular pigment and melanin. The recording of spectral retinal images at multiple wavelengths offers enhanced prospects for accurate oximetry in this relatively poorly characterized environment. An important aspect of making accurate oxygen saturation measurements is an understanding of light paths within the retina. Due to the high levels of scattering within the retina, the path-lengths of light that has propagated through blood vessels are diverse with photons generally passing through various tissues and structures with different flight times through each. Assumptions about the path-lengths taken by the light, therefore, must always be made to quantify the oxygen saturation unless the actual photons’ flight times are recorded, which is not the case for continuous-wave measurements. In the absence of scattering, the Lambert–Beer law yields a linear relationship between absorption and measured attenuations, making the measurement of total absorption and hence the ratio of oxy- to deoxy-hemoglobin (oxygen saturation) straightforward8 as long as the incident and remitted light levels are known. In scattering media, some reduction in detected light occurs due to scattering alone even in the absence of absorption, an effect that is commonly included in the “modified” Lambert–Beer law as an offset.9 However, this is not the only effect of scattering and in reality, the range of path-lengths introduced results in the relationship between attenuation and absorption becoming nonlinear.10,11 In retinal imaging, it is often assumed that images obtained in reflection geometry can be used to estimate transmission measurements through a blood vessel.6 A proportion of the illuminating light is scattered by tissues underneath the vessel and then illuminates the vessel from the underside. This effectively results in a transmission geometry between the “back-illuminating” light and the imaging camera. However, as the amount of back-illuminating light is unknown, an assumption is made that this can be approximated by the light imaged close to the edge of a blood vessel (but not the vessel itself). Oxygen saturation algorithms, such as the modified Lambert–Beer law, can then be applied as if in a transmission geometry. A model of light scattering and the light path-lengths in the different regions of the retina is therefore an important step in investigating the validity of the assumptions made when estimating oxygen saturation from spectral measurements. In this article, we describe a Monte Carlo simulation of light propagation through a retinal vessel located above a homogeneous fundus. Although using a relatively simple geometry, the model enables the light paths within the fundus and vessel to be recorded as the illumination and imaging geometry are varied, for example, the point of illumination and the imaged area. Monte Carlo modeling of light propagation in the retina has been published previously;12–16 however, those simulations only use full-field illumination and provide the attenuation profiles, mean path-length, or information about the number of times a photon passes through a vessel rather than the distribution of path-lengths in each layer. As details of the path-length must either be measured or assumed in determining the oxygen saturation, it is informative to investigate the distribution of path-lengths within the vessel and for different imaging configurations. This is the subject of this article. In Sec. 2, we describe the Monte Carlo simulation and the method of forming an image using Monte Carlo data. Typical simulated imaging results are presented in Sec. 3 and compared with measurements recorded of an eye phantom to demonstrate the validity of the technique. Further results show the light path-lengths within the different layers for different imaging configurations including the effect of different vessel diameters. Based on these results, a structured-illumination approach to restrict the photon path-length within the retinal vessel to aid accurate oximetry is proposed. 2.Simulation of the Imaging System and Light Paths in the RetinaThe Monte Carlo model simulates the path of one photon packet at a time through the sample with the geometry shown in Fig. 1 (not to scale). A relatively simple geometry is demonstrated but this is useful for investigating the effect of imaging configuration and vessel diameter on photon path-length and closely resembles the tissue phantom used for comparison. A full description of the structure and function of the eye can be found in a variety of sources (e.g., Ref. 17). A light-scattering and -absorbing, infinitely long cylindrical vessel of diameter (layer 1) sits within a nonscattering layer (layer 2), 240 μm above the surface of the fundus. The fundus (layer 3) is a light-scattering and -absorbing layer, which is 2 mm thick. Light is collected by an 8-mm-diameter lens, which images the surface of the sample onto the detector plane. Usually 1,000,000 photon packets are injected perpendicularly into the sample from the top surface at each of a range of spatial positions (400 positions at 4-μm intervals) along a line across the eye fundus. The 400 datasets calculated from the simulation (one for each illumination position) contain the total distance traveled in each layer and the exit position and angle of each photon. The illumination is assumed to be uniform across the field of view of the sample, which should be achievable in practice through appropriate design of the illumination optics.18 An additional geometry with single-point illumination and single-point detection is described in Sec. 3.3, for which 100 million photon packets are simulated to ensure that sufficient photons are detected. Emergent photons are spatially and angularly filtered to ensure that only those that propagate through the imaging lens are used to calculate the recorded image. For these photons, a one-to-one mapping of spatial position on a nominal surface of the sample to the image plane is assumed. The contribution at the image plane of the detected photons from 400 different illumination positions can be combined to form an image due to line illumination. As the simulation does not vary in the direction, a two-dimensional (2-D) image due to full-field illumination (i.e., illumination over the full image area) can be formed by repeating a shift and sum process for the line over the image. Attenuation is added postsimulation by applying the Lambert–Beer law, which takes into the account the absorption coefficients and total path-length traveled in the vessel and fundus. The advantage of applying the attenuation due to absorption at this stage, rather than during the propagation of each photon packet, is that the same Monte Carlo data can be used with a range of absorption values for each layer. As scattering varies with wavelength,19,20 separate simulations are performed for 25 equally spaced wavelengths from 580 to 630 nm. In the simulations, the scattering coefficients and values (i.e., the mean cosine of the scattering angle) are taken from published data.19,20 For purposes of validation, it was necessary to place a phantom blood vessel above a scattering medium to simulate the scattering from the anterior fundus tissues.5 In the experiments, Spectralon® (Labsphere, New Hampshire) (Ref. 21) played the role of the scattering medium. At a wavelength of , the optical parameters for blood are: scattering and . For Spectralon, and at . The result of the simulation is a set of 2-D images of the vessel over the Spectralon at 25 separate wavelengths and a range of absorption coefficients. The path-length distribution in each layer (vessel and Spectralon) is recorded for each case. 3.ResultsThree salient sets of results are provided. In Sec. 3.1, we report the simulated images of the vessels which are compared with results from an eye phantom.5 Section 3.2 shows the distributions of photon-packet path-lengths in the retinal layers for the case of the full-field illumination. In Sec. 3.3, we consider illumination from a single point and describe how the light path-length distributions shown in Sec. 3.2 can be decomposed. 3.1.Comparison of Simulated Images with Eye Phantom ImagesTo assess the validity of the Monte Carlo simulation developed, the results were compared with images of an eye phantom obtained from a hyperspectral fundus camera. The camera and eye phantom have been described in more detail elsewhere,5,6 but briefly, the camera is a modified standard fundus camera that incorporates a liquid-crystal tunable filter which allows random-access scanning of the illumination wavelength. The eye phantom employs phantom blood vessels consisting of a narrow capillary tube (diameter of either 50, 100, or 150 μm) manufactured from a fluoropolymer blend (THV2030G) that has a refractive index , similar to that of water () or the vitreous humor (). To provide light scattering from beneath the vessel, the capillary lies above a compound slab consisting of Spectralon with nominal reflectivities of 20%, 60%, and 99%. Blood samples from healthy volunteers are flowed through the capillary and are compared with measurements from a blood gas analyzer. Figure 2 demonstrates that the trends of the simulation follow those of the eye phantom. The oxygen saturation for the model given by blood-gas analysis was 98%. To estimate the absorption coefficient in the simulation, we use the extinction coefficients of oxy- and deoxy-hemoglobin at different wavelengths and follow the equation provided by Prahl,22 where is the overall extinction coefficient of the blood which depends on the oxygen saturation. The equation assumes an average concentration of hemoglobin in blood of and 64,500 as the gram molecular weight of hemoglobin.Fig. 2Comparison of simulated normalized intensity images of 150-μm-diameter vessel with an eye phantom: (a) Simulation, , (b) eye phantom, , (c) simulation, , (d) eye phantom, , (e) simulation, , and (f) eye phantom, . 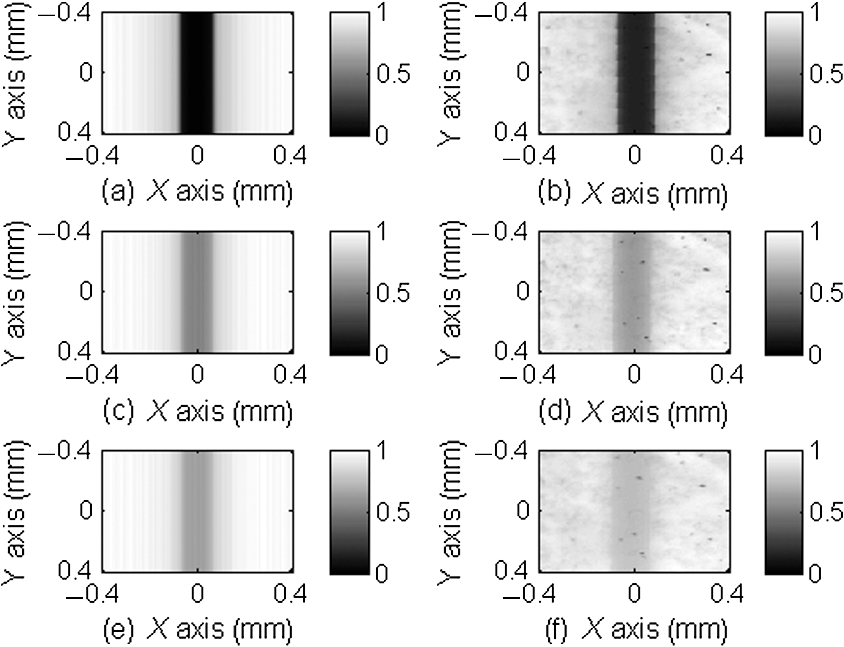 The camera images have a different aspect ratio to the simulation and so have been resized in the horizontal direction for ease of comparison. As anticipated, the absorption is higher at , and so the contrast of the image is also higher. The contrast gradually reduces with increase in wavelength beyond about 580 nm due to the reducing extinction coefficient of hemoglobin. Figure 3 shows selected line-scans at wavelengths of 580, 590, 600, and 620 nm. Qualitatively, the profiles compare well between the model eye and the simulated data; however, the contrast in the images recorded with the model eye is consistently lower than the simulations. Possible explanations for discrepancies between the Monte Carlo simulations and experimental data include inaccuracies in the absorption and scattering parameters for the blood and for the Spectralon and also the effect of over-simplifications in the Monte Carlo model. This latter category includes the absence from the Monte Carlo model of the capillary wall and also the effect of the modulation transfer function of the image-formation system. This latter effect can be quite substantial and has three main components: at the low spatial frequencies pertinent to imaging the blood vessel, the modulation transfer for practical imaging systems is significantly reduced, and furthermore optical scattering from all optical surfaces and within the eye can significantly reduce contrast. Recent measurements on a range of fundus cameras, to be reported at a later date, suggest that the typical contrast reduction is comparable with the contrast reductions presented in Fig. 3. In conclusion, the Monte Carlo simulations are comparable with recorded data to a sufficient level of accuracy to enable reliable conclusions about path-length distributions to be drawn as described below. Fig. 3Profiles averaged across the rows of the images shown in Fig. 2. (a) Simulated and (b) model eye. 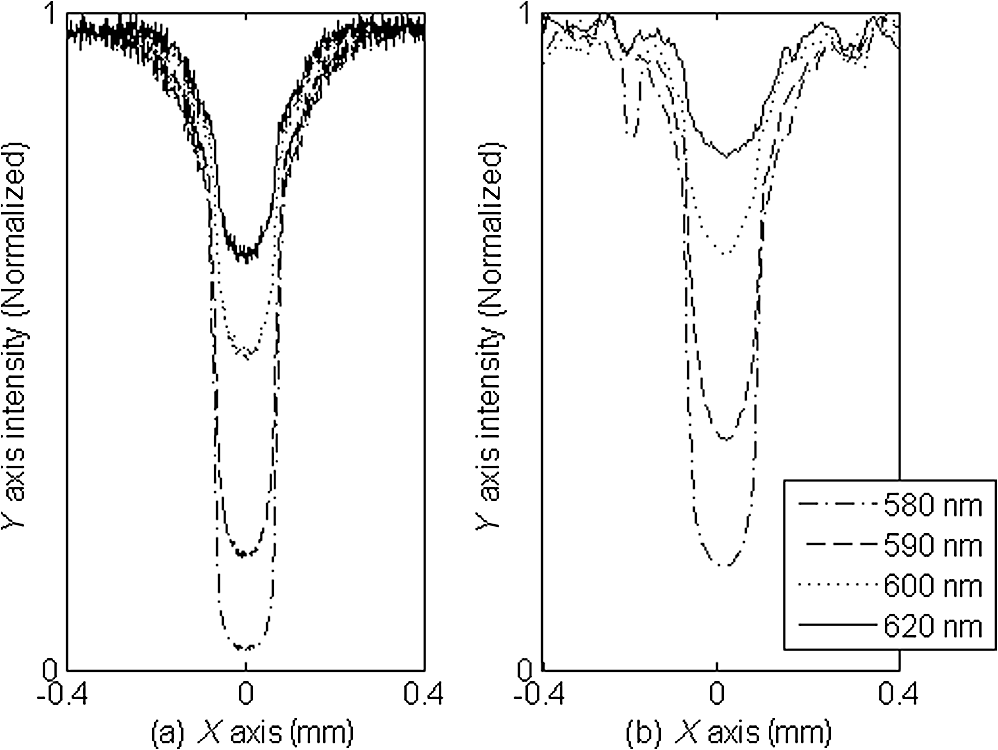 3.2.Path-Length Distributions Obtained by Full-Field IlluminationA conventional imaging system18 illuminates an area of the retina uniformly (full-field illumination) and forms an image onto an array of detectors (e.g., a CCD camera). As both the retinal vessel and fundus scatter light, the light that reaches the detector has traveled through many different regions of the tissue over many different path-lengths. Figure 4(a) shows the path-lengths obtained using simulations within a vessel of for a detector placed at the edge of the vessel with full-field illumination. Two main peaks can be observed. The shorter path-length distribution centered on 50 μm is due to the light that emerges from the fundus on the same side as the detector and then propagates to the detector by grazing the side of the vessel. The longer path-length peak (150 μm) corresponds to the vessel diameter and comprises photons that have propagated through the vessel to the fundus and then directly to the detector. Figure 4(b) shows the path-lengths only within the vessel for a detector placed directly above the vessel. As the detector is directly above the vessel, it receives light directly backscattered by the vessel which corresponds to the shortest path-lengths (). The central peak (150 μm) corresponds to illuminating light backscattered by the fundus before propagating through the vessel for the first time. The peak path-length therefore occurs at the diameter of the vessel. The longest path-length peak (300 μm) corresponds to light that has taken a double pass through the vessel, first before the light reaches the fundus and then after the light has been scattered by the fundus. The amount of double-pass light () of the total is in agreement with that observed in previous work.14 Figures 4(c) and 4(d) show the light path-length distributions in the fundus when the detector is placed at the edge and directly above the vessel, respectively. The path-lengths are very similar to those observed from a homogeneous scattering medium. The number of photons reaching the detector in Fig. 4(d) is slightly smaller than that in Fig. 4(c) due to the presence of the vessel. Fig. 4Path-lengths for full-field illumination, , , and 98% oxygen saturation of blood in the vessel. (a) Detector at edge of vessel, path-length in the vessel, (b) detector directly above vessel, path-length in vessel, (c) detector at edge of vessel, path-length in fundus, and (d) detector directly above vessel, path-length in fundus.  Figures 5(a) and 5(b) shows the path-length distribution within the vessel for a high-absorption case () for detectors placed at the edge and center of the vessel, respectively. This demonstrates that the longer path-length distributions are reduced, since absorption is an exponential function of distance traveled. 3.3.Path-Length Distributions Obtained by Single-Point IlluminationIn order to understand the range of path-lengths that occurs within the vessel due to full-field illumination, it is informative to consider the path-lengths that occur using single-point illumination. Figures 6(a) and 6(b) show the path-length distributions at the detector directly above the vessel due to illumination at the edge and center of the vessel. The distributions observed in full-field illumination [Fig. 4(b)] can now be separated into these components. Illumination at the edge means that light that is directly backscattered by the vessel and light that passes through the vessel cannot be present and so the path-length distribution is limited to those photons that have been backscattered by the fundus and then reach the detector by propagating through the vessel. The path-length distribution is tightly distributed around the diameter of the vessel. When both illumination and detection are directly above the vessel [Fig. 6(b)], there is a significant component directly backscattered from the vessel and a small component has undergone a double-pass through the vessel (at 300 μm). It should be noted that the relative heights of the peaks in Figs. 6(a) and 6(b) are different from those in Fig. 4(b), because there are more illumination points at the edge of the vessel than directly above the vessel in the full-field case. Fig. 6Path-lengths in the vessel for single-point illumination, , , and 98% oxygen saturation. (a) Center detector, edge illumination, (b) center detector, center illumination, (c) edge detector, center illumination, and (d) edge detector, edge illumination. Note the difference in scale on the -axes.  Separation of the light path-length distributions can also be observed when the detector is placed at the edge of the vessel [compare Figs. 6(c) and 6(d) with Fig. 4(a)]. When illumination is directly above the vessel and the detector is situated at the edge [Fig. 6(c)], light reaches the detector by directly passing through the vessel, reaching the fundus, and then propagating to the detector. This corresponds to the path-length peak around 150 μm in Fig. 4(a). Figure 6(d) shows the edge detection and edge illumination on the same side of the vessel, where the light propagates to the fundus and is then backscattered, grazing the edge of the vessel before reaching the detector. This corresponds to the short path-length broader peak in Fig. 4(a). 3.4.Effect of Vessel Diameter on Light Path-LengthsThe diameter of the vessel also has an effect on the relative heights of the peaks with the light path-length distributions. As an example, we consider the path-length distributions of light within the vessel for a detector positioned directly above the vessel using full-field illumination. Figures 7(a) and 7(b) show the path-length distribution for vessels of diameters 100 and 50 μm. In this case, and there is 98% oxygen saturation which allows these results to be compared with the case shown in Fig. 4(b). Care must be taken when making a direct comparison of photon numbers, because the illumination conditions remain constant across the image for the three vessel sizes, i.e., 4-μm spacing, 400 sources. Therefore, different size vessels will experience different numbers of illuminating photons (, 38 million photons; , 25 million photons; and , 12 million photons). Fig. 7Full-field illumination, path-lengths in vessels of different diameters, 98% oxygen saturation in the vessel, and detector at center of vessel. (a) , and (b) vessel.  As might be expected, with decreasing vessel diameter, the proportion of directly backscattered to single-pass photons decreases as there are fewer scattering events within the vessel to enable the photons to return to the detector. The second peak is due to light that propagates directly to the fundus and then returns to the detector via the vessel. Due to the reduction in scattering within the vessel, there is an increase in the overall size of the peak with decreasing vessel diameter. For double-pass photons, the relative proportion of double-pass to single-pass photons decreases with increasing vessel size. Figure 8 shows that the vessel diameter has a relatively minor effect on the path-length distribution within the fundus. There are always fewer photons that contribute to the detected signal when the detector is placed at the center of the vessel compared with that when the detector is located at the edge of the vessel. The difference between the distributions slightly decreases as the vessel diameter decreases. 4.DiscussionAn important aspect of making oxygen saturation measurements is that assumptions about the path-lengths of the light usually need to be made. The simulations shown in the previous section aid understanding of spectral imaging of the retina as photon path-length is recorded in the simulated retinal vessel and fundus. Although the simulation is relatively simple, the images qualitatively match those obtained using an eye phantom. When using conventional full-field illumination, there is a range of path-lengths within the vessel that is detected originating from light directly backscattered from the vessel and light that has made either a single or double pass through the vessel. Although the dominant path-length distribution is usually due to photons that have taken a single pass, there are significant observable distributions from directly backscattered and double-pass light. The relative contribution of these components changes with vessel diameter, with more directly backscattered light observed from larger vessels. The origins of the path-length distributions within the vessel can be better understood by considering single-point illumination and single-point distribution over different combinations of edge and center illumination and detection. Different light path-length distribution components can be extracted using different imaging geometries; for example, illumination directly above the vessel and detection above the vessel allows directly backscattered and double-pass light to be separated from that which has taken a single pass through the vessel. Potentially of most significance is the case when illumination is at the edge of vessel and detection is directly above the vessel. In this case, single-pass photons can be isolated from directly backscattered and double-pass photons. As shown in Fig. 6(a), the path-length of these photons is tightly constrained around the path-length of the vessel. Most oximeters assume a modified Lambert–Beer law model with an attenuation offset due to incident photons being “lost” due to scattering away from the detector and a linear dependence of attenuation with absorption coefficient with the path-length as the constant of proportionality. Many oximeters (e.g., pulse oximeters) use a differential measure of attenuation to overcome the offset, while others employ an additional wavelength (over the theoretical minimum) to measure the scattering offset.9 This still assumes a linear dependence of attenuation against absorption that is only true if all photons have the same path-length. Therefore, methods that constrain photon path-lengths help to achieve this linear dependence. In retinal imaging, this can be achieved by illumination at the edge of the vessel and detection directly above the vessel. In practice, this could be implemented within a confocal imaging system using an offset pinhole. Alternatively, the illumination could be controlled using a fixed mask or dynamically using a spatial light modulator such as a liquid crystal display or digital micromirror device. A similar approach known as side-stream dark field illumination has previously been applied in video capillaroscopy23 but this has been employed to overcome surface reflections and to improve the image quality rather than to perform quantitative spectroscopy. If illumination is carried out from a strip of light at either side of the vessel, then the path-length distribution becomes smoother as more photons can probe the volume and reach the detector. An example showing the path-length distribution in the vessel for illumination from all points except those above the vessel is shown in Fig. 9, demonstrating a smoother, but similarly constrained path-length distribution around the diameter of the vessel. We aim to quantify the accuracy of this approach in future work through application of oxygen saturation algorithms and retinal phantom imaging.5,6 Fig. 9Path-length distribution within the vessel for a detector situated directly above the vessel and illumination at all positions except above the detector (, , and 98% oxygen saturation). A smooth distribution constrained around the vessel diameter can be observed. 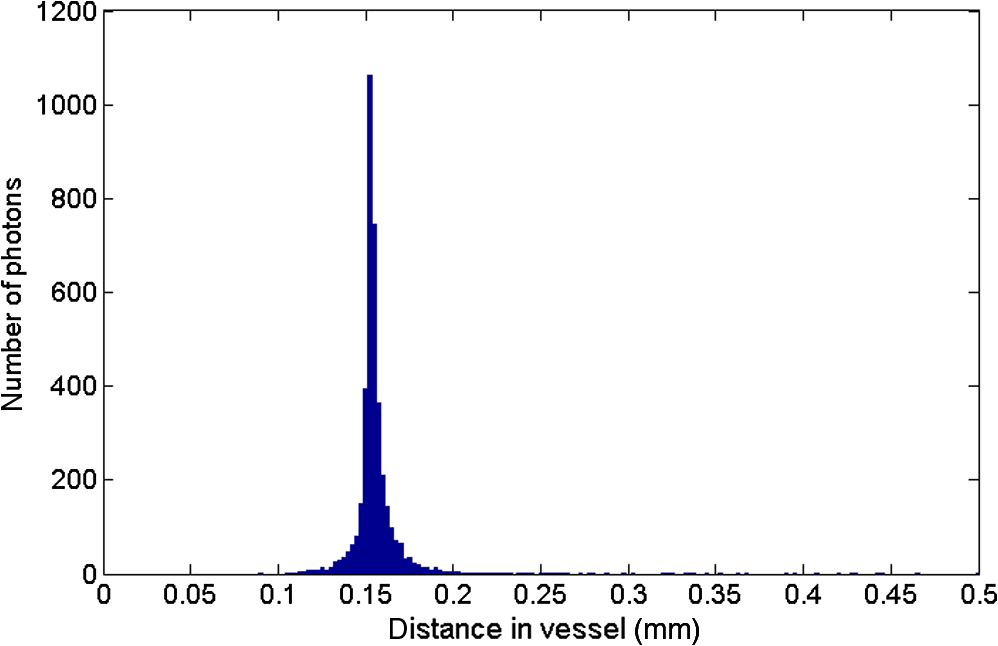 A relatively simple geometry of the eye has been employed to allow the simulation of a tissue phantom developed previously.5 The simulation could be refined by taking into account the scattering and absorption of the retinal epithelial pigment layer.15 In addition, the effects of the capillary wall and the modulation transfer function of the image-formation system could be introduced. These are likely to produce quantitatively more accurate results but are unlikely to affect the overall conclusions of the work. The Monte Carlo simulations are compatible with recorded data to a sufficient level of accuracy to enable reliable conclusions about path-length distributions to be drawn. 5.ConclusionA simple Monte Carlo simulation of light propagation through the retina has been developed to understand the path-length distributions within the retinal vessel and fundus. For full-field illumination, the path-length distribution within the vessel comprises directly backscattered, single-, and double-pass photons. The origins of these distributions have been better understood by investigating the path-length distributions due to different combinations of illumination and detection positions. The most significant observation is that illumination from the edge and detection directly above the vessel isolates light that has taken a single pass through the vessel from directly backscattered and double-pass light. This distribution is tightly constrained around the diameter of the vessel and can potentially be a useful approach for oxygen saturation imaging. The method could be practically implemented using an offset pinhole confocal imaging system or using structured light illumination. AcknowledgmentsThis work was funded by the UK Department of Health’s New and Emerging Applications of Technology (NEAT) programme. ReferencesA. Harriset al.,
“Simultaneous management of blood flow and IOP in glaucoma,”
Acta Ophthalmol. Scand., 79
(4), 336
–341
(2001). http://dx.doi.org/10.1034/j.1600-0420.2001.079004336.x AOSCFV 1395-3907 Google Scholar
E. StefanssonM. B. Landers IIIM. L. Wolbarsht,
“Oxygenation and vasodilation in relation to diabetic and other proliferative retinopathies,”
Ophthal. Surg., 14
(3), 209
–226
(1983). OPSGAT 0022-023X Google Scholar
S. Yoneyaet al.,
“Retinal oxygen saturation levels in patients with central vein occlusion levels in patients with central retinal vein occlusion,”
Ophthalmology, 109
(8), 1521
–1526
(2002). http://dx.doi.org/10.1016/S0161-6420(02)01109-0 OPANEW 0743-751X Google Scholar
S. S. Hayreh,
“Factors influencing blood flow in the optic nerve head,”
J. Glaucoma, 6
(6), 412
–425
(1997). JOGLES Google Scholar
D. J. Mordantet al.,
“Validation of human whole blood oximetry using a hyperspectral camera with a model eye,”
Invest. Ophthalmol. Vis. Sci., 52
(5), 2851
–2859
(2011). http://dx.doi.org/10.1167/iovs.10-6217 IOVSDA 0146-0404 Google Scholar
D. J. Mordantet al.,
“Spectral imaging of the retina,”
Eye, 25
(3), 309
–320
(2011). http://dx.doi.org/10.1038/eye.2010.222 12ZYAS 0950-222X Google Scholar
Y. Hiroharaet al.,
“Validity of retinal oxygen saturation analysis: hyperspectral imaging in visible wavelength with fundus camera and liquid crystal wavelength tunable filter,”
Opt. Rev., 14
(3), 151
–158
(2007). http://dx.doi.org/10.1007/BF02919416 1340-6000 Google Scholar
J. M. Beachet al.,
“Oximetry of retinal vessels by dual-wavelength imaging: calibration and influence of pigmentation,”
J. Appl. Physiol., 86
(2), 748
–758
(1999). JAPYAA 0021-8987 Google Scholar
R. N. PittmanB. R. Duling,
“Measurement of percent oxyhemoglobin in the microvasculature,”
J. Appl. Physiol., 38
(2), 321
–327
(1975). JAPYAA 0021-8987 Google Scholar
D. T. DelpyM. Cope,
“Quantification in tissue near-infrared spectroscopy,”
Philos. Trans. R. Soc. B, 352
(1354), 649
–659
(1997). http://dx.doi.org/10.1098/rstb.1997.0046 PTRBAE 0962-8436 Google Scholar
J. A. Croweet al.,
“Quantitative spectrophotometry of scattering media via frequency-domain and constant-intensity measurements,”
J. Opt. Soc. Am. A, 24
(7), 1969
–1974
(2007). http://dx.doi.org/10.1364/JOSAA.24.001969 JOAOD6 0740-3232 Google Scholar
K. R. DenninghoffM. H. Smith,
“Optical models of the blood in large retinal vessels,”
J. Biomed. Opt., 5
(4), 371
–374
(2000). http://dx.doi.org/10.1117/1.1289144 JBOPFO 1083-3668 Google Scholar
M. H. Smithet al.,
“Effect of multiple light paths on retinal vessel oximetry,”
Appl. Opt., 39
(7), 1183
–1193
(2000). http://dx.doi.org/10.1364/AO.39.001183 APOPAI 0003-6935 Google Scholar
M. Hammeret al.,
“Light paths in retinal vessel oxymetry,”
IEEE Trans. Biomed. Eng., 48
(5), 592
–598
(2001). http://dx.doi.org/10.1109/10.918598 IEBEAX 0018-9294 Google Scholar
S. J. PreeceE. Claridge,
“Monte Carlo modelling of the spectral reflectance of the human eye,”
Phys. Med. Biol., 47
(16), 2863
–2877
(2002). http://dx.doi.org/10.1088/0031-9155/47/16/303 PHMBA7 0031-9155 Google Scholar
W. LiuS. JiaoH. F. Zhang,
“Accuracy of retinal oximetry, a Monte Carlo investigation,”
J. Biomed. Opt., 18
(6), 066003
(2013). http://dx.doi.org/10.1117/1.JBO.18.6.066003 JBOPFO 1083-3668 Google Scholar
A. K. Khurana, Comprehensive Ophthalmology, New Age International, Delhi
(2007). Google Scholar
E. DeHoogJ. Schwiegerling,
“Optimal parameters for retinal illumination and imaging in fundus cameras,”
Appl. Opt., 47
(36), 6769
–6777
(2008). http://dx.doi.org/10.1364/AO.47.006769 APOPAI 0003-6935 Google Scholar
M. Friebelet al.,
“Influence of oxygen saturation on the optical scattering properties of human red blood cells in the spectral range 250 to 2000 nm,”
J. Biomed. Opt., 14
(3), 034001
(2009). http://dx.doi.org/10.1117/1.3127200 JBOPFO 1083-3668 Google Scholar
M Meinkeet al.,
“Empirical model functions to calculate hematocrit-dependent optical properties of human blood,”
Appl. Opt., 46
(10), 1742
–1753
(2007). http://dx.doi.org/10.1364/AO.46.001742 APOPAI 0003-6935 Google Scholar
G. B. Courreges-Lacosteet al.,
“Modeling of Spectralon diffusers for radiometric calibration in remote sensing,”
Opt. Eng., 42
(12), 3600
–3607
(2003). http://dx.doi.org/10.1117/1.1622961 OPEGAR 0091-3286 Google Scholar
S. A. Prahl,
“Optical Absorption of Hemoglobin,”
(2013) omlc.ogi.edu December ). 2013). Google Scholar
P. T. Goedhartet al.,
“Sidestream Dark Field (SDF) imaging: a novel stroboscopic LED ring-based imaging modality for clinical assessment of the microcirculation,”
Opt. Express, 15
(23), 15101
–151014
(2007). Google Scholar
|