|
|
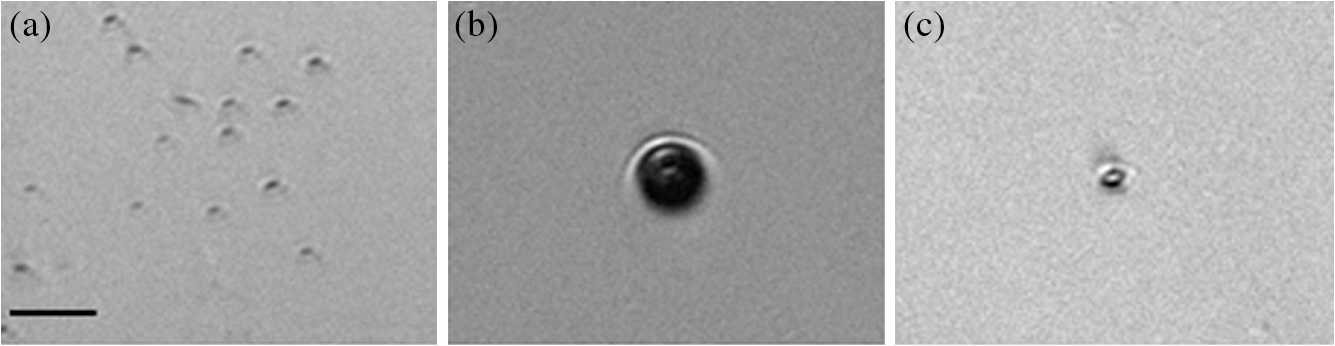
1.IntroductionAs a consequence of the widespread use and availability of lasers, laser eye safety has increasingly become a concern due to the possibility of accidental, high-intensity exposures to tissue in the eye. The American National Standards Institute (ANSI) accredits the Z136 committee to establish user standards for the safe use of lasers. In order for committees such as Z136 to monitor and make recommendations for safe exposure levels,1,2 retinal damage threshold studies must be conducted with varying laser radiation parameters to quantify the magnitude of these hazards.3 It is also imperative to understand the mechanisms of retinal damage, including melanosome microcavitation, as a function of wavelength, spot size, and exposure duration. Furthermore, the ANSI Z136.1 in the United States is currently under revision. The proposed revision to the near-infrared (NIR) safe exposure limits is supported by ocular damage threshold data from a number of studies.3,4 However, little data exist in the longer-wavelength NIR regime in the nanosecond time scale. An additional barrier to updating the laser safety standards is the lack of understanding of the fundamental damage mechanisms of melanosome microcavitation in the retinal pigment epithelium (RPE) in this time regime. Therefore, the objective of this study was to investigate the trends in single-melanosome microcavitation thresholds for nanosecond pulse exposures in the NIR wavelength regime. Average fluence thresholds for microcavitation of isolated bovine and porcine melanosomes were determined using nanosecond laser pulses with wavelengths ranging from 1000 to 1319 nm. A tunable laser source was used in order to probe NIR wavelengths of interest. Both heavy and light melanosome fractions for bovine and porcine were studied to determine if the threshold varied as a function of melanosome shape. An additional purpose of this study was to investigate whether or not melanosome microcavitation is maintained as the dominant damage mechanism with increasing wavelength throughout the retinal hazard regime, commonly identified as to 1400 nm. For nanosecond and picosecond pulse exposures, microcavitation about heated melanosomes, producing bubble formation and shock wave emission, is believed to be the dominant threshold-level retinal damage mechanism.5–10 This study focuses on the wavelength dependence of melanosome microcavitation damage thresholds over the 1000 to 1319 nm transition wavelength region. Results of this study were compared to the current ANSI Z136.1-2007 maximum permissible exposure (MPE) values, the proposed (201x) MPE values, as well as in vivo studies. These results will provide critical information supporting an update of laser safety standards, and provide evidence in support of a proposal to increase the exposure limits in the NIR wavelength region in the 1000 to 1319 nm range.4 2.Background2.1.Retinal Pigment Epithelium and MelanosomesThe retina is a visual organ of thickness located in the back of the eye.11 The RPE is a monolayer of cells located within the retina. Melanin-containing organelles known as melanosomes, found in RPE cells, readily absorb to 60% of the incident visible light as well as NIR radiation.5,11,12 For visible laser exposures, injury first occurs in the RPE because it contains the highest energy density of absorbed photons. As wavelength increases from the visible to the NIR, laser light is absorbed less in the retina and more in the cornea and anterior segments of the eye.3,13,14 In addition, as melanin absorption significantly decreases, water absorption increases with wavelength. The heat produced by the strongly absorbing melanosomes in the RPE exposed to visible and NIR nanosecond pulses allows for selective damage of RPE cells while preserving overlying photoreceptors.12,15 2.2.Mechanisms of Short-Pulsed Laser-Induced Retinal InjuryNumerous ocular bioeffect experiments have been performed using lasers in the wavelength region between 1000 and 1300 nm with many different pulse durations.3,4,16–18 Additional threshold measurements were made on an artificial retina for a variety of wavelengths, spot sizes, and pulse durations to reduce the complications of a biological system.19 However, except for Nd:YAG (1064 nm) bioeffect studies, little experimental data exist in this wavelength region using very short-pulse durations (order of nanoseconds). When laser pulses shorter than 20 μs impinge on the retina, heating is confined to the absorbing melanosome during the laser exposure (thermal confinement). The temperature rise and threshold for injury is dependent on the number density of absorbed photons.20 Birngruber et al.14 defined the relationship between the spatial temperature equilibration of melanin granules and the space between them, expressed as the thermal relaxation time () for a particle. where is the intergranule distance and κ is the thermal diffusivity. By using the thermal diffusivity of water (), and a distance of 1.2 μm, an upper limit for the thermal relaxation time of results from Eq. (1).14 The thermal relaxation time of melanosomes has also been expressed as where is the thermal diffusivity of melanosomes.6,21,22 Equation (2) results in a thermal relaxation time of , using a melanosome radius of 0.5 μm.6,7 Therefore, the range of thermal relaxation time of melanosomes is to 1 μs. If heat is generated within an absorbing target more rapidly than heat can diffuse away, high temperatures can be obtained, leading to vaporization of the surrounding fluid when exposures are above the microcavitation threshold.6 One can assume spatially homogeneous heat deposition occurs within the particle if the thermal relaxation time of the particle is much smaller than the laser pulse duration.This process results in the formation of small bubbles (microcavitation) around laser-heated melanosomes, which may cause damage to the surrounding tissue.23 When these microcavitation bubbles expand and collapse, they break the cell membrane and destroy the cell.8,24 However, melanosome microcavitations may not always lead to cell death. Gerstman et al. developed expressions for calculating the size of microcavitation bubbles as a function of laser fluence and melanosome properties, including radius and absorptivity.10 These authors showed that the maximum bubble radius can significantly change, and the treatment of bubble formation and growth may be used to analyze threshold damage leading to lesions and cell death. Therefore, the microcavitation events must be large enough to impact the cell membrane in order to cause cell death. It has been observed that the transition from thermal damage to bubble-induced damage from single pulses occurs at in duration.7,11,25 Studies have also shown that the microcavitation thresholds decrease with increasing number of pulses.26 The RPE is believed to be the site for threshold damage for all nanosecond and picosecond laser exposures in the visible and NIR. In the NIR wavelength region, the ocular media and anterior structures of the eye (cornea and lens) begin to strongly absorb, but still transmit adequate energy to pose a risk to the retina.3 At some wavelength, either bulk (water) heating around the melanosomes will take over as the threshold damage mechanism or the absorption in the anterior segment of the eye becomes dominant and the cornea or lens will be damaged.9 The viscoelastic properties of the medium in which a sample is prepared in have additional affects on bubble formation. Studies have shown that the observation and formation of cavitation bubbles can vary greatly depending on the surrounding medium.27,28 The surrounding media for the present study is water for all cases. 3.Experimental Detail and Procedures3.1.Melanosome PreparationThe preparation procedure of bovine and porcine pigment granules (melanosomes) followed the method of Dontsov et al.29 This method provided samples enriched in light and heavy fractions of melanosomes by density for both bovine and porcine samples. Light melanosomes are predominately spherical, while the heavy melanosomes are predominately elliptical in shape, resulting in slight size differences between the two fractions.26,29 However, no high-resolution imaging was used, and therefore, no precise knowledge of shape variance within each fraction was obtained. The melanosome fractions were separated in order to determine if differences in microcavitation threshold values occur. After the separation procedure, stock solutions of the melanosomes were stored at 4°C. Dilutions of samples were prepared in deionized water for each fraction prior to analysis. Plated aqueous melanosomes were prepared on glass microscope slides in order to observe cavitation events. A loosely sealed silicon washer and glass cover slip were used to enclose the melanosome sample to prevent evaporation of the aqueous suspension. By plating samples on a clear glass slide, observations of the microcavitation events were made possible using a camera positioned below the sample suspension and strobe back-illumination. 3.2.Laser and Optical SystemsIn order to observe the microcavitation events after exposure, a microscope containing two beam paths was used (see Fig. 1): (1) the irradiation beam and (2) the illumination beam. It was necessary to use two different laser systems for collection of microcavitation data in the wavelength region of 1000 to 1300 nm. First, the irradiation beam consisted of a Spectra Physics Pro 290, Nd:YAG with an output of 300 mJ at 355 nm, coupled with a nanosecond optical parametric oscillator (OPO) laser (Spectra Physics, Santa Clara, California, Premiscan), with a wavelength output range of 240 nm to 2.4 μm. This system was used for data collection in the 1000 to 1200 nm wavelength region and had a pulse duration of 10 ns. A half-wave-plate and polarizing cube controlled the pulse energy delivered to the sample. A Coherent-Molectron EMP2000 energy meter (Coherent, Inc., Santa Clara, California) collected energy measurements. A beam splitter (BS) directed 10% of the beam energy into a reference detector (P1), and the remaining energy passed through the splitter and was measured by a second energy detector (P2) at the sample site. The ratio between the two detectors was measured and recorded before every experimental run. After each shot, the pulse energy from P1 was multiplied by the P1/P2 ratio to determine the energy delivered to the sample. The P1/P2 ratio was monitored during data collection and was stable throughout each data series. Data collection occurred at 1000, 1100, and 1200 nm. Fig. 1Schematic of the laser and illumination setup for observing microcavitation bubble formation from irradiated melanosomes. BS, a beam splitter, directed 10% of the beam energy into P1, a reference energy meter. P2, a detector, measured the remaining energy that passed through the BS at the sample site.  In order to collect data at 1319 nm, a custom-built Q-switched Nd:YAG laser (Continuum Lasers, Santa Clara, California) was used to deliver 50-ns exposures to the melanosomes, instead of the OPO’s 10-ns exposures. This laser delivers high-power pulses at 1319 nm and provided enough energy for microcavitation. The maximum pulse energy of the laser was rated at 5 J; however, for this experiment, only one of the nine amplifier stages was used. A third source, a frequency-doubled 1064 nm Q-switched Nd:YAG laser (Spectra Physics, INDI-30) was used to collect microcavitation data at 532 nm. The pulse duration of this system was 10 ns. The illumination beam consisted of a Spectra Physics Model GCR-130 Nd:YAG and was frequency doubled for an output of 532 nm at 10 Hz. The GCR-130 output was directed through a dye cell containing Rhodamine 640 Perchlorate dissolved in methanol. The dye absorbed the 532-nm energy and emitted at . The fluorescence of the dye cell was collected at 90 deg to the GCR-130 and directed to the sample. The illumination beam was directed to the sample through the back of an IR mirror that turned the irradiation beam to the sample. A delay generator allowed time-resolved imagery by controlling the delay between the irradiation beam and the illumination beam, as well as triggering the Bobcat CCD camera (Imperx Incorporated, Boca Raton, Florida) to capture an image. The effect of laser light on the melanosomes was observed by a custom-built microscope using a Mitutoyo long-working-distance microscope objective (M Plan Apo). A 400-mm tube lens was used in order to achieve a total magnification of . This provides micrometer spatial resolution and a nanosecond strobe with steps of nanoseconds relative to the laser illumination. A shutter was placed prior to the sample to collect single-shot data. This setup allowed simultaneous laser irradiation of the melanosomes as well as the observation (photographs) of microcavitation formation. In addition, pre- and postcavitation images were collected and used to background subtract from the exposure image for improved photographs of the cavitation events. Figure 2 shows individual melanosomes under magnification [Fig. 2(a)], background-subtracted image of melanosomes during irradiation at above threshold at 1200 nm [Fig. 2(b)], and background-subtracted image of melanosomes at threshold at 1200 nm [Fig. 2(c)]. 4.Data Analysis and Threshold Fluence Values4.1.Fluence Threshold AnalysisBeam diameter measurements were determined prior to each data collection set using the knife edge technique. In each case, the spot size consisted of a Gaussian beam, which results in an average fluence value. The NIR exposures (1000 to 1319 nm) had an average beam diameter of . Some of the uncertainty in the NIR values is due to daily fluctuations from the OPO system. Results indicated no spot-size dependence on threshold fluence values for the small spot size variations in this experiment. Beam diameter measurements were also determined for the 532-nm values, with an average of . The estimated dose for 50% probability of laser-induced damage () was determined through the statistical method of Probit analysis, which is the standard technique for ascribing threshold values.30,31 The Probit procedure estimated the fluence required to cause melanosome microcavitation. Binary (yes/no) data points were entered into the Probit software, and the , slope, and fiducial limits (FL) were determined at the 95% confidence level. The fluence () is computed by Eq. (3). where is the energy per pulse and is the Gaussian beam diameter. In addition, uncertainties in the experimental measurements were taken into account in order to determine the total uncertainty for the fluence values, and resulted in a 16% total uncertainty.5.Results5.1.Threshold Fluence Values for MicrocavitationUsing the microscope setup with strobe photography, the microcavitation bubbles were directly visualized and recorded around single melanosomes suspended in deionized water following a single laser pulse. Data collection occurred at 1000, 1100, 1200, and 1319 nm, with 10- or 50-ns pulse duration. In addition, data collection occurred at 532 nm with 10-ns pulse duration to determine if the microcavitation threshold data were comparable to those published by other authors in the visible wavelength regime.6,20,32 Table 1 summarizes the Probit bovine and porcine microcavitation thresholds for heavy and light melanosome fractions at 1100 nm and includes the upper and lower fiducial limits, Probit slope, and total number of shots per trial. The fiducial limits are based on a 95% confidence interval. In each case, either three or four data sets were collected on different days, and Probit analysis was performed on each data set. These data illustrate that there is no statistical difference between thresholds of bovine and porcine melanosomes. Furthermore, the thresholds for heavy and light fractions within species are not statistically different. Because there were no statistical differences between the light and heavy fractions, all data trials were combined and a single Probit analysis was performed on all the data. Table 2 gives the Probit threshold values for all trials combined and illustrates that the combined trials for each melanosome fraction are statistically equivalent for both bovine and porcine samples at 1100 nm. Table 3 shows the Probit results at 1319 nm using a different laser with 50-ns pulse duration. Because thresholds for both bovine and porcine melanosome fractions were statistically equivalent at each wavelength, these data were later reduced to a single threshold value for each species at 1319 nm as seen in Table 2. Table 1Probit threshold data for a single pulse duration of 10 ns for bovine and porcine heavy (HB, HP) and light fractions (LB, LP) of melanosomes at 1100 nm. The 1/e2 Gaussian beam diameter average was 183 μm. The reported ED50 is an average fluence determined from the ED50 in terms of energy divided by the area calculated from the spot size area. Three or four separate data collection sets are shown for each melanosome fraction.
Table 2Probit threshold data for the combined trials for single pulse duration of 10 ns for HB, HP, LB and LP of melanosomes at 1100 nm. For each melanosome fraction, data points taken on successive days were analyzed using Probit to provide a single ED50 value. The 1/e2 Gaussian beam diameter average was 183 μm. The reported ED50 is an average fluence determined from the ED50 in terms of energy divided by the area calculated from the spot size area.
Table 3Probit threshold data for the combined trials for single pulse durations of 50 ns for HB, HP, LB, and LP fractions of melanosomes at 1319 nm. Similar to Table 2, the 1319 nm data taken on successive days was combined in order to produce a single ED50 threshold value. The 1/e2 Gaussian beam diameter average was 183 μm. The reported ED50 is an average fluence determined from the ED50 in terms of energy divided by the area calculated from the spot size area.
Table 4 summarizes the threshold data for bovine and porcine melanosomes at the four NIR wavelengths. Figure 3 is a plot of the comparison between wavelength and microcavitation threshold from 532 to 1319 nm and illustrates the nonlinear trend of threshold as a function of wavelength. Average fluence thresholds were found to rapidly increase with increasing wavelength from at 1000 nm to at 1319 nm. This is related to a decrease in melanosome absorption coefficients with increasing wavelengths, as shown in Sec. 5.2. The error bars in Fig. 3 represent the 95% fiducial confidence limits determined with Probit analysis. However, as previously reported, the overall variability and experimental uncertainty of the measured fluence at the values is estimated to be . Table 4Probit threshold data for all wavelengths collected. At each wavelength, data for both heavy and light melanosome fractions were combined into a single Probit average threshold fluence for bovine and porcine melanosomes.
Fig. 3Comparison of fluence threshold and wavelength of bovine and porcine melanosomes on a linear scale from 532 to 1319 nm. Error bars represent the upper and lower 95% fiducial confidence intervals. There are no statistical differences between the two species of melanosomes.  Table 5 is a comparison of the 532-nm, 10-ns threshold data with similar visible nanosecond pulse melanosome thresholds from various authors.6,7,20,32 The threshold values of 99.2 and are reported as average fluence, whereas Brinkmann et al.7 and Neumann and Brinkmann6,32 report peak fluence. In addition, average fluence values from Kelly20 are reported. The average fluence values from this current study are in the range of previous reported values. Peak fluence was determined from the bovine and porcine average fluence, resulting in values of 198.4 and , respectively, as a comparison to the values reported in Table 5. Table 5Threshold comparisons at 532 and 565 nm with single, nanosecond exposures from various authors. The uncertainty presented in this table for the present study represents the fiducial limits determined by Probit analysis. Brinkmann (Ref. 7) and Neumann (Refs. 6 and 32) report peak fluence values, while Kelly (Ref. 20) and the present study values represent an average fluence. 5.2.Melanosome Absorption CoefficientsMelanosome absorption coefficients were calculated from the threshold values found in Fig. 3. A first-order estimate of the melanosome absorption coefficient, , as a function of threshold fluence, (), measured at melanosome temperature T can be obtained using the equation of Brinkmann et al.7 Here is the melanosome specific heat, is the melanosome density, and is the threshold temperature for bubble formation. From Ref. 6, the melanosome-specific heat and particle density are and . Threshold fluences were measured at ambient temperature of , and for this first-order calculation, an estimated threshold temperature of was used based on the temperature-dependent, nanosecond pulse, melanosome microcavitation studies of Kelly20 and Neumann and Brinkmann.6 Averaging the bovine and porcine data from Table 4, the fluence thresholds were (1000 nm), (1100 nm), (1200 nm), and (1319 nm). Using these in Eq. (4), and solving for , yields melanosome absorption coefficients of (1000 nm), (1100 nm), (1200 nm), and (1319 nm). Table 6 shows the NIR absorption coefficients for melanosomes and are compared to RPE coefficients based on a fit to data extrapolated from data in Birngruber et al.14 The estimated uncertainty for the melanosome absorption coefficients in Table 6 is the result of the combined experimental threshold error and the uncertainty in the threshold temperature bubble formation () range reported by various authors.6,7,32 An additional method to determine absorption coefficients can be performed according to Gerstman et al.10 In this case, Mie scattering effects are neglected, and the internal absorption coefficient of an RPE melanosome can be calculated, resulting in a homogeneous absorption coefficient. Neumann and Brinkmann6 used this method to compare the measured absorption efficiency of RPE melanosomes to absorption coefficients reported by other authors. The resulting homogeneous absorption coefficients are in reasonable agreement with absorption coefficients of melanosomes found in previous studies.6 The method used in this study to estimate absorption coefficients are within the range of previously reported RPE melanosome absorption coefficients at 532 nm found in Ref. 6 as well as the calculated coefficients based on Gerstmann et al.10 Table 6A comparison of the retinal pigmented epithelium (RPE) and melanosome absorption coefficients (μm) as a function of wavelength. The RPE values were based on a fit to data extrapolated from Birngruber et al. (Ref. 14). The uncertainty was estimated by combining the experimental uncertainty of Fth and the threshold temperature (Tth) variability from Refs. 6, 7, and 32.
The NIR absorption coefficients for melanosomes and RPE are plotted in Fig. 4, along with the water absorption on a log scale. While the granular absorption coefficients are an order of magnitude higher than the corresponding layer values, the results indicate that the relative changes in absorption coefficient as a function of wavelength are similar. The absorption coefficient of the melanosomes also remains much larger than that of water, indicating that microcavitation should be possible beyond 1319 nm. Fig. 4Absorption coefficients on log scale with water comparison, curve of retinal pigmented epithelium (RPE) data from Birngruber et al. (Ref. 14) at 532 to 1400 nm. Although the magnitude is different between RPE and melanosome coefficients, the overall relative trend of decreasing value with increasing wavelength is observed.  6.Discussion6.1.Microcavitation ThresholdsThis paper documents the first reported measurements of melanosome microcavitation threshold data for single, nanosecond-duration laser pulses in the 1 to 1.3 μm wavelength region. Melanosome microcavitation in the RPE is believed to be the threshold level ocular damage mechanism for sub-microsecond-duration laser exposures in the visible and NIR. These NIR microcavitation data are especially relevant at this time because of a recent proposal to modify the ANSI Z136.1 safety standards in the NIR. Supporting data are needed for this proposal, not only on ocular damage thresholds, but also on ocular damage mechanisms and trends. Results indicate that there is no significant difference in absorption characteristics between melanosome fractions even though there are slight shape and size differences between heavy and light melanosomes based on the separation method used for these experiments. Results also indicate that there is a significant increase in NIR threshold values with increasing wavelength, but no significant difference between bovine and porcine melanosomes. In addition, 532-nm data were collected and compared to previous reports from other authors. The threshold value obtained was in the midrange of previously published values, indicating that the data presented here are similar to those collected by other researchers. These data validate the threshold range presented in this paper in the NIR wavelength region. 6.2.Melanosome Absorption CoefficientsThe data of Fig. 3 show a nonlinear increase in microcavitation fluence threshold with increasing wavelength, especially in the transition between 1200 and 1300 nm. A fivefold decrease was calculated in the melanosome absorption coefficient between 1000 and 1319 nm based on the microcavitation threshold data and the model of Brinkmann et al.,7 as shown in Table 6 and Fig. 4. While the melanosome absorption coefficients are much higher than the corresponding RPE layer values, the data trends are similar to those of the RPE absorption coefficients. Results were compared to the RPE layer absorption coefficients in the NIR due to the lack of NIR melanosome coefficient data. Two different material absorption trends influence ocular absorption and ocular damage in this region. First, water absorption increases dramatically above 1050 nm, reducing light transmission to the retina and producing a shift from retinal to corneal damage at longer optical wavelengths (seen in Fig. 4). Second, there is a significant decrease in the melanosome absorption coefficient as wavelengths increase from the visible into the mid-IR. Thus, these data confirm the trends in absorption coefficients with increasing wavelength. 6.3.Total Intraocular Energy Trends and MPE LevelsIn order to determine the validity of melanosome cavitation threshold values, estimated retinal spot size and ocular transmission values were calculated for rhesus monkey, rabbit, and human eyes based on the model of Vincelette et al.,18 and fluence threshold values from this experiment were used to calculate the energy (in joules) needed to cause retinal damage in this regime. Since the exact energy reaching the retina is unknown, retinal damage thresholds are typically reported as the total intraocular energy (TIE), which is the energy delivered to the corneal plane resulting in retinal damage. Furthermore, estimates of TIE help determine the energy that produces minimum visible lesions (MVLs). In this study, estimates for the retinal beam diameter were based on the TIE from a 3-mm-diameter () Gaussian beam entering an emmetropic eye, which is typical of experimental data. Figure 5 compares the TIE values of the three species, based on the transmission to the retina, to the current and proposed MPE levels. In each case, the average threshold values at each studied wavelength were used to determine the TIE damage values. Error bars for the estimated TIE values represent uncertainty, based on a diopter deviation from emmetropia, uncertainty in retinal transmission, and uncertainty in energy measurements.33 Figure 5 indicates that as wavelength increases, the changes in transmission to the retina vary with species, resulting in significantly different TIE values at 1319 nm. Figure 5 also shows all but the TIE values at 532 nm well above the current MPE levels (solid line). Figure 5 also includes the proposed MPE levels (dashed line) for the new ANSI standard2 to show that a sufficient margin of safety is maintained across the retinal hazard regime. These data support the proposed lowering of MPE levels at 532 nm, as well as the proposed increase in MPE levels at 1300 nm. Fig. 5Comparison of ANSI Z136.1-2007 and proposed ANSI Z136.1-201x exposure limits for 1 to 100 ns pulses, expressed in terms of permissible total intraocular energy (TIE). Estimated threshold is based upon a 3-mm-diameter () Gaussian beam entering a human, rhesus, or rabbit eye, respectively. The estimated uncertainty of 51% was determined from diopter, retinal transmission uncertainty, and energy measurement uncertainty.  Figure 6 further compares estimated TIE thresholds for the rhesus eye (based on a 3 mm beam diameter) to in vivo nanosecond experimental studies in the rhesus eye, with differing beam diameters over the wavelength range from 532 to 1319 nm.34–41 As shown, the trends in the estimated values from the fluence thresholds determined in this study mimic the trends in the MVL studies of several authors. The uncertainty for the in vivo measurements corresponds to the upper and lower fiducial limits found in Table 7. Table 7 reports in vivo results in the nanosecond pulse duration from 532 to 1319 nm for rhesus monkey subjects. Fig. 6Comparison of ANSI Z136.1-2007 and proposed ANSI Z136.1-201x exposure limits for 1 to 100 ns pulses, expressed in terms of permissible TIE. Estimated threshold is based upon a 3-mm-diameter () Gaussian beam entering a rhesus eye. Experimental data are from referenced sources in Table 7 (Refs. 34 to 41), including a number of differing beam diameters to the eye, but rhesus subjects. 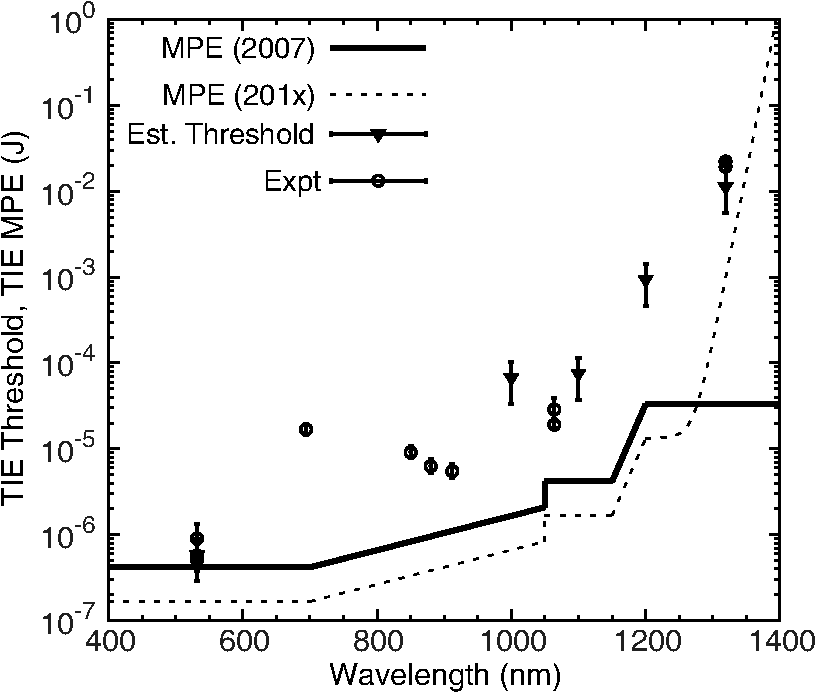 Table 7Comparison of in vivo ED50 TIE values from 532 to 1319 nm in the nanosecond pulse regime, and a range of corneal irradiance diameters. These data are plotted in Fig. 6 and compared with estimated threshold values in the same wavelength regime (Refs. 34 to 41).
Trends in melanosome microcavitation fluence thresholds determined in this study are comparable to estimated and experimental TIE thresholds from 532 to 1319 nm. Both experimental data and estimated threshold values based on single melanosome microcavitation events indicate that the proposed changes to the MPE values are adequate. This study indicates that threshold measurements at 532 nm could potentially overlap with the 2007 MPE levels. In addition, this study provides data that support the increase in MPE levels at 1300 nm. This report validates the proposed changes to the MPE levels. 7.ConclusionsThis research investigated trends in single melanosome microcavitation thresholds for nanosecond pulses in the NIR (1000 to 1319 nm) wavelength regime. While many studies have been reported for visible nanosecond pulse melanosome microcavitation, NIR nanosecond microcavitation has been neglected. This study reports the first threshold values for NIR nanosecond pulse melanosome microcavitation, as well as the first reported values for NIR melanosome absorption coefficients. Melanosome microcavitations were observed through strobe microscopy, and fluence threshold values were determined through Probit analysis. Results indicated that as the laser wavelength increased, the threshold values also increased nonlinearly with a factor of lower at 532 nm than at 1319 nm. In addition, results follow trends in bulk RPE layer absorption reported by other authors. There is a significant increase in threshold values at 1319 nm compared to 1200 nm. No statistical differences were seen between thresholds for bovine and porcine melanosomes, and no differences were observed between the heavy and light melanosomes. The latter indicates that slight size variations do not significantly affect melanosome laser energy absorption. The nonlinear increase in NIR threshold appears to be primarily due to a corresponding decrease in melanosome absorption coefficients with increasing wavelength. Calculations indicated a fivefold decrease in the melanosome absorption coefficient between 1000 and 1319 nm. This trend was found to be comparable to the decrease in RPE layer absorption coefficients over the same wavelength region. Estimated TIE values were calculated based on melanosome microcavitation fluence thresholds, and they agree with published in vivo MVL studies. Estimated TIE values were also compared to current and proposed MPE values, and these data support the proposed revisions to the safety standard MPEs in the 532 to 1400 nm wavelength region. AcknowledgmentsThis research was supported in part while Morgan Schmidt was appointed to the Postgraduate Research Participation Program at the Air Force Research Laboratory, 711th Human Performance Wing, Bioeffects Division, Optical Radiation Bioeffects Branch administered by the Oak Ridge Institute for Science and Education through an interagency agreement between the U.S. Department of Energy and AFRL. In addition, this research was performed in part while Morgan Schmidt held a National Research Council Research Associateship at AFRL. ReferencesAmerican National Standards Institute, “American National Standard for safe use of lasers,”
(2014) http://www.lia.org/PDF/Z136_1_s.pdf February ). 2014). Google Scholar
“ICNIRP guidelines on limits of exposure to incoherent visible and infrared radiation,”
Health Phys., 105
(1), 74
–96
(2013). HLTPAO 0017-9078 Google Scholar
R. L. Vinceletteet al.,
“Trends in retinal damage thresholds from 100-millisecond near-infrared laser radiation exposures: a study at 1,110, 1,130, 1,150, and 1,319 nm,”
Lasers Surg. Med., 41
(5), 382
–390
(2009). http://dx.doi.org/10.1002/(ISSN)1096-9101 LSMEDI 0196-8092 Google Scholar
J. A. ZuclichD. J. LundB. E. Stuck,
“Wavelength dependence of ocular damage thresholds in the near-IR to far-IR transition region: proposed revisions to MPEs,”
Health Phys., 92
(1), 15
–23
(2007). http://dx.doi.org/10.1097/01.HP.0000232188.69779.69 HLTPAO 0017-9078 Google Scholar
C. P. LinM. W. Kelly,
“Cavitation and acoustic emission around laser-heated microparticles,”
Appl. Phys. Lett., 72
(22), 2800
–2802
(1998). http://dx.doi.org/10.1063/1.121462 APPLAB 0003-6951 Google Scholar
J. NeumannR. Brinkmann,
“Boiling nucleation on melanosomes and microbeads transiently heated by nanosecond and microsecond laser pulses,”
J. Biomed. Opt., 10
(2), 024001
(2005). http://dx.doi.org/10.1117/1.1896969 JBOPFO 1083-3668 Google Scholar
R. Brinkmannet al.,
“Origin of retinal pigment epithelium cell damage by pulsed laser irradiance in the nanosecond to microsecond time regimen,”
Lasers Surg. Med., 27
(5), 451
–464
(2000). http://dx.doi.org/10.1002/(ISSN)1096-9101 LSMEDI 0196-8092 Google Scholar
C. P. Linet al.,
“Selective cell killing by microparticle absorption of pulsed laser radiation,”
IEEE J. Sel. Topics Quantum Electron., 5
(4), 963
–968
(1999). http://dx.doi.org/10.1109/2944.796318 IJSQEN 1077-260X Google Scholar
B. A. RockwellR. J. ThomasA. Vogel,
“Ultrashort laser pulse retinal damage mechanisms and their impact on thresholds,”
Med. Laser Appl., 25
(2), 84
–92
(2010). http://dx.doi.org/10.1016/j.mla.2010.02.002 1615-1615 Google Scholar
B. S. Gerstmanet al.,
“Laser-induced bubble formation in the retina,”
Surg. Med., 18
(1), 10
–21
(1996). http://dx.doi.org/10.1002/(ISSN)1096-9101 LSMEDI 0196-8092 Google Scholar
H. Leeet al.,
“Optical detection of intracellular cavitation during selective laser targeting of the retinal pigment epithelium: dependence of cell death mechanism on pulse duration,”
J. Biomed. Opt., 12
(6), 064034
(2007). http://dx.doi.org/10.1117/1.2804078 JBOPFO 1083-3668 Google Scholar
J. NeumannR. Brinkmann,
“Cell disintegration by laser-induced transient microbubbles and its simultaneous monitoring by interferometry,”
J. Biomed. Opt., 11
(4), 041112
(2006). http://dx.doi.org/10.1117/1.2339815 JBOPFO 1083-3668 Google Scholar
D. H. SlineyM. L. Wolbarsht, Safety with Lasers and Other Optical Sources, Plenum Press, New York
(1980). Google Scholar
R. BirngruberF. HillenkampV. P. Gabel,
“Theoretical investigations of laser thermal retinal injury,”
Health Phys., 48
(6), 781
–796
(1985). http://dx.doi.org/10.1097/00004032-198506000-00006 HLTPAO 0017-9078 Google Scholar
R. BrinkmannJ. RoiderR. Birngruber,
“Selective retina therapy (SRT): a review on methods, techniques, preclinical and first clinical results,”
Bulletin de la Societe Belge d’Ophtalmologie, 302 51
–69
(2006). BBOPAX 0081-0746 Google Scholar
C. P. Cainet al.,
“Porcine skin visible lesion thresholds for near-infrared lasers including modeling at two pulse durations and spot sizes,”
J. Biomed. Opt., 11
(4), 041109
(2006). http://dx.doi.org/10.1117/1.2338815 JBOPFO 1083-3668 Google Scholar
R. L. Vinceletteet al.,
“First-order model of thermal lensing in a virtual eye,”
J. Opt. Soc. Am. A Opt. Image Sci. Vis., 26
(3), 548
–558
(2009). http://dx.doi.org/10.1364/JOSAA.26.000548 JOAOD6 0740-3232 Google Scholar
R. L. Vinceletteet al.,
“Thermal lensing in ocular media exposed to continuous-wave near-infrared radiation: the 1150–1350-nm region,”
J. Biomed. Opt., 13
(5), 054005
(2008). http://dx.doi.org/10.1117/1.2978066 JBOPFO 1083-3668 Google Scholar
D. J. Payneet al.,
“Comparative study of laser damage threshold energies in the artificial retina,”
J. Biomed. Opt., 4
(3), 337
–334
(1999). http://dx.doi.org/10.1117/1.429935 JBOPFO 1083-3668 Google Scholar
M. W. Kelly,
“Intracellular cavitation as a mechanism of short-pulse laser injury to the retinal pigment epithelium,”
Medford, Massachusetts
(1997). Google Scholar
I. A. Vitkinet al.,
“Optical and thermal characterization of natural (Sepia officinalis) melanin,”
Photochem. Photobiol., 59
(4), 455
–462
(1994). http://dx.doi.org/10.1111/php.1994.59.issue-4 PHCBAP 0031-8655 Google Scholar
M. H. Niemz, Laser-Tissue Interactions Fundamentals and Applications, Springer, New York
(1996). Google Scholar
D. Leszczynskiet al.,
“Laser-beam-triggered microcavitation: a novel method for selective cell destruction,”
Radiat. Res., 156
(4), 399
–407
(2001). http://dx.doi.org/10.1667/0033-7587(2001)156[0399:LBTMAN]2.0.CO;2 RAREAE 0033-7587 Google Scholar
E. FaraggiB. S. Gerstman,
“Acoustical resonant absorption of pulsed laser radiation by a spherical absorper,”
J. Appl. Phys., 102
(12), 123505
(2007). http://dx.doi.org/10.1063/1.2822247 JAPIAU 0021-8979 Google Scholar
G. Schueleet al.,
“RPE damage thresholds and mechanisms for laser exposure in the microsecond-to-millisecond time regimen,”
Invest. Ophthalmol. Vis. Sci., 46
(2), 714
–719
(2005). http://dx.doi.org/10.1167/iovs.04-0136 IOVSDA 0146-0404 Google Scholar
J. RoegenerR. BrinkmannC. P. Lin,
“Pump-probe detection of laser-induced microbubble formation in retinal pigment epithelium cells,”
J. Biomed. Opt., 9
(2), 367
–371
(2004). http://dx.doi.org/10.1117/1.1646413 JBOPFO 1083-3668 Google Scholar
A. VogelV. Venugopalan,
“Mechanisms of pulsed laser ablation of biological tissues,”
Chem. Rev., 103
(2), 557
–644
(2003). CHREAY 0009-2665 Google Scholar
E.-A. BrujanA. Vogel,
“Stress wave emission and cavitation bubble dynamics by nanosecond optical breakdown in a tissue phantom,”
J. Fluid Mech., 558 281
–308
(2006). http://dx.doi.org/10.1017/S0022112006000115 JFLSA7 0022-1120 Google Scholar
A. E. DontsovR. D. GlickmanM. A. Ostrovsky,
“Retinal pigment epithelium pigment granules stimulate the photo-oxidation of unsaturated fatty acids,”
Free Radic. Biol. Med., 26
(11–12), 1436
–1446
(1999). http://dx.doi.org/10.1016/S0891-5849(99)00003-9 FRBMEH 0891-5849 Google Scholar
C. P. CainG. D. Noojin,
“A comparison of various probit methods for analyzing yes/no data on a log scale,”
(1996). Google Scholar
D. J. Finney, Probit Analysis, Cambridge University Press, New York, NY
(1971). Google Scholar
J. NeumannR. Brinkmann,
“Nucleation dynamics around single microabsorbers in water heated by nanosecond laser irradiation,”
J. Appl. Phy., 101
(11), 114701
(2007). http://dx.doi.org/10.1063/1.2740348 JAPIAU 0021-8979 Google Scholar
D. H. Slineyet al.,
“What is the meaning of threshold in laser injury experiments? Implications for human exposure limits,”
Health Phys., 82
(3), 335
–347
(2002). http://dx.doi.org/10.1097/00004032-200203000-00006 HLTPAO 0017-9078 Google Scholar
C. P. Cainet al.,
“Visible retinal lesions from ultrashort laser pulses in the primate eye,”
Invest. Ophthalmol. Vis. Sci., 36
(5), 879
–888
(1995). IOVSDA 0146-0404 Google Scholar
B. J. LundD. J. LundP. R. Edsall,
“Laser-induced retinal damage threshold measurements with wavefront correction,”
J. Biomed. Opt., 13
(6), 064011
(2008). http://dx.doi.org/10.1117/1.3013455 JBOPFO 1083-3668 Google Scholar
B. J. LundD. J. LundP. R. Edsall,
“Damage threshold from large retinal spot size repetitive-pulse laser exposures,”
in Int. Laser Safety Conf.,
(2009). Google Scholar
E. S. FrischG. D. BeatriceR. C. Holsen,
“Comparative study of argon and ruby retinal damage thresholds,”
Invest. Ophthalmol. Vis. Sci., 10
(11), 911
–919
(1971). IOVSDA 0146-0404 Google Scholar
D. J. LundE. S. BeatriceS. T. Schuschereba,
“Bioeffects data concerning the safe use of GaAs laser training devices,”
Combat Ocular Problems, 15
–29 Letterman Army Institute of Research, San Francisco, California
(1982). Google Scholar
C. P. Cainet al.,
“Thresholds for visible lesions in the primate eye produced by ultrashort near-infrared laser pulses,”
Invest. Ophthalmol. Vis. Sci., 40
(10), 2343
–2349
(1999). IOVSDA 0146-0404 Google Scholar
C. P. Cainet al.,
“Visible lesion thresholds from near-infrared pico and nanosecond laser pulses in the primate eye,”
Proc. SPIE, 2975 133
–137
(1997). http://dx.doi.org/10.1117/12.275467 PSISDG 0277-786X Google Scholar
J. A. Zuclichet al.,
“Ocular effects and safety standard implications for high-power lasers in the 1.3–1.4 μm wavelength range,”
1
–16
(2004). Google Scholar
|