|
|
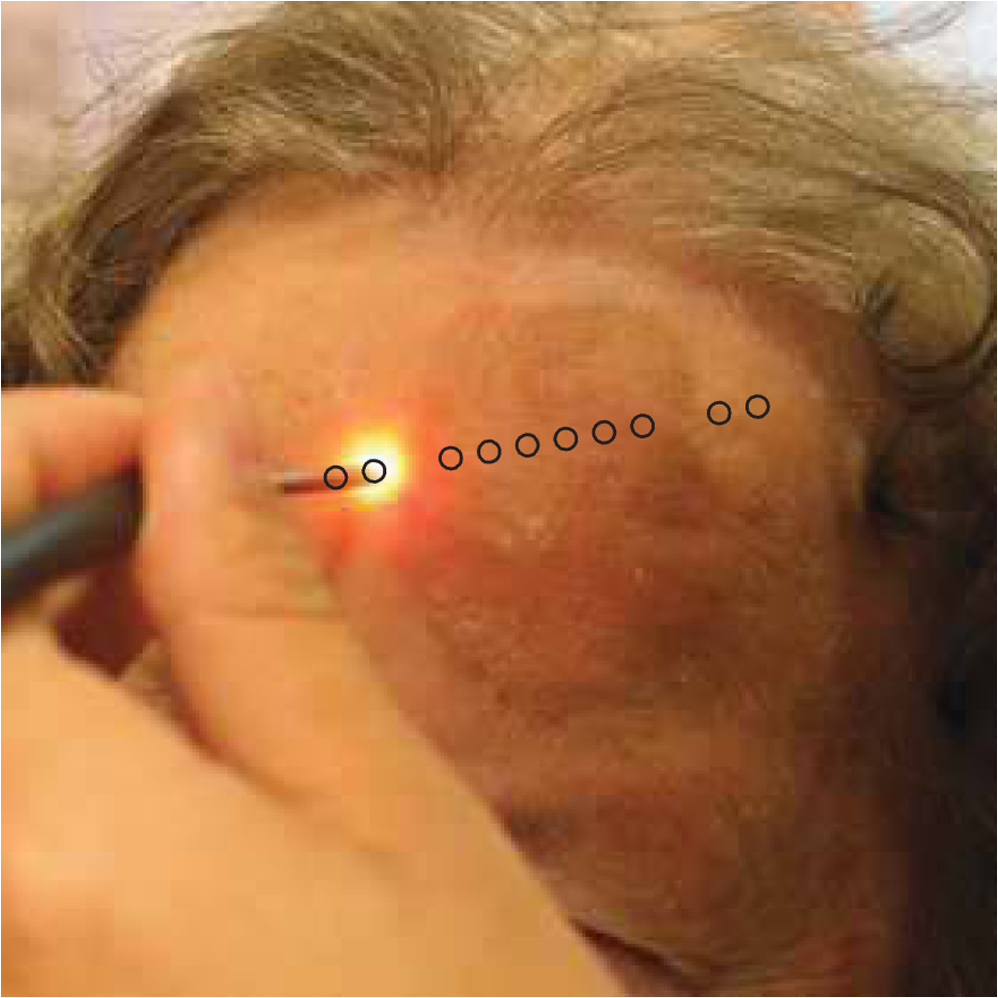
1.IntroductionOptical techniques provide powerful means for tissue diagnostics in a wide variety of biomedical applications. Extensive efforts have been made in developing optical diagnostic tools which are noninvasive, inexpensive and could be applied in vivo and in real time. Fiber optic probes for biomedical optical spectroscopy enable clinical use in endoscopy, surgery, and neurological imaging.1 Typically, such a probe incorporates a light source, fiber optic cables for light transport, and an optical detector integrated with spectroscopic devices. Different spectroscopic fiber optic probes have long since been developed and used to substantially improve clinical diagnostic capability for different purposes,2,3 such as surgical guidance during brain tumor resection,4–6 determination of tissue optical property for optical biopsy of brain tissue7 and for interstitial photodynamic therapy (PDT),8 treatment monitoring during PDT,9,10 lung cancer staging of mediastinal lymph nodes,11 diagnosis of nonalcoholic fatty liver disease,12 detection of metastatic breast cancer in sentinel lymph nodes,13 and tumor oxygenation monitoring and tissue optical properties evaluation for breast cancer diagnosis.14,15 These probes have the flexibility that they can be manufactured into either cavities or tubular structures, put in contact with epithelial surfaces, or inserted into structures, punctured by rigid devices such as needles.1 Most of the spectroscopic fiber optic probes for biomedical applications are performing reflectance and/or fluorescence spectroscopy of turbid tissue. These probes are capable of providing quantitative molecular and functional information to distinguish normal from abnormal human tissue. For example, Kanick et al.11 employed a single-fiber reflectance spectroscopy system for lung cancer staging. They developed a data evaluation model to extract information about the physiological and morphological properties of lymph tissue. Austwick et al.13 developed a scanning elastic scattering spectroscopy system, combined with statistical discrimination analysis. It was used to detect metastatic breast cancer in sentinel lymph nodes. Fluorescence spectroscopic probes are a different approach, where either endogenous tissue fluorescence (i.e., tissue autofluorescence) or exogenous fluorescence from contrast agents is used for tissue discrimination. For instance, a fiber optic fluorosensor was developed to measure the fluorescence signal from 5-aminolevulinic acid (ALA)-induced protoporphyrin IX (PpIX) for tumor resection guidance during open brain surgery.4,5 To correct for tissue autofluorescence superimposed on the PpIX fluorescence peak, a dimensionless fluorescence ratio was taken between these two spectral bands. To further improve the data evaluation, a photobleaching-insensitive method was developed based on a dynamic model together with multivariate analysis.16 Valdes et al. reported a combined fluorescence and reflectance spectroscopy system for in vivo quantification of PpIX in low- and high-grade glioma surgery. They conducted model based evaluation to correct the detected fluorescence spectra for tissue optical properties from the reflectance.6,17 Foscan® concentration in rat liver in vivo was measured by Kruijt et al. with fluorescence differential path length spectroscopy, based on the fluorescence intensity corrected for absorption from the differential reflectance spectra.18 Fluorescence biochemical probes have been extensively applied to fluorescence-guided surgery (FGS) of malignant brain tumors.5,19–21 In this area, 5-ALA–induced PpIX accumulates in malignant tumors and inflamed brain tissue because of the blood–brain barrier.20,21 The resulting increased tumor tissue fluorescence is used to enhance the contrast between the tumors and surrounding healthy tissue. It could thus assist the surgeon in deciding which tissue to remove or spare in open brain surgery and improve surgical outcomes. By this technique, brain tumors have been visualized using two types of fluorescence probes: Type I, point spectroscopic tools (such as fiber optic probes) for measuring at one region at a time, and Type II, imaging systems (such as in vivo fluorescence microscopy, modified surgical microscopes, commercial neurosurgical operating fluorescent microscopes) for displaying every point in the area of resection. The noncontact surgical microscopy instruments are implemented as a standard in surgical resection today. However, they suffer from only being useful for identifying tumor subtypes with relatively high PpIX accumulation due to low sensitivity from the limited capture of light.6,19,22 The imaging modalities are also limited to very superficial tissue as a result of the limited penetration depth for the excitation light. In contrast, a point probe can provide spectroscopy with better spectral information and usually higher overall sensitivity. It can be incorporated into hand tools used by the surgeon, such as ultrasonic vacuum suction devices, scalpels, and navigation systems.5 Therefore, it can proceed to underlying regions and be able to probe the tissue to be removed. Further, this may allow penetration beyond the exposed superficial cell layer, which is of critical importance in resecting the infiltrative tumors. The previous point monitoring systems have mainly used fluorescence spectroscopy based on spectrometers. Despite many wavelength channels, those systems only provide at most three spectral components among several individuals and measurement locations,16 thus providing limited diagnostic information for tissue diagnostics of complex tissue structures. In addition, a slight limitation with both current imaging and fiber-based FGS systems is their high sensitivity to the surrounding light sources in the operating room (OR). This results from the fact that the integration time of the detector has to be long enough to detect the weak fluorescence signal. The light fluctuation within the relatively long measurement time could also lead to imprecise measurements. Dim lighting conditions or shading the measurement region from the direct light required by current FGS systems are obviously disruptive to standard surgical workflow. There exists a need for an intraoperative FGS fluorescence spectroscopic system capable of suppressing ambient light in the OR while high fluorescence sensitivity and larger probing depth could be achieved. In this paper, we demonstrate a clinically adapted hand-held fiber optic probe system based on fluorescence/reflectance spectroscopy with pulse modulation in combination with the light detection of the signal strength only at the modulation frequency. The probe was validated by tissue phantom measurements and in vivo clinical measurements on patients with skin tumors. It demonstrates insensitivity to ambient light as well as accurate assessment of both fluorophore concentration and tissue optical properties. It is mainly aimed for brain tumor resection guidance, by providing the operating surgeon with an intuitive and real-time surgical guidance tool. The probe is applicable to other tissue types and fluorophores for therapy guidance and monitoring in a general sense. 2.Materials and Methods2.1.System DescriptionThe fiber optic probe instrument described here was configured to quantify PpIX using fluorescence/reflectance spectroscopy for therapy guidance and monitoring under surgical conditions during open brain surgery. The schematic diagram of the probe system is shown in Fig. 1. It consists of a light source with five fiber-coupled light-emitting diodes (LEDs), a source/detector fiber optic probe, a detection unit, a data acquisition (DAQ) board, electronic circuits, and a laptop computer. The entire system was assembled on a trolley with a dimension of and a total weight of 15 kg, to facilitate flexibility in use in the examination room or OR. Fig. 1Schematic diagram of the fiber optic point probe system, illustrating in vivo measurement of a skin lesion on the right leg of a patient. The subplot on the top left shows the real-time raw optical data detected by the five photodetectors, including the PpIX fluorescence, tissue autofluorescence, and reflectance spectra. Here, the abbreviations in this figure are BS, dichroic beam splitter; LP, long-pass filter; BP, bandpass filter; PD, photodiode; and APD, avalanche photodiode.  2.1.1.Light sourceThe light source comprises five fiber-coupled LEDs (Prizmatix Ltd., Israel; FC5-LED) at four different wavelengths: 365, 405, 530, and 635 nm, as well as a white light LED (450 to 700 nm). The 405-nm and 365-nm LED were chosen to provide a strong signal from PpIX fluorescence at 635 nm and tissue autofluorescence with a broad spectrum in the visible range, respectively. The other three LEDs were used to monitor tissue optical properties from the reflectance measurements at wavelengths of interest. When running in the continuous mode, all LEDs had a maximal output power of approximately 13 mW through a polymer optical fiber (POF) of 750-μm core diameter and a numerical aperture (NA) of 0.5. The power could be adjusted with a potentiometer located on the front panel. All LEDs were multiplexed to work sequentially, driven by a transistor-transistor logic (TTL) pulse at 777 Hz with a duty cycle of 8.3% for each LED. The source multiplexing module consists of a counter (CD40193) and a demultiplexer (CD4514). There were six pulses within one period: each LED was lit up in turn within the first five pulses, followed by one pulse with all LEDs switched off. This allowed the measurement of ambient light level. 2.1.2.Fiber optic probeThe custom-made hand-held fiber probe (Prizmatix Ltd., Givat-Shmuel, Israel; Y-shaped fiber patch cord bundle) consists of six surrounding delivery fibers (one spare fiber during the measurement) and one collection fiber at the center. All fibers were made of POFs (750-μm core diameter, 0.50 NA, 4-m long), which could be sterilized with ETO gas in clinical practice. They were bundled together into a stainless steel tube (5 cm long and with a 4-mm diameter), and the other end of the fibers was assembled to an SMA905 connector. The distance between two adjacent cores is almost the same as the fiber core diameter, as the cladding of POF is . The probe tip was held perpendicular to and in contact with the sample surface. 2.1.3.Detection unitThe collected light from the sample was detected by the detection unit, mounted in a compact black anodized aluminum box (designed in-house using CAD). Collected light from the central fiber was collimated (Edmund Optics Inc., Barrington, New Jersey; 64770) and split into five different light paths by four dichroic beam splitters (BS) (Thorlabs Inc., Newton, New Jersey; DMPL425, 505, 567, and 638). On each path, light was detected either by a silicon photodiode (PD) (Edmund Optics; 53378) with a UV enhanced response, or an avalanche photodiode (APD) (Hamamatsu, Hamamatsu City, Japan; S9075, 1.5-mm active area). All four APDs were working at a reversed bias voltage of approximately , generated from an APD bias voltage power supply module (Hamamatsu; M6017). To suppress the back-reflected elastic violet light from reaching the APDs, a long-pass cutoff filter (Edmund Optics; GG-435) was positioned after the first elastic channel. In front of each detector, there is a light-focusing lens (Edmund Optics; 47884). For each APD, a 10-nm full width at half maximum (FWHM) narrowband bandpass filter (Edmund Optics; FB470-10, FB530-10, FB-635-10, and FB-660-10, respectively) was assembled. The photocurrent in each detector was converted to voltage with a larger dynamic range by an in-house transimpedance amplifier, consisting of an Operation Amplifier and RC feedbacks. The entire box has a dimension of together with the components. 2.1.4.Pulse generation and data acquisitionThe TTL pulse to modulate the light source was generated from the digital clock output of a 16-bit DAQ board (National Instruments Corp., Austin, Texas; NI USB-6351). The photovoltages in the PD and APDs were recorded by the analog inputs of the DAQ. 2.1.5.Intensity calibrationThe intensity of each detection band was calibrated with a high-power quartz tungsten halogen lamp (Oriel Instruments, Stratford, Connecticut; 63355), powered by a current power supply (Oriel; 68830) with an output current of 6.5 A. Light from the calibration lamp was guided by an optic fiber (Thorlabs Inc., Newton, New Jersey; 600-μm core diameter, 0.39 NA, positioned 5 m away from the lamp) and entered the detection box without any sample. The voltage outputs on the photodetectors were normalized to the known intensity spectrum of the lamp for all five detection channels. Unless otherwise stated, all calibration measurements were conducted in a dark laboratory room. 2.1.6.Thermal calibrationTo compensate for the gain variation with temperature, each APD was glued with a thermistor (PTC 60-323-30, Elfa Distrelec, Järfälla, Sweden) on the rear surface so that the APD temperature could be monitored. Thermal calibration measurement was performed in a similar way as described in Sec. 2.1.5 but mounting all detection units in a mobile car fridge (Mobicool Ltd., Shenzhen, China; TC-16-12/230), which could be cooled down to . The measured photovoltage on each APD () versus the voltage on each thermistor () was fitted by an exponential equation where and are the fitting coefficients. Both and were averaged over all samples within the integration time. For each photovoltage measured later on, it was multiplied by a thermal calibration factor, (), calculated from the corresponding thermal voltage with Eq. (1)2.1.7.SoftwarePulse generation, DAQ, and real-time signal manipulation were performed by a custom LabVIEW® (National Instruments Corp., Austin, Texas; Version 2012) application running on a laptop computer. Off-line data analysis was performed in the Matlab® environment (Mathworks™, Inc., Natick, Massachusetts; version R2012a) on a conventional PC. LS-SVMlab (version 1.8),23 a MATLAB toolbox for least squares support vector machines (LS-SVM) was employed for multivariate regression and tissue classification analysis. 2.2.Experimental Procedure2.2.1.Phantom preparationPhantom experiments were carried out to test the system performance. A set of well-controlled tissue-like liquid phantoms were prepared by mixing water, intralipid (Fresenius Kabi, Uppsala, Sweden; ), and India ink (Pelican Fount, Hannover, Germany; 1:100 stock solution prepared in our laboratory) or bovine blood (purchased from a local supermarket). The optical properties were chosen to have a good correspondence to real biological tissue. PpIX stock solution was prepared by dissolving 0.056 g PpIX powder (Fisher Scientific, Pittsburg, Pennsylvania) in 20 ml dimethyl sulfoxide (DMSO) (Merck, Darmstadt, Germany) and 80 ml distilled water, resulting in a PpIX concentration of 1 mM. When diluting the PpIX solution in the phantom, 2% volume of Tween (Scharlau Chemie S.A., Barcelona, Spain) was added to prevent PpIX from aggregation. The ink phantom contained 3.75% volume of intralipid, 0.25% volume of ink, and 100 nM PpIX. In total 270 blood phantoms were prepared containing different concentrations of intralipid (3%, 4%, 5%, 6%, 7%, and 8%, v:v), bovine blood (0%, 1%, 2%, 3%, and 4%, v:v), and PpIX (0, 100, 200, 300, 400, 500, 600, 750, and 1000 nM), respectively. Each phantom was placed in a cylindrical glass container. The phantoms were stirred for 4 h prior to the measurements using a magnetic stirrer (to ensure that the temperature of each APD was stable) and kept stirred during the measurements. The reduced scattering coefficient of each phantom, in , was estimated from the expression24 where is the concentration of intralipid-20% in and is the light wavelength in μm.The absorption coefficient at 635 nm, , and reduced scattering coefficient, , of the phantoms were measured with a time-of-flight (TOF) spectroscopy system employing a supercontinuum white light source, described in detail elsewhere.25 2.2.2.In vivo clinical validation measurements of skin cancerThe performance of the system was validated on a total of eight patients (all of skin phototypes I–III) with skin cancers at the Department of Dermatology and Venereology, Skåne University Hospital, Sweden. The study was conducted with the approval of the Local Ethics Committee and in accordance with the ethical principles of the Declaration of Helsinki. Patients were assessed and recruited by the clinical team at outpatient clinics and were going to receive PDT after the spectral measurements. Three hours prior to PDT, all patients were topically applied with either Ameluz® ( gel, Biofrontera AG, Germany) or Metvix® (, Galderma, France) to the lesion as an approximately 1-mm-thick layer including 5 mm of the surrounding normal tissue. The lesions are summarized in Table 1. Table 1Summary of the skin lesions in this study. Eight patients were involved in the clinical study, each with one lesion. For each lesion, a number of spots on both the tumor and surrounding normal tissue were measured.
The spectral measurements on patients were performed just prior to PDT. For each lesion, a couple of locations were measured on both the tumor and neighboring tissue. The number of measurements, depending on the lesion size, is illustrated in an example image in Fig. 2 and listed in Table 1. After the measurements, the patients received PDT for 14 min. 2.3.Evaluation Protocol2.3.1.Data preprocessingThe collected pulses on all detectors were preprocessed following the procedure as illustrated by the flowchart in Fig. 3. Within each pulse from one detector, the first and the last two data points were excluded and then an average signal value was calculated. The background, measured as the average value from the time slot when all LEDs were turned off, was then subtracted from all the other measured values of the remaining five time slots. To increase the signal-to-noise ratio, the signal was averaged over 70 light cycles, corresponding to a total integration time of 90 ms. Thereafter, the APD data were divided by the corresponding PD data for the UV, blue, and white light LED cycle, in order to compensate for the source fluctuation and tissue attenuation. Such a data preprocessing procedure would result in a data vector of size for measurement on one sample spot. Fig. 3The flowchart of data preprocessing to retrieve the spectral data for one measurement location on a sample.  For multiple samples, the data vector was joined to generate a matrix, , each row representing the data vector for one measurement location. 2.3.2.Least squares support vector machinesA milestone of the SVMs algorithm was proposed by Cortes and Vapnik for solving two-group classification problems in 1995.26 In short, the principle can be interpreted as the idea that the observations in the input space are transformed nonlinearly to a high-dimensional feature space, where an optimal linear separating hyperplane (with a maximized distance between the margins) is constructed with the training data to achieve good separation. The kernel trick realizes the nonlinear feature transformation without explicitly computing the feature mapping function, if given the kernels (i.e., inner product of data point pairs in the feature space). Usually, a quadratic optimization problem (QOP) needs to be solved to determine the optimal hyperplane. SVMs have now been developed also for multiclass separation and function estimation (or regression).23 LS-SVM is a simplified and recent derivative version of the standard SVMs,27 which suffer from a major drawback of high-computational burden for the constrained QOP programming.28 Instead of solving a QOP, LS-SVM works with solving linear equations. This makes LS-SVM much faster than the standard SVMs.23,28 In this work, LS-SVM was thus chosen for both regression (quantification of PpIX concentrations and tissue optical properties) and classification of tissue types (optical diagnostics of skin tumors) from the spectroscopic measurements. The readers are referred to the literature elsewhere23,26,27,29 for the details of the theory of SVMs and LS-SVM. For LS-SVM, a Gaussian radial basis function kernel was used. Despite the data matrix containing the spectral observations, there are two additional input parameters needed. They are (1) the kernel parameter, , defining the kernel width, and (2) a regularization parameter, , determining the trade-off between the training error minimization and smoothness. A simplex algorithm was applied to tune and optimize these two model hyperparameters.30 2.3.3.Ambient light rejectionThe ability to suppress any influences from ambient light was tested with intralipid ink phantoms at a fixed PpIX concentration of 100 nM in the laboratory measurements. Light from a halogen lamp (Photonic Optische Geräte GmbH & Co KG, Vienna, Austria; PL2000) was guided by a fiber optic microscope illuminator, composed of an optical fiber bundle with a ring-light-shaped distal end (Photonics Optische Geräte GmbH & Co KG, Vienna, Austria; PL1000) onto the phantom. To obtain various illumination conditions, the position of the ring-light was adjusted up and down above the sample at a distance of maximal 60 cm, while the sample and probe were kept fixed. The fluence rate of the ambient light at the top surface of the phantoms was measured with a Panlux 2 Electronic Lux Meter (Gossen Foto-u. Lichtmesstechnik GmbH). 2.3.4.System quantification calibrationFor quantification of PpIX in intralipid ink phantoms under the test on ambient light rejection, the ninth value in the data vector in Fig. 3 was used, which is a ratio where denotes PpIX fluorescence intensity detected from the 635 nm APD channel, indicating the PpIX fluorescence peak under 405-nm excitation. Correspondingly, the reflectance from the 405-nm channel is denoted by .LS-SVM regression was employed to create three nonlinear models to predict , blood volume fraction (denoted by [Blood]) and PpIX molar concentration (denoted by [PpIX]) in the intralipid blood phantoms. Each model was made from the preprocessed data matrix and a corresponding data column consisting of true values. In the data analysis, 269 phantoms were included and one phantom was excluded because of obvious misoperation. Each prediction model was validated by the twofold cross-validation (CV) methodology: the phantom dataset was split into one subset for calibration (training) and the other one for validation (testing). The correlation coefficient, for the training set, and for the testing set, both percent coefficient of variation (Cov, defined as SD/mean), and the percent error () for each set of predicted quantities were calculated to evaluate the precision of the validation model. 2.3.5.Clinical quantification validationThe signals measured from the skin were preprocessed and the APD signals were temperature calibrated prior to normalization with reflectance. The [PpIX], , and [Blood] for the tissue samples were predicted by three LS-SVM regression models, where all the phantom datasets were used for training with leave-one-out cross-validation (LOOCV), following the procedure described in Sec. 2.3.4. 2.3.6.Clinical tissue classificationThe discrimination between normal tissue and tumor lesion was performed on the clinical data using LS-SVM classification for tissue diagnostic purposes. Here, in the classification model, the tissue type was assigned to logical 1 for tumor lesions and 0 for the surrounding healthy tissue according to the histological diagnosis. The model was trained and tested with LOOCV due to the limited number of measurements in the dataset (44 spots on lesions and 32 on normal tissues). No threshold is needed for LS-SVM since the algorithm provides the discrimination automatically. 3.Results3.1.Optical Properties of PhantomsFor the phantoms with 3% to 8% intralipid, was calculated to be 7.7 to from Eq. (3). From the TOF measurement, was determined to be for 3.75% intralipid and for 0.25% ink or for 3% blood. 3.2.Ambient Light RejectionHow much the performance of the system is affected by the ambient light level is shown in Fig. 4. The raw fluorescence signal in (a) clearly shows increasing levels of disturbance due to the ambient light from the white light lamp for an increased light fluence rate. The light level can be represented by the direct current (DC) level of the fluorescence intensity. The ratio in (b) takes the source power fluctuation into account. For a large variation in the ambient light level (from 15 to ), the ratio in (c) only exhibits a variation of approximately 12%, showing that our probe system is significantly insensitive to the ambient light with a much higher light level than the scenarios from operation lamps. Fig. 4Sensitivity of the fluorophore quantification performance to the ambient light level under the 405-nm excitation, modulated by a TTL pulse at 777 Hz, for a fixed PpIX concentration of 100 nM in an intralipid ink phantom with and at 635 nm. (a) Example of raw fluorescence signals under different ambient light conditions. The sinusoidal pattern of the ambient light can be easily seen for a high lux. For clarity, only signals for a few of the lux levels are shown here. (b) Ratio of the DC level of and DC level of and (c) the ratio of versus the ambient light level with a maximum variation of 12%. Solid line in (b) indicates a linear fit to the data. 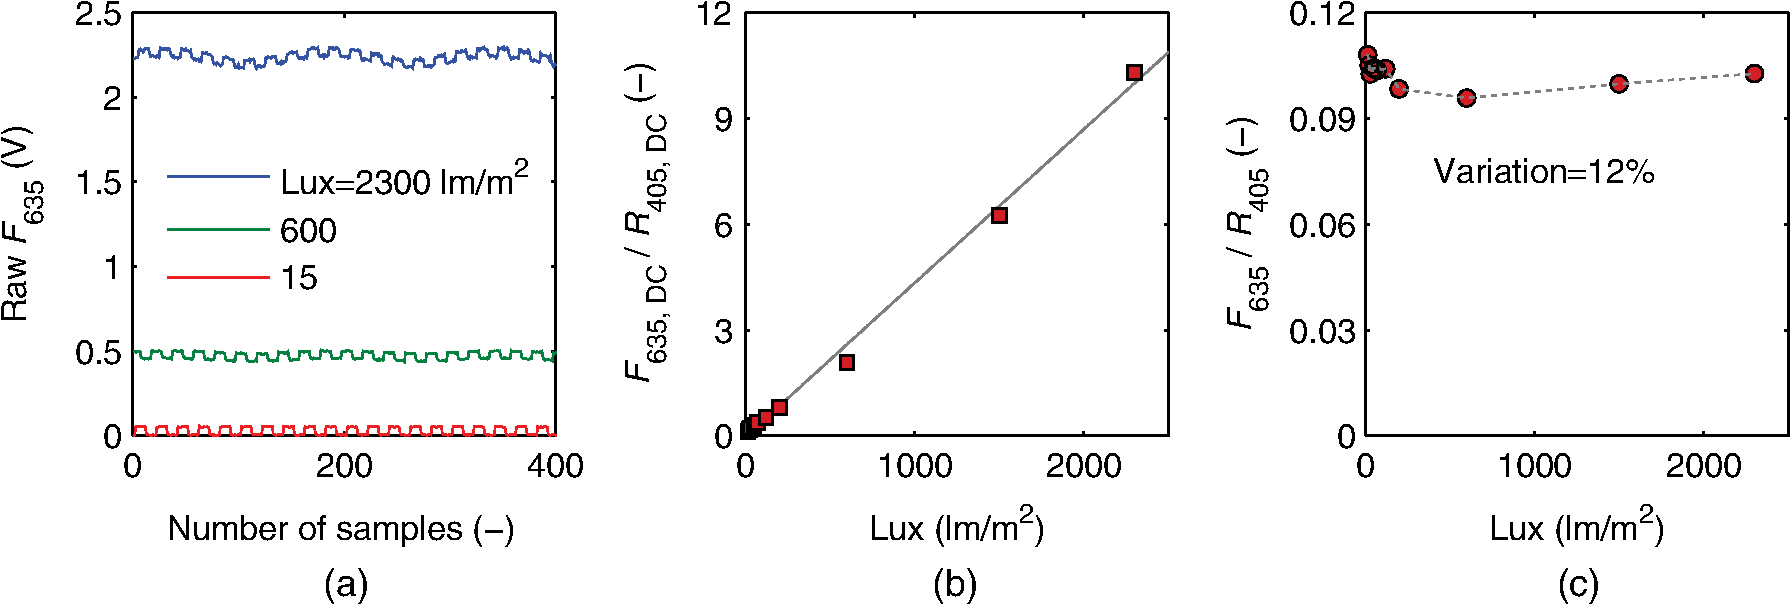 3.3.System Quantification CalibrationThe quantification responses of the LS-SVM regression model with twofold CV to predict , [Blood], and [PpIX] for the phantoms are shown in Fig. 5. The correlation coefficients for the training and testing datasets are calculated to exceed 0.990 and 0.983, respectively. The mean percentage error (mPE) of the predicted values is 3% with a maximum of 4% for and 5% with a maximum of 8% for [blood]. For PpIX, the mPE is 8% for all [PpIX] involved and 5% for relatively high [PpIX] ranging from 400 to 1000 nM. Correspondingly, the mean Cov was calculated to be 3% for , 7% for [Blood], 11% for all [PpIX], and 6% for higher [PpIX]. It indicates in general a very good quantification performance for a large variation of optical properties and low fluorophore concentrations in the nM regime. Fig. 5(a–c) PpIX quantification in intralipid blood phantoms with various optical properties using LS-SVM regression with twofold cross-validation (135 samples for training and 134 samples for validation). The dark solid lines indicate the diagonal of best prediction (coordinates 1:1). and are the correlation coefficients between the true parameter and model response for training and validation, respectively. (d–f) Relative error of the predicted parameters (). The data have not been temperature calibrated because of a long waiting time of prior to measurement.  3.4.Clinical Quantification ValidationUsing the LS-SVM regression model created from the data of the entire phantom dataset, the reduced scattering coefficient at the emission wavelength, blood volume fraction, and PpIX molar concentration of the skin under investigation are shown in Fig. 6. The model predicts in general a higher blood content and higher PpIX concentration for the tumor lesions than the normal skin. The two clusters could be employed to classify tissue types for diagnostic purposes. Fig. 6System quantification validation to predict the scattering coefficient at the emission wavelength, blood content, and fluorophore concentration of the skin from the data measured at the clinic. The LS-SVM model was created and optimized by leave-one-out cross-validation (LOOCV) from 269 phantoms with different amounts of scatters, absorbers, and fluorophores (blue dots). The testing dataset includes measurements of 76 locations in total (44 skin tumor lesions and 32 normal skin). (a) Three-dimensional scatter plots and (b)–(d) are the corresponding two-dimensional projections. The model predicts in general a higher blood content and higher PpIX concentration for the tumor lesions than the normal skin.  3.5.Clinical Tissue ClassificationThe classification responses for discrimination between normal tissue and tumor lesions involved in the clinical study are shown in Fig. 7(a). The LS-SVM model indicates a significant diagnostic capability with 100% accuracy. Figure 7(b) shows an example of fluorescence and reflectance signals at 405-nm excitation for one selected patient. Fig. 7(a) Classification performance of the diagnoses of skin lesions using LS-SVM with LOOCV. The model discriminates successfully in 100% of the cases. (b) As an example, the reflectance signal and the ratio of drug fluorescence peak and reflectance at the 405-nm excitation for one selected patient (Pat 2) are shown. Note that Location 5 has a low normalized fluorescence signal, which might be a result of low blood content (high reflectance) rather than a low PpIX concentration. 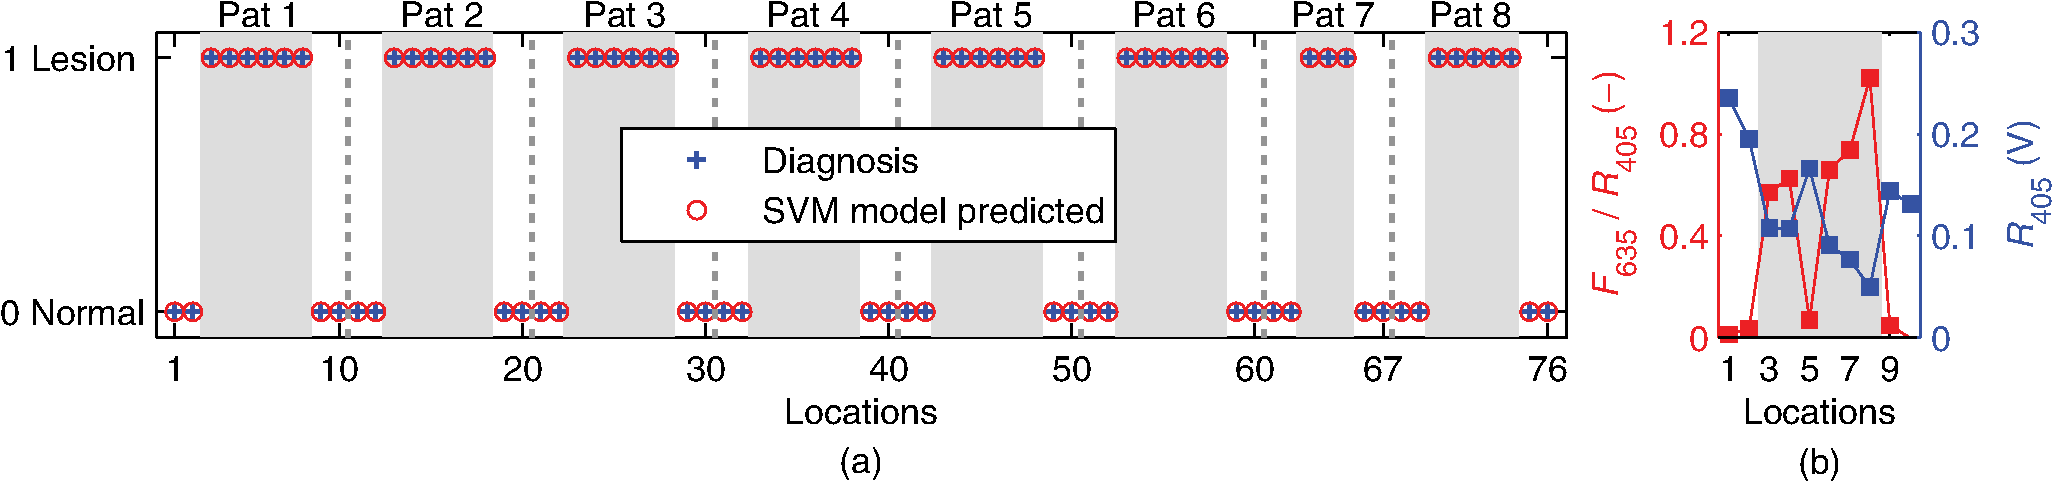 4.DiscussionsOne of the particular benefits of our probe is that it has overcome the challenge for the fluorescence spectroscopy system to be used in the operating theater with strong ambient light always present. In the case of brain tumor resection surgery, the surrounding light sources include fluorescence tubes, surgical lamps, and the high-power surgical microscope.16 The suppression of ambient light of our instrument was achieved by a fast pulse modulation of the excitation source in combination with the detection at the modulation frequency. In this way, the ambient light level is monitored simultaneously and then subtracted from the detected optical signals. This design has two major advantages; first, it significantly improves the signal-to-background ratio in the analyzed signals. A recently published work by Sexton et al. has demonstrated that pulsed excitation light and time-gated detection technique provides superior sensitivity in vivo and can realize fluorescence imaging in room light for FGS.31 However, our system is less expensive, simpler, and safer for the eyes compared to LEDs. The modulation at a kHz frequency regime in our design allows detection of weak fluorescence signal in the presence of strong ambient light up to in our phantom experiments (see Fig. 4). An even higher signal-to-background light ratio could be expected with a faster modulation frequency, which should not be any problem to increase to orders of magnitude in-house, even though this level would be sufficient for clinical use. Second, it does not disturb the standard surgical workflow as the previous design,4,32 as it is necessary neither to employ an umbrella-like cover on the probe shading the tip nor to take a separate background reference measurement. APDs are employed as photodetectors for fluorescence spectroscopy with weak light signals in our system. The APDs possess high light-detection sensitivity (gain ) with high dynamic range as well as fast readout capability [no serial readout from a large charge-coupled device (CCD) chip]. The improved sensitivity of APDs over conventional PDs and spectrometers together with the modulation scheme enables efficient removal of the ambient light, providing an exquisite sensitivity to PpIX fluorescence. In our phantom validation study, PpIX could be precisely quantified on the order of nanomolars in the presence of high scattering and absorption. Such concentrations are far below expected tumor tissue concentrations in clinical scenarios. For example, the absolute PpIX concentration was found to be () in the human high-grade glioma tissue and for grade III brain tumors.33 For ALA-mediated skin PDT, topical application of ALA was reported to result in a PpIX concentration of 1 to 2 μm for various human skin malignancies.34 Due to the high fluorophore sensitivity of our system, it is possible to reduce the ALA dose for intracranial tumor fluorescence purposes (commonly used at body weight21), and thus minimize the adverse side effects in patients undergoing surgery and avoid affecting normal brain. Owing to the higher photosensitivity of APD, it is also possible to reduce the power of the excitation light in order for less fluorophore photobleaching, which could perturb the optical diagnostics. A slight complication with this setup is that APDs suffer from their extremely high sensitivity to temperature (the sensitivity varies typically a couple of percent per degree Celsius). This effect originates from its operation with high reverse bias voltage to achieve desired high photosensitivity. This temperature variation issue has been effectively solved in our system by thermal calibration with compact thermistors rather than direct control of APD temperature. Such a design does not significantly increase the instrument costs and complexities in surgical operation. It is well known that one main challenge of fluorescence-based diagnostic methods comes from varying light attenuation by the tissue. Figure 7(b) shows that the optical properties vary much for different locations, leading to a change in the reflectance at the excitation wavelength. This results in the difficulties in tissue classification using a single excitation wavelength (e.g., see Location 5). In our system, multiple light sources are employed for fluorescence and reflectance spectroscopy. The monitoring of the reflectance is aimed to provide signals to compensate the detected fluorescence signals for tissue optical properties as well as to correct for source power fluctuation by normalizing the APD signals to that from the PD. In the phantom calibration experiments, a wide range of both scattering [ to ] and absorption (0% to 4% blood) have been covered. The results of the multivariate analysis (i.e., nonlinear LS-SVM regression) indicate that despite the large variation in the optical properties, the detected fluorescence signals correlate linearly to the true fluorophore concentrations (see Fig. 5). Both the significantly high correlation coefficient () and the low percent error in the predicted [PpIX] ( for ) show that the LS-SVM regression model works pretty well to accurately predict the fluorophore concentrations in the presence of large optical properties variations. Our results are in general better than those in the literature using fluorescence spectroscopy. The comparisons of the quantification performance for PpIX in tissue phantoms with the other designs reported are summarized in Table 2. Kim et al.35 used a fiber optic probe and an analytical equation derived from the diffusion theory to estimate [PpIX]. They reported a root mean square deviation from mean of 10.1% and a Cov value of 14% at a fixed [PpIX] of (or 8.9 μM). A recently published work by Valdes et al.36 reported a complementary metal–oxide–semiconductor (CMOS) imaging system to measure [PpIX] with a CMOS array. They obtained a mean error of 6% and a Cov of for [PpIX] in the range between 36 nM and 8.9 μM. However, the optical properties of the phantoms vary less than those in our study. Moreover, slight limitations of their study include the priori knowledge of the optical properties at the excitation wavelength and the inherent limitations that certain assumptions had to be made in the diffusion model. Besides the fluorophore concentration, our LS-SVM regression model can also accurately quantify the reduced scattering coefficient and blood content of the media. Figure 5 indicates that our combined fluorescence/reflectance probe, in addition to obtaining the [PpIX] accurately, has also achieved a slightly higher quantification accuracy (relative error for and 4% for [Blood]) than another recently published study based on spatially resolved diffuse reflectance.9 In their study, the mPE of and values was accurate to 4.3% and 5.4%, respectively, when compared with integrating sphere estimates. Table 2Comparison of the quantification performance for PpIX in tissue phantoms in this work and the other designs reported.
Other challenges of the fluorescence technique include its superimposition with tissue autofluorescence and complex tissue structures, which may also aggravate the problem of inaccurate fluorophore quantification and thereby tissue diagnostics. There is apparently no doubt that adequate information should be provided for diagnostics in clinical practice. In our design, 365 and 405 nm can excite tissue autofluorescence which has the potential to provide extra tissue structure information. Meanwhile, the drug fluorescence is superimposed with tissue autofluorescence at the 405-nm excitation wavelength. All the factors mentioned above have been taken into account by the multivariate analysis of the clinical data, where no hypothesis for the light model needs to be made. As shown in Fig. 6, generally very realistic quantification results have been achieved in terms of a higher blood content and higher PpIX concentration for the tumor lesions than the normal skin. The obtained [PpIX] is consistent with the values reported for various human skin malignancies with topically applied ALA.34 Such clusters could be used for tissue classification purposes. However, one location for normal skin was predicted to have a much higher () than the others, which is obviously not likely to be true. In principle, a much larger calibration dataset is required to cover all the possible parameters to be studied in order to improve the quantification performance of the probe for clinical in vivo studies. When the in vivo clinical data from the skin lesions were employed to train the nonlinear LS-SVM model for tissue classification, 100% diagnostic accuracy was obtained, as can be seen in Fig. 7(a). It again indicates complicated nonlinear dependency of the drug fluorescence signal of many other factors rather than only the fluorophore concentration. A similar study on skin basal cell carcinomas by Thompson et al. using fluorescence/diffuse reflectance spectroscopy together with a linear singular value decomposition analysis yielded diagnostic accuracy of 87%.37 Such a comparison suggests the potential of using the probe with multiple sources and nonlinear analysis of the spectral data to aid tissue diagnosis. The results of the clinical data shown in this paper (Figs. 6 and 7) are still somewhat preliminary as the database is still small and under development. A large and representative calibration dataset is a common prerequisite for all multivariate analysis–based methods. The presented results, however, already give a good indication of what might be achievable. Figure 7 indeed shows significant discrimination ability even with the small dataset collected so far. The obtained clusters in Fig. 6, if combined with a proper classification method, could most certainly also provide valuable diagnostic information. Again, the values obtained cannot be considered very accurate though, in this case due to some differences in the tissue phantoms used for the training set and human tissue with different types of tumors used in the evaluation. The identified differences include tissue autofluorescence and blood oxygen saturation (the ratio between oxy- and deoxyhemoglobin concentrations). Therefore, we did not proceed to discriminate tissue type in this study beyond what is presented in Fig. 6, illustrating its potential for quantification of both fluorophore concentration and tissue optical properties. To fully evaluate the potential of the technique, future studies will be based on clinical data for both training and evaluation. Such a study will, in addition, require a much increased set of data to ensure fully representative data. A slight limitation of our instrument is that the delivery fibers for different light sources at the fiber probe tip are aligned in a circle with a diameter of approximately 2.3 mm. This means that the interrogation volume is not exactly the same for each light source. In case of inhomogeneous tissue, especially tumors of small size and irregular tissue structure, it would lead to an inaccurate quantification of fluorophores and thus wrong optical diagnosis. In future clinical studies, it would be good to replace the current probe with dual fibers at the probe tip in order to minimize the probe volume. From a light source perspective, there might be other reasons for the quantification error in our probe system. A white LED is employed to measure the diffuse reflectance at wavelengths of interest, in order to compensate for tissue optical properties. Despite the detection bands at 405, 530, and 635 nm, one of the other two bands at 470 nm allows to monitor a strong tissue autofluorescence following 365-nm excitation, while 660 nm provides a possibility to monitor photobleaching of porphyrins through the photoproducts. In fact, the white LED consists of a blue LED peaked at 470 nm with a Ce:YAG crystal in front, emitting broadband yellow light from 500 to 700 nm. It is possible that this elastic light tail toward long wavelengths leaks into the fluorescence bands. To minimize such leakage, the white LED should have a short-pass filter, e.g., UG1 or UG11. In addition, the fluorescence of the Ce:YAG crystal is extremely efficient and sometimes not negligible. Therefore, when the 365- and 405-nm LEDs are lit up, the elastic violet light will scatter into both the collection fiber and the fiber connecting the white LED. The latter could convert to yellow light by the crystal, travel back to the tissue sample, and then superimpose on the tissue and drug fluorescence. Ideally this potential issue could be solved in the future by equipping the white LED with a long-pass GG475 filter. Further improvements could be made to explore the diagnostic potential of the probe system. An electric high-pass alternating current (AC) filter could be added in each transimpedance amplifier, making the system blind to the DC signal level prior to the analog-to-digital conversion in the DAQ board. This would thus take use of the full dynamic range of the DAQ without saturating the detector for high signal levels. Furthermore, the green and red LEDs could be easily replaced with additional excitation bands (e.g., at 445 nm) to evaluate the effects of tissue oxygenation over the UV–visible spectrum38 and/or acquire multiexcitation fluorescence in order to form a two-dimensional excitation emission matrix.39 It has the potential to improve cancer diagnostics by providing absorption and fluorescence characteristics of normal and abnormal tissues.39,40 Point measurements are usually time consuming. However, the probe presented in this work is not intended for tumor delineation for the entire tumor border, especially in open brain surgery. It is instead meant to be used in combination with other systems, for instance, an intraoperative ultrasonic navigation system and fluorescence surgical microscope.5 This is to say, it is meant as a complement to microscopy to check only those uncertain sites which emit very weak fluorescence signals from the tumor tissue (often invisible to the surgeon’s eyes). In conclusion, we present a fiber optic probe instrument with fluorescence/reflectance spectroscopy for therapy guidance and monitoring. It is meant as a complement to the state-of-the-art neurosurgical fluorescence microscopy for FGS of brain tumor using 5-ALA–induced PpIX as a fluorescence contrast agent. The probe is clinically adapted to minimize the disruption of the standard surgical workflow. Multiple sources using LEDs with fast pulse modulation and detection of the signal strength only at the modulation frequency enable precise quantification of the fluorophore concentration, tissue optical properties, and ambient light suppression. We have shown that the probe system is insensitive to strong ambient light up to . Validation measurements of tissue phantoms using LS-SVM regression demonstrate that even with large variations in phantom optical properties, a low quantification error of has been obtained for PpIX concentration ranging from 400 to 1000 nM, which is far below the concentration in the high-grade human brain tissue samples. The LS-SVM classification model yields 100% diagnostic accuracy for in vivo skin tumors with topically applied ALA. In principle, the probe is generic to quantify fluorophores other than PpIX in many tissue types. AcknowledgmentsThe authors gratefully acknowledge Professor Karin Wårdell, Dr. Neda Haj-Hosseini, and M.D. Johan Richter for the critically important discussions on the clinical adaptions. We also thank Sören Johansson and Alfi Shaharin for conducting the TOF measurements of tissue phantoms. We also thank Professor Katarina Svanberg for her valuable discussions and Åke Johansson for his advice and efforts on the electronic components. This work was supported by the Swedish Foundation for Strategic Research (SSF), the Swedish Research Council (VR), the Swedish Governmental Agency for Innovation Systems (Vinnova) under Grant No. 331-2006-7661, a Linnaeus Research Grant to the Lund Laser Center, LaserLab Europe JRA project Biopthical (Contract No. EC-GA 284464), and Elekta AB, Stockholm, Sweden. ReferencesU. UtzingerR. R. Richards-Kortum,
“Fiber optic probes for biomedical optical spectroscopy,”
J. Biomed. Opt., 8
(1), 121
–147
(2003). http://dx.doi.org/10.1117/1.1528207 JBOPFO 1083-3668 Google Scholar
S. Andersson-Engelset al.,
“Clinical recording of laser-induced fluorescence spectra for evaluation of tumour demarcation feasibility in selected clinical specialities,”
Lasers Med. Sci., 6
(4), 415
–424
(1991). http://dx.doi.org/10.1007/BF02042464 LMSCEZ 1435-604X Google Scholar
C. af Klinteberget al.,
“Compact medical fluorosensor for minimally invasive tissue characterization,”
Rev. Sci. Instrum., 76
(3), 034303
(2005). http://dx.doi.org/10.1063/1.1867569 RSINAK 0034-6748 Google Scholar
N. Haj-Hosseiniet al.,
“Optical touch pointer for fluorescence guided glioblastoma resection using 5-aminolevulinic acid,”
Laser Surg. Med., 42
(1), 9
–14
(2010). http://dx.doi.org/10.1002/lsm.v42:1 LSMEDI 0196-8092 Google Scholar
J. C. Richteret al.,
“Fluorescence spectroscopy measurements in ultrasonic navigated resection of malignant brain tumors,”
Laser Surg. Med., 43
(1), 8
–14
(2011). http://dx.doi.org/10.1002/lsm.v43.1 LSMEDI 0196-8092 Google Scholar
P. A. Valdeset al.,
“Combined fluorescence and reflectance spectroscopy for in vivo quantification of cancer biomarkers in low- and high-grade glioma surgery,”
J. Biomed. Opt., 16
(11), 116007
(2011). http://dx.doi.org/10.1117/1.3646916 JBOPFO 1083-3668 Google Scholar
D. J. Capponet al.,
“Fiber-optic probe design and optical property recovery algorithm for optical biopsy of brain tissue,”
J. Biomed. Opt., 18
(10), 107004
(2013). http://dx.doi.org/10.1117/1.JBO.18.10.107004 JBOPFO 1083-3668 Google Scholar
T. M. BaranM. C. FennT. H. Foster,
“Determination of optical properties by interstitial white light spectroscopy using a custom fiber optic probe,”
J. Biomed. Opt., 18
(10), 107007
(2013). http://dx.doi.org/10.1117/1.JBO.18.10.107007 JBOPFO 1083-3668 Google Scholar
A. Kimet al.,
“A fiberoptic reflectance probe with multiple source-collector separations to increase the dynamic range of derived tissue optical absorption and scattering coefficients,”
Opt. Express, 18
(6), 5580
–5594
(2010). http://dx.doi.org/10.1364/OE.18.005580 OPEXFF 1094-4087 Google Scholar
J. Swartlinget al.,
“System for interstitial photodynamic therapy with online dosimetry: first clinical experiences of prostate cancer,”
J. Biomed. Opt., 15
(5), 058003
(2010). http://dx.doi.org/10.1117/1.3495720 JBOPFO 1083-3668 Google Scholar
S. C. Kanicket al.,
“Integration of single-fiber reflectance spectroscopy into ultrasound-guided endoscopic lung cancer staging of mediastinal lymph nodes,”
J. Biomed. Opt., 15
(1), 017004
(2010). http://dx.doi.org/10.1117/1.3290822 JBOPFO 1083-3668 Google Scholar
V. R. Sauvageet al.,
“Multi-excitation fluorescence spectroscopy for analysis of non-alcoholic fatty liver disease,”
Laser Surg. Med., 43
(5), 392
–400
(2011). http://dx.doi.org/10.1002/lsm.v43.5 LSMEDI 0196-8092 Google Scholar
M. R. Austwicket al.,
“Scanning elastic scattering spectroscopy detects metastatic breast cancer in sentinel lymph nodes,”
J. Biomed. Opt., 15
(4), 047001
(2010). http://dx.doi.org/10.1117/1.3463005 JBOPFO 1083-3668 Google Scholar
G. M. Palmeret al.,
“Monte Carlo-based inverse model for calculating tissue optical properties. Part II: application to breast cancer diagnosis,”
Appl. Opt., 45
(5), 1072
–1078
(2006). http://dx.doi.org/10.1364/AO.45.001072 APOPAI 0003-6935 Google Scholar
G. M. Palmeret al.,
“Quantitative diffuse reflectance and fluorescence spectroscopy: tool to monitor tumor physiology in vivo,”
J. Biomed. Opt., 14
(2), 024010
(2009). http://dx.doi.org/10.1117/1.3103586 JBOPFO 1083-3668 Google Scholar
M. Brydegaardet al.,
“Photobleaching-insensitive fluorescence diagnostics in skin and brain tissue,”
IEEE Photonics J., 3
(3), 407
–421
(2011). http://dx.doi.org/10.1109/JPHOT.2011.2141656 1943-0655 Google Scholar
P. A. Valdeset al.,
“Quantitative fluorescence in intracranial tumor: implications for ala-induced ppix as an intraoperative biomarker,”
J. Neurosurg., 115
(1), 11
–17
(2011). http://dx.doi.org/10.3171/2011.2.JNS101451 JONSAC 0022-3085 Google Scholar
B. Kruijtet al.,
“In vivo quantification of chromophore concentration using fluorescence differential path length spectroscopy,”
J. Biomed. Opt., 14
(3), 034022
(2009). http://dx.doi.org/10.1117/1.3149862 JBOPFO 1083-3668 Google Scholar
B. W. Pogueet al.,
“Review of neurosurgical fluorescence imaging methodologies,”
IEEE J. Sel. Top. Quantum Electron., 16
(3), 493
–505
(2010). http://dx.doi.org/10.1109/JSTQE.2009.2034541 IJSQEN 1077-260X Google Scholar
M. Heftiet al.,
“Fluorescence-guided surgery for malignant glioma: a review on aminolevulinic acid induced protoporphyrin IX photodynamic diagnostic in brain tumors,”
Curr. Med. Imaging Rev., 6
(4), 254
–258
(2010). http://dx.doi.org/10.2174/157340510793205503 CMIRCV 1573-4056 Google Scholar
M. J. ColditzK. V. LeyenR. L. Jeffree,
“Aminolevulinic acid (ALA)-protoporphyrin IX fluorescence guided tumour resection. Part 2: theoretical, biochemical and practical aspects,”
J. Clin. Neurosci., 19
(12), 1611
–1616
(2012). http://dx.doi.org/10.1016/j.jocn.2012.03.013 JCNUE6 0967-5868 Google Scholar
W. Stummeret al.,
“Fluorescence-guided resection of glioblastoma multiforme by using 5-aminolevulinic acid-induced porphyrins: a prospective study in 52 consecutive patients,”
J. Neurosurg., 93
(6), 1003
–1013
(2000). http://dx.doi.org/10.3171/jns.2000.93.6.1003 JONSAC 0022-3085 Google Scholar
K. Pelckmanset al.,
“LS-SVMlab: LS-SVMlab: a MATLAB/C toolbox for Least Squares Support Vector Machines,”
(2011) http://www.esat.kuleuven.be/sista/lssvmlab/ August 2011). Google Scholar
S. T. Flocket al.,
“Optical properties of intralipid: a phantom medium for light propagation studies,”
Laser Surg. Med., 12
(5), 510
–519
(1992). http://dx.doi.org/10.1002/(ISSN)1096-9101 LSMEDI 0196-8092 Google Scholar
E. AlerstamS. Andersson-EngelsT. Svensson,
“White Monte Carlo for time-resolved photon migration,”
J. Biomed. Opt., 13
(4), 041304
(2008). http://dx.doi.org/10.1117/1.2950319 JBOPFO 1083-3668 Google Scholar
C. CortesV. Vapnik,
“Support-vector networks,”
Mach. Learn., 20 273
–297
(1995). http://dx.doi.org/10.1023/A:1022627411411 MALEEZ 0885-6125 Google Scholar
J. A. K. SuykensT. Van GestelJ. De Brabanter, Least Squares Support Vector Machines, World Scientific, Singapore
(2002). Google Scholar
H. WangD. Hu,
“Comparison of SVM and LS-SVM for regression,”
in IEEE Int. Conf. Neural Networks Brain,
279
–283
(2005). http://dx.doi.org/10.1109/ICNNB.2005.1614615 Google Scholar
V. N. Vapnik, Statistical Learning Theory, 1st ed.Wiley, New York
(1998). Google Scholar
K. De BrabanterJ. SuykensB. De Moor,
“Nonparametric regression via StatLSSVM,”
J. Stat. Software, 55
(2), 1
–21
(2013). JSSOBK 1548-7660 Google Scholar
K. Sextonet al.,
“Pulsed-light imaging for fluorescence guided surgery under normal room lighting,”
Opt. Lett., 38
(17), 3249
–3252
(2013). http://dx.doi.org/10.1364/OL.38.003249 OPLEDP 0146-9592 Google Scholar
M. A. Iliaset al.,
“Evaluation of a fiber-optic fluorescence spectroscopy system to assist neurosurgical tumor resections,”
Proc. SPIE, 6631 66310W
(2007). http://dx.doi.org/10.1117/12.728546 PSISDG 0277-786X Google Scholar
A. Johanssonet al.,
“5-aminolevulinic acid-induced protoporphyrin IX levels in tissue of human malignant brain tumors,”
Photochem. Photobiol., 86
(6), 1373
–1378
(2010). http://dx.doi.org/10.1111/php.2010.86.issue-6 PHCBAP 0031-8655 Google Scholar
C. Fritschet al.,
“Optimum porphyrin accumulation in epithelial skin tumours and psoriatic lesions after topical application of delta-aminolaevulinic acid,”
Br. J. Cancer, 79
(9–10), 1603
–1608
(1999). http://dx.doi.org/10.1038/sj.bjc.6690255 BJCAAI 0007-0920 Google Scholar
A. Kimet al.,
“Quantification of in vivo fluorescence decoupled from the effects of tissue optical properties using fiber-optic spectroscopy measurements,”
J. Biomed. Opt., 15
(6), 067006
(2010). http://dx.doi.org/10.1117/1.3523616 JBOPFO 1083-3668 Google Scholar
P. A. Valdeset al.,
“System and methods for wide-field quantitative fluorescence imaging during neurosurgery,”
Opt. Lett., 38
(15), 2786
–2788
(2013). http://dx.doi.org/10.1364/OL.38.002786 OPLEDP 0146-9592 Google Scholar
A. J. Thompsonet al.,
“In vivo measurements of diffuse reflectance and time-resolved autofluorescence emission spectra of basal cell carcinomas,”
J. Biophotonics, 5
(3), 240
–254
(2012). http://dx.doi.org/10.1002/jbio.201100126 JBOIBX 1864-063X Google Scholar
G. M. Palmeret al.,
“Optimal methods for fluorescence and diffuse reflectance measurements of tissue biopsy samples,”
Laser Surg. Med., 30
(3), 191
–200
(2002). http://dx.doi.org/10.1002/(ISSN)1096-9101 LSMEDI 0196-8092 Google Scholar
M. Brydegaardet al.,
“Versatile multispectral microscope based on light emitting diodes,”
Rev. Sci. Instrum., 82
(12), 123106
(2011). http://dx.doi.org/10.1063/1.3660810 RSINAK 0034-6748 Google Scholar
R. A. Zângaroet al.,
“Rapid multiexcitation fluorescence spectroscopy system for in vivo tissue diagnosis,”
Appl. Opt., 35 5211
–5219
(251996). http://dx.doi.org/10.1364/AO.35.005211 APOPAI 0003-6935 Google Scholar
BiographyHaiyan Xie is currently a PhD student in the biophotonics group at the Department of Physics, Lund University, Lund, Sweden. Her research interests include development of optical spectroscopy and multispectral imaging systems for cancer diagnostics. Zhiyuan Xie got her master’s degree from the Department of Physics, Lund University, in 2013. The majority of this work was performed during her diploma work at the biophotonics group. Monirehalsadat Mousavi obtained her master’s degree from Lund University in 2013. She is currently a PhD student under the supervision of professor Stefan Andersson Engels. Her research is focused on using upconverting nanoparticles for diffuse optical imaging of turbid media. Niels Bendsoe received his PhD degree in medical science, dermatology, and venereology in 2003 and became an associate professor at the Department of Dermatology at Skåne University Hospital in 2012. He has been working at the Dermatology Clinic, Lund University Hospital, since 1981 and is the chief consulting dermatologist. He has been involved in the development of photodynamic therapy and tumor detection both in experimental studies as well as in the clinic. He is a board member in the Lund University Medical Laser Centre. Mikkel Brydegaard received his master’s degree in electrical engineering in 2007 and doctorate at atomic physics from Lund University in 2013. Since 2001, he persistently worked in developing countries developing realistic instrumentation for applied optical spectroscopy. During doctoral studies he specialized in broadband biomedical fluorescence and interpretation with multivariate and chemometrics. Recently, he has worked part time with laser radar diagnostics of atmospheric fauna at Lund University and part time with hyperspectral imaging at Norsk Elektro Optikk. Johan Axelsson received his PhD in atomic physics in 2010 from the Department of Physics, Lund University. He is currently a research associate in the biophotonics group at Atomic Physics, Lund University. His research focuses on biomedical optics, medical imaging, optical tomography, and Cerenkov emission imaging with applications in radiation treatment monitoring. Stefan Andersson-Engels received his MSc and PhD degrees in engineering physics and physics from Lund University in 1985 and 1990, respectively. He was a postdoctoral at McMasters University in Canada from 1990 to 1991. He has since been at Lund University and became a full professor in 1999. He is presently the director of Lund University Medical Laser Centre and the deputy head of the Atomic Physics Division at Lund University. His research interest includes tissue optics as well as applications of light in biomedical diagnostics and treatments. |
|||||||||||||||||||||||||||||||||||||||||||||||||||||||||||||||||||||||||||||||