
|
|
1.IntroductionNative fluorescence spectroscopy has been widely considered to characterize the metabolic and pathological conditions of cells and tissues.1 It has been reported that photophysical characteristics of many intrinsic fluorophores may be altered during the functional, morphological, and microenvironmental changes in cells and tissues. For example, the native fluorescence of collagen, elastin, and, more generally, proteins is related to the structural arrangement of cells and tissues. On the other hand, the native fluorescence from pyridoxine derivatives, reduced form of nicotinamide adenine dinucleotide, flavin, porphyrin, and pteridine and its derivatives are related to metabolic changes.2,3 Based on the report of Alfano and his group on the detection of dental carries and subsequently cancer using native fluorescence, the field of optical biopsy has been given importance in diagnostic oncology.4,5 In this context, many reported on the characterization and discrimination of various neoplastic conditions of cells and tissues from their healthy counterpart using steady-state native fluorescence spectroscopy.6–10 However, only limited studies are available on the characterization of biofluids using native fluorescence spectroscopy in diagnostic oncology.11–17 Among various biofluids, urine is considered to be one of the diagnostically important biological fluids, as it has many metabolites, where number of them are native fluorophores.18 Studies reported that there is a considerable variation in the concentration and conformation of some of the metabolites due to food intake and due to some altered metabolic and pathological conditions.19,20 Among various native fluorophores, pteridine and its derivatives, such as xanthopterin, isoxanthopterin, neopterin, biopterin, pterin, and pterin-6-carboxylic acid, are considered as important cofactors during cellular metabolism.3 The distribution of pteridine and its derivatives may change when the monocytes and macrophages are activated under interferon- stimulus by cancer, viral infection, and renal diseases.3 On the other hand, it has also been reported that indoxyl sulfate, a metabolite of tryptophan, has also been released in the urine.20–22 As distribution of these fluorophores may be altered in urine under different pathological and metabolic alterations, determination of these metabolites were carried out using various tedious techniques, such as high-performance liquid chromatography (HPLC), capillary electrophoresis, and radioimmunoassay.23–25 For rapid characterization, native fluorescence spectroscopic techniques have been considered in the characterization of urine under different diseased conditions.3,26,27 However, no detailed report on the characterization of indoxyl sulfate and neopterin in urine in the discrimination of cervical cancer patients from healthy subjects using simple native fluorescence emission spectroscopy was available. In this context, the present work is aimed to study the steady-state and time-resolved native fluorescence spectroscopy in the characterization of indoxyl sulfate and pteridine derivatives present in the urine of healthy subjects and cervical cancer patients and to verify their diagnostic potentiality in the discrimination of cervical cancer patients from that of healthy subjects. 2.Materials and Methods2.1.SamplesFirst, voided morning urine samples were collected in a sterile container from cancerous patients of different etiologies and stages who are admitted for treatment in hospitals in Chennai and from healthy volunteers. Samples were collected from a total of 60 healthy subjects in the age group of 20 to 60 years and 50 pathologically confirmed cervical cancer patients in the age group of 20 to 65 years. Both the groups were free from other abnormalities, like diabetes, jaundice, and bacterial infections. The urine samples were stored in the refrigerator at 4°C and were examined as such within 48 h from the time of collection, after thawing it to room temperature. 2.2.ChemicalsNeopterin, indoxyl sulfate, and riboflavin were obtained from Sigma-Aldrich Co. (St. Louis, MO). Stock solutions were prepared using phosphate-buffered saline and were used as standards of fluorescence analysis. 2.3.Native Fluorescence Spectroscopic Measurements of Urine SamplesThe raw urine samples without any preprocess were taken in a four-sided polished quartz cuvette. The steady-state native fluorescence emission spectra of the urine samples were obtained using a commercially available spectrofluorometer (Fluoromax- 2 SPEX, Edison, New Jersey) by exciting them at 280 and 350 nm and fixing the excitation and emission slit width as 5 nm. The excitation source (150 W ozone-free xenon arc lamp) coupled to the monochromator delivers light to the sample spot at a desired wavelength, and the fluorescence emission from the urine is collected by another monochromator connected to a photomultiplier tube (PMT) (R928P, Hamamatzu, Shizuoka-Ken, Japan). The gratings in the excitation and emission monochromators have a groove density of and are blazed at 330 and 500 nm, respectively. The collected signal is transferred to the PC through an RS232 interface. The data were processed by a Windows-based data acquisition program—DataMax software powered by GRAMS/386.28 The acquisition interval and the integration time were maintained as 1 nm and 0.1 s, respectively. 2.4.Time-Resolved Spectroscopic Measurements of Urine SamplesLifetime measurements of the raw urine samples were measured using time-correlated single photon counting system (TCSPC, Horiba Jobin Yuvon IBH, United Kingdom) by exciting the samples using 280 and 310 nm nano light-emitting diode source (Horiba Jobin Yuvon IBH, United Kingdom, pulse width ) with a fast response red sensitive PMT (Hamamatsu Photonics, Japan) detector. The corresponding fluorescence decay was measured at 390 and 440 nm, respectively. The repetition rate was maintained as 1 MHz. The instrument response function (prompt) was obtained using a Rayleigh scatter of Ludox-40 (40 wt. % suspension in water; Sigma-Aldrich) in a quartz cuvette at 280- and 310-nm excitation. Decay analysis software (DAS6 v6.0, Horiba) was used to extract the lifetime components. The goodness of fit was judged by chi-sqaure values. 2.5.Statistical AnalysisA detailed statistical analysis of the native fluorescence emission spectra at 280- and 350-nm excitation were carried out, which includes the following steps: (1) normalization of each fluorescence spectrum, (2) identification of characteristic spectral features of each experimental group and introduction of different ratio parameters followed by a student’s t test to find the level of significance to select the ratio parameters, and (3) classification by stepwise multiple linear discriminant analysis using SPSS/PC+ 17 software. The method of the statistical analysis was discussed in detail in our earlier works.28,29 Further, to check the statistical difference between healthy and diseased group based on lifetime components at 280- and 310-nm excitations, mean lifetime (), individual lifetime values ( and ), amplitudes ( and ), and ratio between amplitudes () and lifetime values () were subjected to student’s t test and the significant values were included in the analysis. As the present study is aimed to discriminate the cervical cancer subjects from the healthy subjects, the analysis was performed across 60 healthy subjects and 50 patients with cervical cancer. 3.Results3.1.Steady-State Native Fluorescence Characteristics of Urine Samples at 280- and 350-nm ExcitationFigures 1(a) and 1(b) show the averaged and normalized fluorescence emission spectra of urine of both healthy and cancer subjects, respectively, at 280-nm excitation. From Fig. 1(a), it is observed that emission maximum centered at 428 nm for cancer subjects and at 401 nm for the healthy subjects. In addition to the primary peak, the urine samples of cancer patients exhibited a hump at 515 nm and the same was absent in the spectra of healthy subjects. Also, overall emission intensity of urine of cancer patients was thrice the value of healthy subjects. Further, from the fluorescence emission spectra of Fig. 1(b), a 27-nm shift was observed between the healthy subjects and the cancer subjects. From the difference spectrum of Fig. 1(b), it is observed that the difference is positive in wavelength region lesser than the isosbestic point (418 nm) and negative at wavelengths higher than the isosbestic point. The full width at half maximum (FWHM) value for cancer samples is 159 nm and that for healthy samples is 111 nm. Fig. 1Averaged fluorescence emission spectra of urine of 60 healthy subjects and 50 patients with cervical cancer at 280-nm excitation. (a) Absolute spectra and (b) normalized spectra with the difference between healthy subjects and cervical cancer patients.  Figures 2(a) and 2(b) show the averaged and normalized fluorescence emission spectra of urine samples of both healthy and cancer subjects at 350-nm excitation. From Fig. 2(a), it is observed that the urine samples of both healthy and cancer subjects exhibit a prominent maximum at 430; however, the fluorescence intensity was higher for healthy subjects when compared to that of cancer subjects. In addition to the prominent maxima, the cancer subjects show a shoulder around 515 nm, which is absent in the case of healthy subjects. Fig. 2Averaged fluorescence emission spectra of urine of 60 healthy subjects and 50 patients with cervical cancer at 350-nm excitation. (a) Absolute spectra and (b) normalized spectra with the difference between healthy subjects and cervical cancer patients.  From Fig. 2(b), it is observed that the difference between healthy subjects and cancer patients reads negative in the wavelength region greater than the isosbestic point (480 nm). Also, it is observed that the FWHM for the healthy subjects is 99 nm and that for cancer patients is 135 nm. 3.2.Fluorescence Emission Spectrum of Standard FluorophoresIn order to confirm the origin of the observed peaks from the urine samples of healthy subjects and cancer patients and assign them to various fluorophores, fluorescence emission spectrum was measured for the standard fluorophores indoxyl sulfate, neopterin, and riboflavin obtained from Sigma-Aldrich Co. Figure 3 shows the normalized fluorescence emission spectrum of the standard fluorophores. From the spectrum of the standard fluorophores, it is observed that the fluorophores indoxyl sulfate, neopterin, and riboflavin have prominent maximum at 387, 445, and 533 nm, respectively. Also, an FWHM of 80 nm was observed for indoxyl sulfate, 108 nm for neopterin, and 110 nm for riboflavin. 3.3.Time-Resolved Fluorescence Characteristics of Urine Samples at 280- and 310-nm Excitation, RespectivelyAs there was a considerable spectral difference between the fluorescence emission intensity and spectral profile of healthy and cervical cancer subjects, the time-resolved fluorescence spectroscopic characterization of urine was also carried out. Figures 4(a) and 4(b) show the typical decay profile of standard fluorophore indoxyl sulfate and urine samples of healthy subjects and cancer patients, respectively. Figure 5(a) shows the typical decay profile of standard fluorophore neopterin, and Fig. 5(b) shows the decay profiles of urine of healthy and cancer subjects for emission at 440 nm. From Table 1, it is observed that bi-exponential fits well to characterize the decay profile of the urine samples and standard fluorophore at 390-nm emission. For decay at 440-nm emission, bi-exponential fits are probable, whereas few cases fitted well with tri-exponential. Also, it is observed that the standard fluorophore exhibits a bi-exponential decay at 440-nm emission. The goodness of fit was judged by chi-square value. Here the chi-square value ranges between 0.99 and 1.3. Fig. 4Typical decay profile of samples measured at 390-nm emission for 280-nm excitation: (a) indoxyl sulfate and (b) urine of healthy and cervical cancer subjects.  Fig. 5Typical decay profile of samples measured at 440-nm emission: (a) neopterin and (b) urine of healthy and cervical cancer subjects. 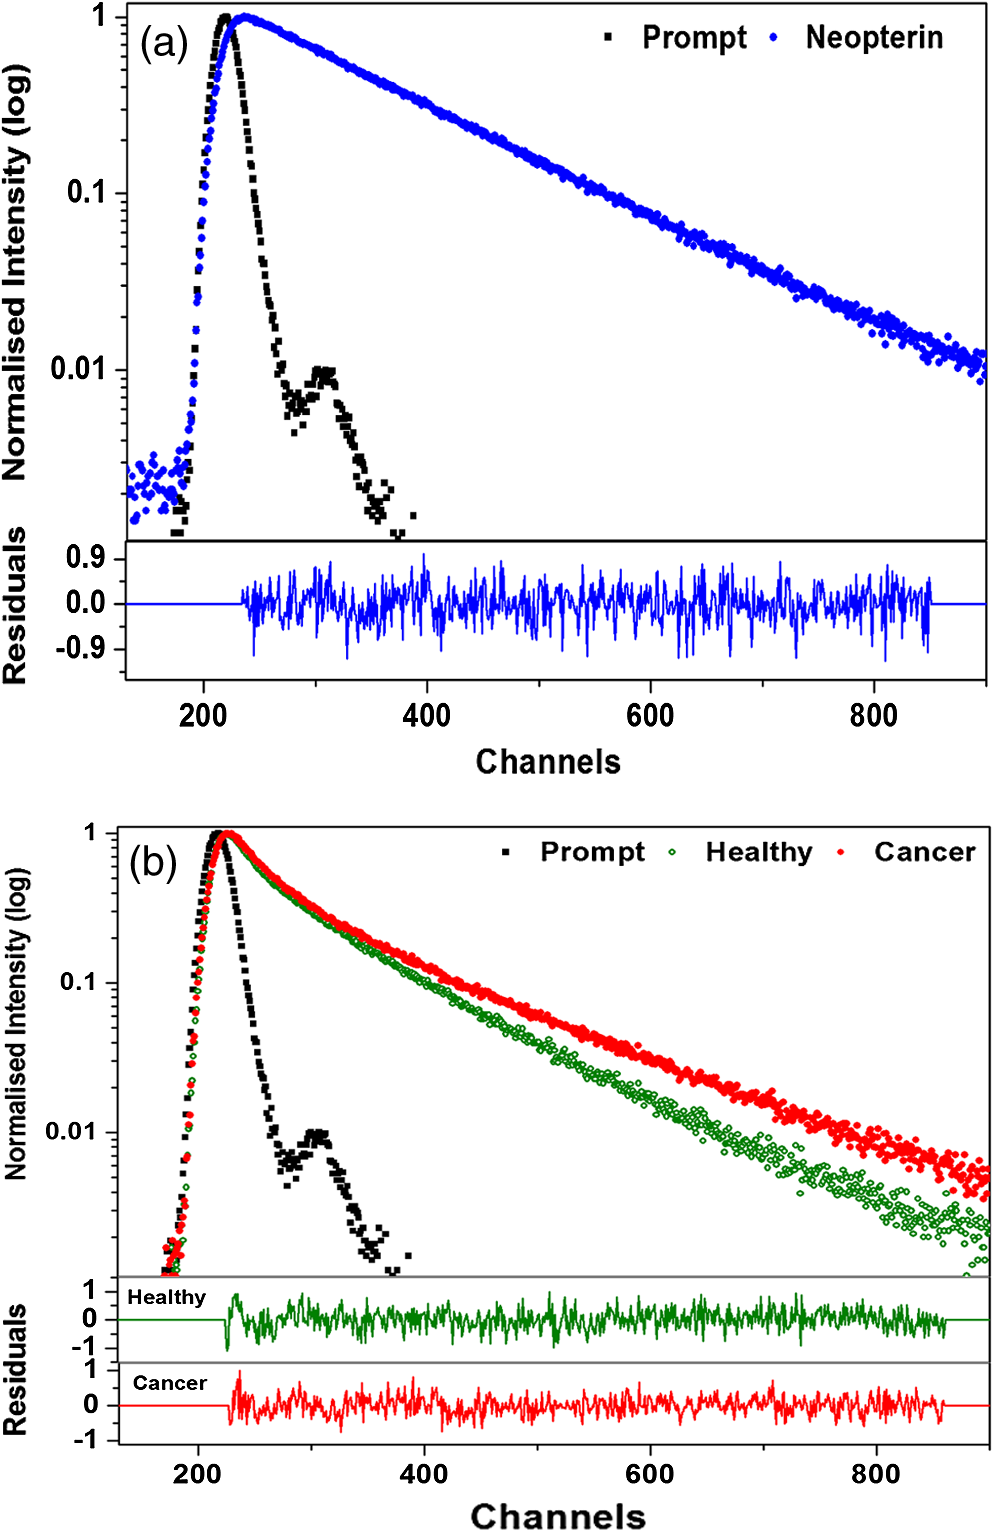 Table 1The average lifetime components and their relative amplitudes.
The average lifetime for the decay at 390 nm for the urine samples of healthy subjects is 5.82 ns and that for cervical cancer samples is 5.77 ns, whereas in the case of standard fluorophore indoxyl sulfate, it is 2.63 ns, which is much lower than that of the urine samples under study. For the bi-exponential decay at 440 nm, the average lifetime of urine samples of healthy subjects was 5.96 ns and that of cancer samples was 4.91 ns, whereas for samples with tri-exponential decay at 440 nm, the average lifetime of urine of healthy subjects was 5.74 ns and that of cancer subjects was 4.12 ns. The standard fluorophore neopterin exhibited a bi-exponential decay, and the average lifetime was found to be 5.74 ns. 3.4.Results of Discriminant AnalysisTo quantify the observed spectral differences between healthy and cancerous subjects, the fluorescence spectral data were subjected to stepwise linear discriminant analysis to analyze the statistical significance of the healthy subjects and cancer patients. Nine ratio parameters were calculated from the fluorescence intensity at 280-nm excitation and eight ratio parameters from the emission spectra at 350-nm excitation. The mean with standard deviation and the significance ( values) of these ratio variables for healthy and diseased group of samples studied are given in Table 2. The values of all the ratio variables are , indicating a very high statistical significance. The stepwise linear discriminant analysis resulted in two canonical discriminant functions—DF1 and DF2—for the emission spectra at 280- and 350-nm excitation, respectively. Figure 6 shows the scatter plot of the discrimination function for spectral data at 280- and 350-nm excitation. Table 2Mean values (±SD) and level of significance (p) of the ratio parameters used for statistical analysis.
Fig. 6Scatter plot showing the distribution of DF1 and DF2 for healthy [•] and cancer [○] subjects at 280-nm and 350-nm excitation, respectively.  The stepwise method compares the potential of each variable in the discrimination and those variables that gave better discrimination over other variables were taken for analysis. Hence, it is evident from the above expression for canonical discriminant function DF1 at 280-nm excitation that out of nine ratio parameters, only two parameters are significant, and from DF2, it is observed that three out of eight ratio variables are significant and only these parameters were included in the linear discriminant analysis in discriminating the cancer subjects from the healthy subjects. Table 3 shows the mean with standard deviation and the values of the lifetime components, which are found to be significant under student’s t test and were included in the analysis. The stepwise linear discriminant analysis resulted in two canonical discriminant functions DF3 and DF4 for the decay at 390 and 440 nm, respectively. Figure 7 shows the scatter plot of the canonical discriminant functions DF3 and DF4 at 280- and 310-nm excitation, respectively. Table 3Mean values (±SD) and level of significance (P) of the lifetime components used for statistical analysis.
Fig. 7Scatter plot showing the distribution of DF3 and DF4 for healthy [•] and cancer [○] subjects at 280-nm and 310-nm excitation, respectively.  From DF3, it is evident that the ratio between the amplitude components turns to be significant, and from DF4, it is observed that the mean lifetime and amplitude turns to be significant and were used in the discrimination of cancer subjects from healthy subjects. 4.DiscussionInspite of tremendous development in diagnosis and treatment modalities, cancer remains a menace for the public. Hence, early diagnosis of cancer in its primitive state may help in the reduction of the rate of morbidity and mortality. Based on these, many showed interest in using the native fluorescence spectroscopy as a potential tool in the characterization and diagnosis of cancer. Several studies had been reported on the native fluorescence spectroscopy of various tissues and body fluids in the diagnosis of cancer and other diseases.1–6,26–30 In this context, urine is considered as a diagnostically important biofluid, which has many metabolites.19 Many showed interest in characterizing human urine toward the diagnosis of diseases. For example, Rabinwitz had reported that the ratio of red fluorescence and blue fluorescence from urine may be considered for studying the tumor growth and its altered mechanism.30 Perinchery et al. reported the autofluorescence of urine in the diagnosis of urinary tract infection.20 Subsequently, Masilamani et al. reported the detection of cancer by native fluorescence of urine.27 Wan et al. reported the use of synchronous fluorescence spectroscopy of urine in the diagnosis of stomach cancer.3 However, the native fluorescence spectroscopic characterization of urine in diagnostic oncology is still in progress. In this context, the potential use of native fluorescence spectroscopic technique in the diagnosis and characterization of indoxyl sulfate and neopterin levels in the urine samples of healthy subjects and cervical cancer patients were explored for the first of its kind and the spectral data were subjected to statistical analysis to validate the potentiality of the present technique in the diagnosis of cancer. Figures 1(a) and 1(b) compare the averaged and normalized fluorescence emission spectrum of urine of healthy subjects and cancer patients. From Fig. 1(a), it is observed that the healthy subjects exhibited a broad emission spectrum with maxima around 400 nm, and for cancer subjects, the maxima lies around 420 nm. The peak around 400 nm may be attributed to indoxyl sulfate. The fluorescence emission spectrum of the standard fluorophore indoxyl sulfate and results of previous reports confirms the origin of the peak around 400 nm.26 Furthermore, the cancer subjects exhibited a secondary peak around 520 nm, which may be attributed to riboflavin and the same is absent in the case of healthy subjects.27,29 It was reported that indoxyl sulfate, also known as metabolic indican, which is produced as a modification of the indole, a derivative of tryptophan, was recognized for its potential pathological roles in cells signaling, especially in the production of reactive oxygen species, stimulation of proliferation, or alteration in the extracellular matrix,21,31 which may be the reason for increased level of excretion of indoxyl sulfate in urine of cervical cancer subjects. Bryan has reported that the level of indoxyl sulfate in urine was involved in the genesis of neoplasms, which also supports our results.32 From Figs. 2(a) and 2(b), it can be seen that the observed peak around 440 nm may be due to neopterin and the same was confirmed from the fluorescence emission spectrum of standard fluorophore neopterin (Fig. 3) and from earlier literature.3,33 Among various pterin and its derivatives, reports suggest that neopterin could be detected in body fluids and plays an important role in the malignant disease diagnostics.34–36 It has been reported using HPLC method that increased levels of neopterin are associated with various diseases, including cancer.37 Recently, Gamagedara et al. reported using HPLC method that the level of neopterin in malignant urine was not significantly higher than the healthy subjects.25 However, in the present study, the healthy subjects show more fluorescence intensity of neopterin than that of cervical cancer. From Figs. 1 and 2, the observed peak around 520 nm in the case of cancer subjects may be attributed to riboflavin and the significance of riboflavin was discussed in our earlier publication.29 These compounds participate in various metabolic processes and in energy metabolism and are elevated in blood as metabolic products. From blood, it is excreted in urine via glomerular filtration and tubular secretation.31,34,38 The variation in the fluorescence intensity and change in FWHM indicates that the photophysical characteristics change under metabolic changes. While discussing the lifetime of indoxyl sulfate and neopterin in urine samples at 390- and 440-nm emissions, not much difference was observed between the cancer patients and healthy subjects. However, significant difference was observed between the lifetime of standard fluorophores and urine samples. The variation in the lifetime may be due to the complex nature of urine and the influence of other fluorophores present in urine. Since urine is a multicomponent fluid, it is not possible to measure the lifetime of individual components as there exists the possibility of influence from other fluorophores. Hence, the average lifetime of the samples was calculated. From Table 1, it is observed that at 390-nm emission, the urine samples of healthy subjects and cancer patients exhibit bi-exponential decays and the average lifetime of healthy subjects is 5.82 ns and that of cancer patients is 5.77 ns. It shows that the lifetime of cancer subjects is slightly lesser than the healthy subjects. However, the bi-exponential decay of standard indoxyl sulfate has an average lifetime of 2.63 ns, which is small when compared to the urine samples. Also from Table 1, it is observed that at 440-nm emission, the urine samples exhibit both bi- and tri-exponential decay. For the bi-exponential decay at 440 nm, the average lifetime of urine samples of healthy subjects was 5.96 ns and that of cancer samples was 4.91 ns, whereas for samples with tri-exponential decay at 440 nm, the average lifetime of urine of healthy subjects was 5.74 ns and that of cancer subjects was 4.12 ns. The standard fluorophore neopterin shows bi-exponential decay and its average lifetime is 5.74 ns, which are in good agreement with the lifetime of healthy urine samples, whereas the average lifetime of healthy subjects in both bi- and tri-exponential fits are larger than the urine samples of cancer patients. The reason for these variations may be due to their microenvironment and has to be probed further. Thomas et al. has extensively investigated the steady-state and time-resolved characteristics of commercially available pterins at different pH and the absorption and emission properties of pterins in aqueous solution.33,39,40 However, they did not report the variations of the pterins, especially neopterin, in a complex mixture like urine. In spite of the evident importance of indoxyl sulfate and neopterin in cancer diagnosis, relatively few reports are available on the use of fluorescence spectroscopy, and to the best of our knowledge, no reports are available on the decay kinetics of fluorophores in urine samples when compared to tedious and time-consuming methods like HPLC, nuclear magnetic resonance (NMR), etc.3,22 Though reports are available on the fluorescence characteristics of urine, more studies are required to understand the decay kinetics of these fluorophores in urine samples toward cancer diagnosis. In this study, stepwise linear discriminant analysis was performed to find the sensitivity and specificity of the present technique in the diagnosis of cancer. Different ratio parameters were calculated from the steady-state fluorescence emission intensity at 280- and 350-nm excitation and were used as input values in the discriminant analysis. Each emission wavelength used for the calculation of ratio parameters have specific fingerprint of fluorophores. For example, 385 and 390 nm represents the contribution of indoxyl sulfate, 425 and 430 nm represents the emission due to neopterin, and 500, 515, 520, and 525 nm represents the contribution of flavins. At 280-nm excitation, ratio parameters and , which are mainly due to the contribution of indoxyl sulfate and riboflavin, are significant in discriminating the cancer subjects from the healthy subjects. In the original and cross-validated grouped cases, out of 50 cervical cancer subjects, 43 cases are correctly classified as cancer with a sensitivity of 86% and 49 cases are correctly classified out of 60 healthy subjects with a specificity of 81.7%. On the other hand, at 350-nm excitation, ratio parameters , , and , which are mainly due to the contribution of neopterin and riboflavin, are significant in the analysis. In the original grouped cases, out of 50 cervical cancer subjects, 48 cases are correctly classified as cervical cancer with a sensitivity of 96.0% and 58 cases are correctly classified out of 60 healthy subjects with a specificity of 96.7%. The cross-validated classification yields a sensitivity and specificity of 92 and 95%, respectively. Figure 6 shows the scatter plot for the discrimination functions DF1 and DF2. As a total, 83.6 and 96.4% of samples were correctly classified at 280 and 350 nm, respectively (Table 4). Table 4Classification results of discriminant analysis.
The stepwise linear discriminant analysis of lifetime components for decay at 390 and 440 nm were carried out. For decay at 390 nm, the ratio of lifetime amplitudes discriminates the cancer patients from healthy subjects with a sensitivity of 30% and specificity of 95% both in the original and cross-validated grouped cases. For decay at 440 nm, the amplitude and averaged lifetime were significant in the discrimination with sensitivity of 45% and specificity of 85% both in the original and cross-validated grouped cases. A total of 66 and 67% of the cases at 280- and 310-nm excitation, respectively, were correctly classified. In conclusion, based on the spectral information and results of statistical analysis, the steady-state fluorescence emission spectra of urine of healthy and cancer patients suggest that the present technique may be utilized to discriminate urine samples of cervical cancer patients from that of healthy subjects. The spectral changes due to the emission of indoxyl sulfate, neopterin, and riboflavin may be considered as potential biomarkers in the diagnosis of cervical cancer. AcknowledgmentsThis work was supported by Board of Research in Nuclear Sciences, Department of Atomic Energy, Government of India, Project No. 2009/34/38/BRNS/3206. We thank Dr. R. Chandrasekaran, Department of Statistics, Madras Christian College, Chennai, for his support in statistical analysis. ReferencesR. R. Alfanoet al.,
“Laser induced fluorescence spectroscopy from native cancerous and normal tissue,”
IEEE J. Quantum Electron., 20
(12), 1507
–1511
(1984). http://dx.doi.org/10.1109/JQE.1984.1072322 IEJQA7 0018-9197 Google Scholar
S. Madhuriet al.,
“Native fluorescence spectroscopy of blood plasma in the characterization of oral malignancy,”
Photochem. Photobiol., 78
(2), 197
–204
(2003). http://dx.doi.org/10.1562/0031-8655(2003)078<0197:NFSOBP>2.0.CO;2 PHCBAP 0031-8655 Google Scholar
Y. Q. WanL. J. TangT. Tan,
“Simultaneous determination of xanthopterin and isoxanthopterin in human urine by synchronous fluorescence spectroscopy,”
J. Fluoresc., 20
(6), 1191
–1198
(2010). http://dx.doi.org/10.1007/s10895-010-0667-4 JOFLEN 1053-0509 Google Scholar
R. R. Alfanoet al.,
“Human teeth with and without caries studied by laser scattering, fluorescence, and absorption spectroscopy,”
IEEE J. Quantum Electron., 20
(12), 1512
(1984). http://dx.doi.org/10.1109/JQE.1984.1072351 IEJQA7 0018-9197 Google Scholar
R. R. Alfanoet al.,
“Fluorescence spectra from cancerous and normal human breast and lung tissues,”
IEEE J. Quantum Electron., 23
(10), 1806
–1811
(1987). http://dx.doi.org/10.1109/JQE.1987.1073234 IEJQA7 0018-9197 Google Scholar
N. Ramanujamet al.,
“Fluorescence spectroscopy: a diagnostic tool for cervical intraepithelial neoplasia (CIN),”
Gynecol. Oncol., 52
(1), 31
–38
(1994). http://dx.doi.org/10.1006/gyno.1994.1007 GYNOA3 0090-8258 Google Scholar
D. L. Heintzelmanet al.,
“Optimal excitation wavelengths for in vivo detection of oral neoplasia using fluorescence spectroscopy,”
Photochem. Photobiol., 72
(1), 103
–113
(2000). http://dx.doi.org/10.1562/0031-8655(2000)072<0103:OEWFIV>2.0.CO;2 PHCBAP 0031-8655 Google Scholar
W. S. GlassmanM. SteinbergR. R. Alfano,
“Time resolved and steady state fluorescence spectroscopy from normal and malignant cultured human breast cell lines,”
Lasers Life Sci., 6 91
–98
(1994). LLSCES 0886-0467 Google Scholar
S. R. Schantzet al.,
“Native cellular fluorescence and its application to cancer prevention,”
Environ. Health Perspect., 105
(4), 941
–944
(1997). EVHPAZ 0091-6765 Google Scholar
S. Ganesanet al.,
“Native fluorescence spectroscopy of normal and malignant epithelial cells,”
Cancer Biochem. Biophys., 16
(4), 365
–373
(1998). CABCD4 0305-7232 Google Scholar
S. Madhuriet al.,
“Native fluorescence characteristics of blood plasma of normal and liver diseased subjects,”
Med. Sci. Res., 27 635
–639
(1999). MSCREJ 0269-8951 Google Scholar
V. Masilamaniet al.,
“Optical diagnosis of cancer from blood components,”
Egypt. J. Biophys., 12
(1), 15
–30
(2005). Google Scholar
M. Lualdiet al.,
“Natural fluorescence spectroscopy of human blood plasma in the diagnosis of colorectal cancer: feasibility study and preliminary results,”
Tumori, 93
(6), 567
–571
(2007). TUMOAB 0300-8916 Google Scholar
L. R. BiglerC. F. Streckfus,
“Salivary biomarkers for the detection of malignant tumors that are remote from the oral cavity,”
Clin. Lab. Med., 29
(1), 71
–85
(2009). http://dx.doi.org/10.1016/j.cll.2009.01.004 CLMED6 0272-2712 Google Scholar
D. P. Limaet al.,
“Saliva: reflection of the body,”
Int. J. Infect. Dis., 14
(3), e184
–e188
(2010). http://dx.doi.org/10.1016/j.ijid.2009.04.022 1201-9712 Google Scholar
J. P. LeinerR. HubmannS. Wolfbeis,
“The total fluorescence of human urine,”
Anal. Chim. Acta., 198 13
–23
(1987). http://dx.doi.org/10.1016/S0003-2670(00)85002-3 ACACAM 0003-2670 Google Scholar
K. DubayovaJ. KusnirL. Podracka,
“Diagnostic monitoring of urine by means of synchronous fluorescence spectrum,”
J. Biochem. Biophys. Methods, 55 111
–119
(2003). http://dx.doi.org/10.1016/S0165-022X(03)00031-9 JBBMDG 0165-022X Google Scholar
J. Kusniret al.,
“Concentration matrices—solutions for fluorescence definition of urine,”
Anal. Lett., 38
(10), 1559
–1567
(2005). http://dx.doi.org/10.1081/AL-200065787 ANALBP 0003-2719 Google Scholar
E. J. Saudeet al.,
“Variation of metabolites in normal human urine,”
Metabolomics, 3
(4), 439
–451
(2007). http://dx.doi.org/10.1007/s11306-007-0091-1 METAHQ 1573-3882 Google Scholar
S. M. Perincheryet al.,
“The potential of autofluorescence spectroscopy to detect human urinary tract infection,”
Talanta, 82
(3), 912
–917
(2010). http://dx.doi.org/10.1016/j.talanta.2010.05.049 TLNTA2 0039-9140 Google Scholar
A. K. GelascoJ. R. Raymond,
“Indoxyl sulphate induces complex redox alterations in mesangial cells,”
Am. J. Physiol. Renal Physiol., 290
(6), F1551
–F1558
(2006). http://dx.doi.org/10.1152/ajprenal.00281.2004 0363-6127 Google Scholar
S. Itoet al.,
“Indoxyl sulfate induces leukocyte-endothelial interactions through up-regulation of E-selectin,”
J. Biol. Chem., 285 38869
–38875
(2010). http://dx.doi.org/10.1074/jbc.M110.166686 JBCHA3 0021-9258 Google Scholar
N. Turganet al.,
“Association between homocysteine and neopterin in healthy subjects measured by a simple HPLC-fluorometric method,”
Clin. Biochem., 34
(4), 271
–275
(2001). http://dx.doi.org/10.1016/S0009-9120(01)00226-0 CLBIAS 0009-9120 Google Scholar
E. MansillaD. MerasF. Salinas,
“Analysis of pteridines and creatinine in urine by HPLC with serial fluorometric and photometric detectors,”
Chromatographia, 53
(9–10), 510
–514
(2001). http://dx.doi.org/10.1007/BF02491613 CHRGB7 0009-5893 Google Scholar
S. GamagedaraS. GibbonsY. Ma,
“Investigation of urinary pteridine levels as potential biomarkers for noninvasive diagnosis of cancer,”
Clin. Chim. Acta., 412
(1–2), 120
–128
(2011). http://dx.doi.org/10.1016/j.cca.2010.09.015 CCATAR 0009-8981 Google Scholar
A. G. Anweret al.,
“Distinctive autofluorescence of urine samples from individuals with bacteriuria compared with normals,”
Clin. Chim. Acta., 401
(1–2), 73
–75
(2009). http://dx.doi.org/10.1016/j.cca.2008.11.021 CCATAR 0009-8981 Google Scholar
V. Masilamaniet al.,
“Cancer detection by native fluorescence of urine,”
J. Biomed. Opt., 15
(5), 057003
(2010). http://dx.doi.org/10.1117/1.3486553 JBOPFO 1083-3668 Google Scholar
S. Sivabalanet al.,
“In vivo native fluorescence spectroscopy and nicotinamide adinine dinucleotide/flavin adenine dinucleotide reduction and oxidation states of oral submucous fibrosis for chemopreventive drug monitoring,”
J. Biomed. Opt., 15
(1), 017010
(2010). http://dx.doi.org/10.1117/1.3324771 JBOPFO 1083-3668 Google Scholar
R. Rajasekaranet al.,
“Characterisation and diagnosis of cancer by native fluorescence spectroscopy of human urine,”
Photochem. Photobiol., 89
(2), 483
–491
(2013). http://dx.doi.org/10.1111/php.2013.89.issue-2 PHCBAP 0031-8655 Google Scholar
H. M. Rabinowitz,
“A correlation of fluorescence of human urine with benign and malignant growth,”
Cancer Res., 9
(11), 672
–676
(1949). CNREA8 0008-5472 Google Scholar
T. Niwa,
“Uremic toxicity of indoxyl sulphate,”
Nagoya J. Med. Sci., 72
(1–2), 1
–11
(2010). NJMSAG 0027-7622 Google Scholar
G. T. Bryan,
“Urinary excretion of indoxyl sulphate (indican) by human subjects ingesting a semisynthetic diet containing variable quantities of L-tryptophan,”
Am. J. Clin. Nutr., 19
(2), 113
–119
(1966). AJCNAC 0002-9165 Google Scholar
C. LorenteA. H. Thomas,
“Photophysics and photochemistry of pterins in aqueous solution,”
Acc. Chem. Res., 39
(6), 395
–402
(2006). http://dx.doi.org/10.1021/ar050151c ACHRE4 0001-4842 Google Scholar
A. BerdowskaK. Zwirska-Korczala,
“Neopterin measurement in clinical diagnosis,”
J. Clin. Pharm. Ther., 26
(5), 319
–329
(2001). http://dx.doi.org/10.1046/j.1365-2710.2001.00358.x JCPTED 1365-2710 Google Scholar
B. Melicharet al.,
“Urinary neopterin in patients with metastatic colon cancer treated with patupilone,”
Pteridines, 22 61
–65
(2011). http://dx.doi.org/10.1515/pteridines.2011.22.1.61 PTRDEO 0933-4807 Google Scholar
B. Melicharet al.,
“Urinary neopterin in patients with ovarian cancer,”
Pteridines, 17
(4), 145
–153
(2006). PTRDEO 0933-4807 Google Scholar
G. J. Reibnegger,
“Neopterin as a prognostic indicator in patients with carcinoma of the uterine cervix,”
Can. Res., 46
(2), 950
–955
(1986). CNREA8 0008-5472 Google Scholar
S. S. GropperJ. L. SmithJ. L. Groff, Advanced Nutrition and Human Metabolism, 329
–333 Cengage Learning, Belmont, California
(2009). Google Scholar
M. P. Serrano,
“Emission properties of dihydropterins in aqueous solutions,”
Phys. Chem. Chem. Phys., 13
(16), 7419
–7425
(2011). http://dx.doi.org/10.1039/c0cp02912b PPCPFQ 1463-9076 Google Scholar
A. H. Thomaset al.,
“Fluorescence of pterin, 6-formylpterin, 6-carboxypterin and folic acid in aqueous solution: pH effects,”
Photochem. Photobiol. Sci., 1
(6), 421
–426
(2002). http://dx.doi.org/10.1039/b202114e PPSHCB 1474-905X Google Scholar
BiographyRamu Rajasekaran received his master’s degree MSc in physics in the year 2006 from Bharathidasan University, Trichy, and later he joined his PhD in 2007 from Anna University, Chennai. His area of interest is optical characterization of biofluids for the early diagnosis of cancer. Prakasa Rao Aruna received her master’s degree MSc in physics from Madras University, Chennai, in the year 1985, and later her PhD in 1991 from Anna University, Chennai. Her area of interest is mediphotonics, analysis of biofuids in disease diagnosis. Currently she is heading the Department of Medical Physics, Anna University, Chennai. Dornadula Koteeswaran obtained his master’s degree MDS from Government Dental College, Dr. M.G.R. University, Chennai. Currently, he is the professor of dental surgery in the speciality of oral medicine. His interest is optical biopsy of tissues in the diagnosis of cancer, oral medicine, and radiology. Ganesan Bharanidharan received his master’s degree MSc in medical physics in the year 2002 and PhD in 2008 from Anna University, Chennai. The main area of his research interests are radiation dosimetry and Monte Carlo simulations. Currently, he is working as assistant professor in the Department of Medical Physics, Anna University, Chennai. Munusamy Baludavid is working as the Director of Government Arignar Anna memorial cancer hospital, Kancheepuram. He completed the MBBS from Kilpauk Medical College, Chennai, in the year 1980, DMRT from Madras Medical College, Chennai in 1984, and MD Radiotherapy in 1987. He got training in radiation oncology in USA in 1995 under a WHO fellowship. His research interest lies in the field of brachytherapy. Singaravelu Ganesan received his master’s degree MSc in medical physics in the year 1984, and later his PhD in 1991 from Anna University, Chennai. His area of interest is early diagnosis of cancer by optical spectroscopy, Raman Imaging of tissues, and photodynamic therapy. He has two US patents. Currently he is heading the Anna University in the capacity of Registrar. |
|||||||||||||||||||||||||||||||||||||||||||||||||||||||||||||||||||||||||||||||||||||||||||||||||||||||||||||||||||||||||||||||||||||||||||||||||||||||||||||||||||||||||||||||||||||||||||||||||||||||||||||||||||||||||||||||||||||||||||||||||||||||||||


