|
|
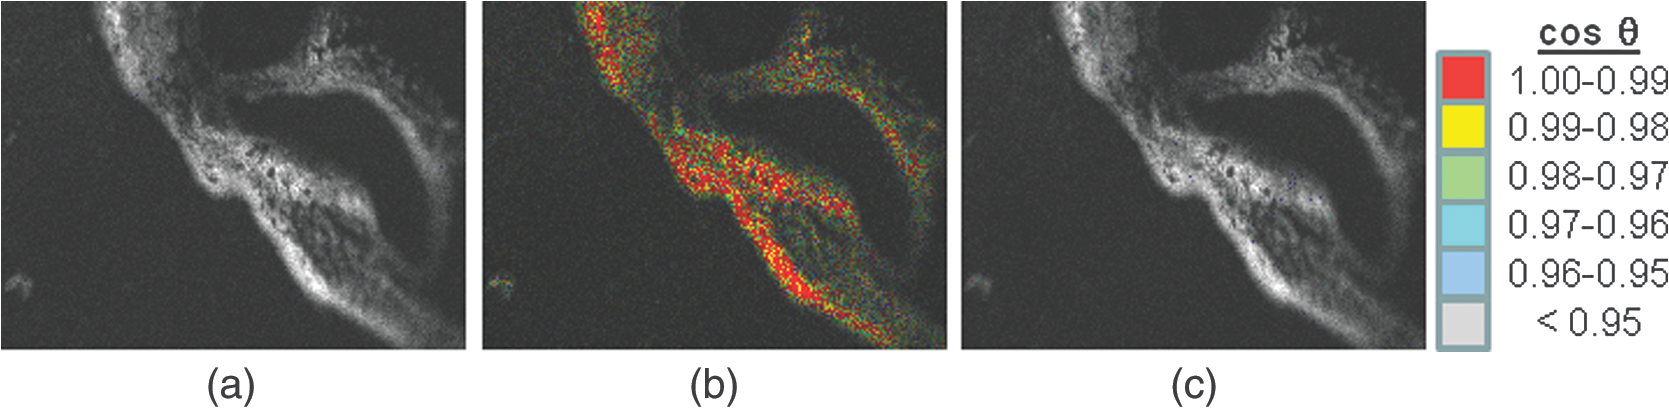
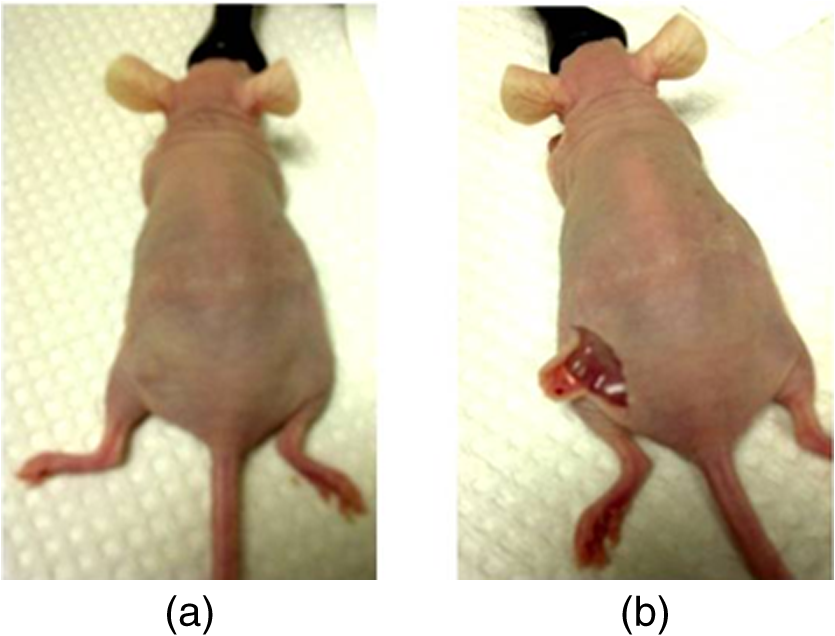
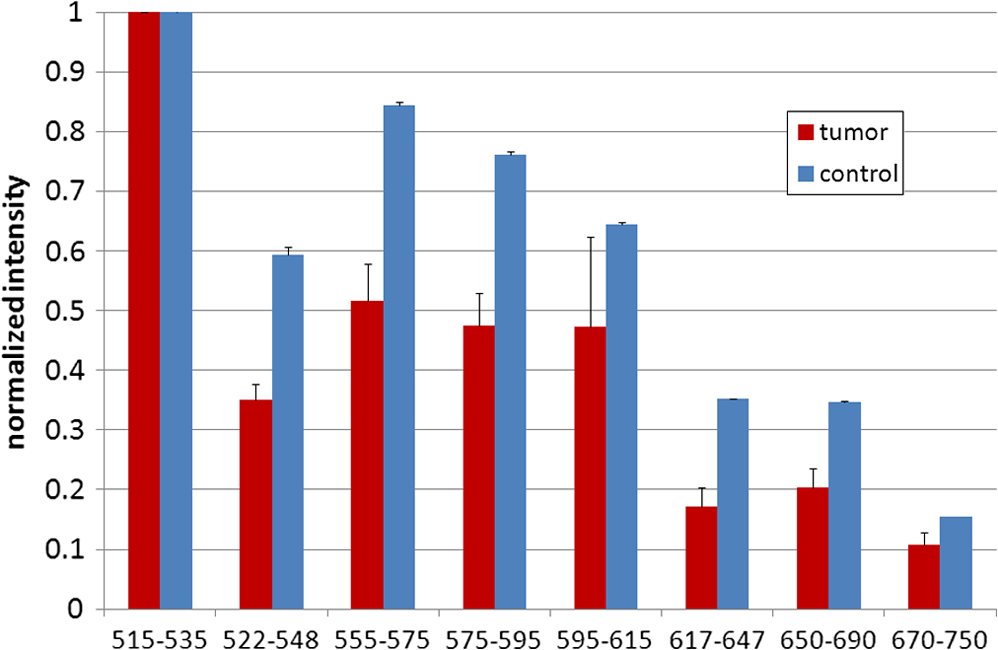
1.IntroductionFast multispectral confocal scanning has great promise for imaging cancer at the tissue and cellular levels.1 Biomedical researchers aim to detect tumor angiogenesis, take optical biopsies, perform treatments (including laser surgery and photodynamic therapy), and monitor long-term results. Ex-vivo studies can be performed on tissue samples labeled with various contrast agents, such as fluorescent dyes. The most likely in-vivo applications in humans will have to detect intrinsic signals such as autofluorescence. Often considered background noise that interferes with other signals, spectrally resolved autofluorescence provides a wealth of information regarding many conditions, including lung cancer,2,3 colorectal cancer,4 breast cancer,5 and their metastases. As an example, the fluorescence spectra of healthy tissue, metaplastic tissue, dysplastic tissue, and invasive bronchiole carcinoma have been published.2 These spectra indicate that a resolution bandwidth of 30 nm over a free spectral range from 500 to 800 nm would easily distinguish amongst the various tissues, thus allowing for high specificity and sensitivity. The above goals simultaneously require sufficient spatial, spectral, and temporal resolution. Confocal microscopy can map millimeter sized fields-of-view with submicron spatial resolution. Spectroscopic tools can provide multispectral data during laser excitation of fluorescence. Further, these spatial and spectral measurements should function faster than the movements associated with biological processes, including respiration and blood flow. All of these characteristics are not yet available in one cost-effective instrument, mostly because the spectroscopic tools are not fast enough. We present here a new approach for generating high-speed multispectral images of intrinsic autofluorescence. Although targeted at endogenous contrast, the system can also be applied to exogenously labeled tissues. The central concept is that spectra can be acquired for each pixel in a confocal spatial scan by using a fast spectrometer based on optical fiber delay lines. Using fiber delay lines to map spectral bands into the time domain was proposed over 40 years ago for wavelength division multiplexing (US Patent # 4,299,488). Since our spectrometer is fiber based, the face of the entrance fiber can act as the pinhole in a confocal microscope. This concept merges fast spectroscopy with standard spatial scanning to create datacubes in real time. Originally considered by the lead author for coarse wavelength division multiplexing at telecom wavelengths in the near infrared, this concept is a good match for applications that require about 10 wavelength bins at visible and/or near-infrared wavelengths. This project and resulting instrumentation merges our expertise from the telecommunications6 and biomedical sectors7 and has been protected by three US patents (#6,452,681 in 2002, #7,366,365 in 2008, and #7,817,267 in 2010). The following sections describe the design, attributes, performance, and advantages of this new biomedical imaging device. Examples are given of multispectral images taken on several samples, including fluorescent beads, quantum dots, fixed tissue, and ex-vivo tissue. Similar images taken with an endoscopic bundle are also presented. 2.Optical Design and Experimental MethodsA schematic of our multispectral confocal scanner is shown in Fig. 1. The following subsections describe the confocal, endoscopic, and spectroscopic subsystems. We close this section with an overview of our sample preparation methods. 2.1.Confocal ScannerAs with fluorescence microscopes, the excitation beam enters the system by reflecting from a dichroic splitter. The excitation is provided by a pulsed 488- or 405-nm laser. As explained below, the pulse length is matched to the propagation time through the delay lines shown in Fig. 1. Averaged over 1 s, excitation levels at the sample are typically in the 1 to 2 mW range. Optical power should be limited to about 5 mW to avoid potential tissue damage.8 As a result, compact diode lasers are appropriate—in our case a PhoxX laser from Omicron, Rodgau-Dudenhofen, Germany. Confocal microscopes are widely available from several leading companies. The basic concept of confocal microscopy is shown by the two scanning mirrors and associated optics at the left side of Fig. 1. As the two mirrors are scanned in an raster pattern, the focused spot on the sample is always conjugate with a pinhole or small-area detector (the pinhole in Fig. 1 is the fiber aperture marked with an asterisk). The pinhole limits the acceptance of light emitted from axial and lateral locations away from the position of the focused spot. Since fluorescence from biological materials typically occurs within 1 to 5 ns after excitation, both reflected and fluorescence signals propagate back to the pinhole before the mirrors can move appreciably. This allows the mirrors to de-scan back-propagating photons such that light from the focused spot indeed stays conjugate with the pinhole. As a result, scanning confocal systems can generate maps (or “images”) with spatial resolution at or near the laser spot size. For the microscopy mode depicted in Fig. 1, the 488-nm laser beam is focused at to a 1.2-μm diameter spot and scanned at over an adjustable field (that can be zoomed from 50 to 500 μm). Since the scanning process actually generates a spatial convolution of the focused spot with features in the sample, it is possible to detect features below the diffraction limit (though they appear equal in size to the spot). These ideas9 have been applied to images of functional nuclear architecture10 and have been used for years in the materials and semiconductor industries.11 2.2.Endoscopic OpticsThe system depicted in Fig. 1 performs endoscopy when a sample is placed at the distal end of an endoscope containing 30,000 3-μm diameter fibers. The proximal end of the coherent fiber bundle is placed under the lens. The confocal scanner raster-scans the proximal end of the endoscope. A given fiber within the bundle transfers the laser to the distal end, where a lensed tip (two Grin lenses) relays the beam from the fiber to the tissue. Fluorescence or reflected light from a resolution element is imaged back into the same fiber, propagates back to the proximal end, is collected and de-scanned by the confocal optical system, and is finally focused on the confocal pinhole. This entire process occurs within the dwell time of the raster scan (2.5 μs per pixel in our design). For the endoscopy mode depicted in Fig. 1, the 488-nm excitation beam is focused by the distal tip at to a 0.4-μm diameter spot and scanned at 10 frames per second over an adjustable field at a working distance of 80 μm (can be zoomed from 10.8 to 108 μm). The Grin lens system relays light from one of the 30,000 fibers into the 0.4-μm diameter spot. Field size is adjusted by changing the angular excursions of the two scanning mirrors. The transmission efficiency of this endoscope is consistent with reports in the literature.12 The following subsection describes our spectrometer, which conveniently maps proximal reflection and emission bands into different temporal bins. 2.3.Fiber-Optic SpectrometerOur fiber optic spectrometer is based on a serial array of reflecting spectral elements (labeled in Fig. 1), delay lines between these elements (fiber loops in Fig. 1), and a single photomultiplier tube. After excitation by a laser pulse, broadband fluorescence from a sample propagates into the array via the confocal aperture. Light of the shortest wavelength band () reflects from the first element, and light of the ’th wavelength band reflects from the ’th element. Each wavelength is mapped into a specific time slot. The two-way propagation time in each delay line is equal to the length of the laser pulse (about 166 ns for a 15 bin system). A plot of the detector’s signal versus time contains the laser in the first bin, and then fluorescence of various distinct colors in the subsequent bins. The spectral elements can be fabricated in two ways—fiber tips can be coated with interference filters to create wide spectral slices, whereas fiber Bragg gratings can be written into the fiber core to create 1- to 2-nm-wide spectral slices.13 Most spectrometers employ one grating that disperses light spatially across detectors or pixels. Our approach employs tips or gratings that distribute the light temporally against one detector. When detecting intrinsic fluorescence, the detector in this design sees optical signals in the picowatts to nanowatts range. As a result, the detector must have a high gain–bandwidth product. Detectors with internal gain [photo multiplier tubes (PMTs) at , electron multiplying charged coupled devices at , and avalanche photo diodes at 50] are of interest because they can amplify low-level signals above read-out and/or preamp noise. To obtain a useful signal-to-noise ratio (SNR), our system uses a fiber-coupled PMT with at 6 MHz. The SNR is defined as peak signal divided by the RMS noise. Since our system is shot limited, the SNR is driven by signal strength, which in turn is driven by fluorescence yield, collection efficiency, and spectrometer throughput. In most commercially available confocal instruments, only one or a small number of wavelengths can be measured during each spatial scan. Commercially available systems do offer solutions using a bulk diffraction grating and 32 PMT elements. Our approach is intended to be more cost effective for clinical applications. Higher collection efficiency is obtained by using a larger confocal aperture. Fiber tip arrays have been fabricated with both 10- and 62.5-μm core fiber. Each tip is attached to another fiber with physical contact such that the coatings are immersed between glass on both sides. The larger core provides higher signals with tissue samples. Neither core size is compatible with fiber gratings for visible wavelengths—which perform optimally with single mode fiber having a 3-μm core diameter. The angular distribution in multimode fiber (MMF) must be assessed regarding operation with coated fiber tips. The angular distribution in MMF is a function of launch conditions.14 Our confocal optics use low-angle injection—i.e., about at the confocal aperture. Due to Snell’s law, the angle of incidence at a fiber tip within the MMF is therefore about 4 deg. In comparison, we should mention that the maximal coupling angle is 24 deg and the maximal internal angle is 15 deg, when a Lambertian source is used to populate all modes in a MMF (). Figure 2 shows 10 modeled high pass filters spaced 30 nm apart. The filter with the shortest wavelength is mapped into the first bin and the filter with the longest wavelength is mapped into the last bin. Modeled spectra show that these curves only move about 2 nm to the blue as the internal angle of incidence increases from zero to 5 deg. The ripple at the bottom of Fig. 2 causes crosstalk from high wavelength bins to low wavelength bins. This crosstalk can be limited to a few percent with optimized thin film designs. The throughput of our fiber arrays is reduced by core-to-clad coupling and core-to-core concentricity at each coated fiber tip. These effects limit the number of useful coated tips, and result in an overall throughput of from 20% to 70%. Although our design can accommodate 10 to 15 bins, the data in this article was generated with either three or six bins as called out in the figure captions. The key advantage of this design is speed—a spectrum is acquired during the dwell time of each pixel in the spatial scan. Beyond speed, this new design has several other advantages. First, wavelength bin centers and band-pass widths can be arranged with varying widths and spacings matched to a given application. The spectral widths and spacings in designs based on single bulk gratings are constrained by the diffraction equation. Second, the wavelength separation method has no influence on spatial scanning fidelity. A map of a given color will spatially register with a map of another color. Third, each polarization state is reflected in a similar manner. Fourth, the new design is compatible with confocal optics. 2.4.Software and FirmwareThe optical system described above is controlled by software running on a 1.73-GHz quad-core Intel i7-820 processor, and firmware running on a custom electronics box (see system photo in Fig. 3). The software, written in LabView, generates the graphical user interface (GUI) shown in Fig. 4. The firmware runs on board-mounted field programmable gate array and digital signal processor chips within the electronics box, which also provides several interconnects to the optical package and the quad box. These interconnects include the following inputs [start trigger, universal serial bus (USB), fiber to PMT], and outputs (scan mirror control signals, laser trigger, PMT analog output, A-to-D start trigger, sampling clock). A 14-bit digitizer card capable of 100 MS/s is mounted within the quad box chassis. Several events occur during operation: the GUI issues a start pulse, the electronics box sends control signals to the laser and mirrors, and the digitizer card receives three signals (start pulse, PMT output, and sampling clock). Finally, the quad box receives a serial array of acquisitions from the digitizer, and casts the data into a three-dimensional data cube. Fig. 3System photo: monitor (A), optical package (B), electronics box (C), quad core controller (D).  Fig. 4System GUI showing controls, bin histogram, and multispectral image of mixed q-dots (, to 530 nm, , to 580 nm, to 600 nm, to 650 nm, and to 780 nm) (, , ).  Selected slices of the data cube and a bin histogram are displayed on the GUI in real time. A screen shot from a scan on mixed quantum dots (q-dots) is shown in Fig. 4. The GUI includes settings for allocations amongst space, wavelength, and over-sampling, which are forwarded via the USB to the electronics box. Default settings are: 200 pixels per line, 150 lines per data cube, 15 spectral bins per pixel, and 10 samples per bin. As indicated in Fig. 5, the GUI allows multiple image display modes: any selected spectral bin in gray levels (A), the sum of all selected spectral bins in gray levels (B), three selected spectral bins assigned to display RGB levels (C), and any combinations of bins can be entered into formulae to generate a customized display. These formulae, for example, can assign gray levels to the delta between two bins normalized by a third bin, or a similar computation customized for each of the red, green, and blue levels of a display. An example is given by the image in Fig. 4 where bin 7 is assigned to red, bin 6 to green, and bin 3 to blue. The histogram at the top of Fig. 4 is a spectrum averaged over a frame (the wavelengths for each bin are defined in the figure caption). The two histograms at the right side of Fig. 4 are keyed to individual pixels in the image. Each scanned field generates 30,000 spectra. Our goal is to use multiple bins to colorize an image that clearly shows the presence of abnormal tissue at cellular spatial resolution. The GUI also provides regions-of-interest analysis tools, and storage of a sequence of frames from bin 1 to bin to facilitate development of the colorization formulae. Fig. 5Modes for extracting two-dimensional images from three-dimensional data cubes (all images occur at and can be summed or saved as a series of frames over to ).  One useful colorization formula is based on the spectral angle mapping (SAM) algorithm15 given in Eq. (1). The SAM method computes the cosine of the angle between the signal () and reference () vectors by computing the dot product of the two vectors, and dividing by the product of their absolute magnitudes. In our case, each component of is represented by , laser-induced fluorescence from an unknown sample in the ’th spectral bin (for example in Fig. 1). Each component of is represented by , laser-induced fluorescence from a known reference in the ’th spectral bin. The software and firmware described above can determine the SAM angle for each pixel in a confocal scan, and colorize the resulting image according to the magnitude of the angle—all in real time. When the cosine is unity, the and vectors are perfectly matched. A key advantage of SAM images is that variations in brightness (due to fluorescent intensity or the degree of focus) do not impact the image. This is because SAM images are based on the angle between the two vectors as opposed to the magnitude of the vectors. Useful SAM images require appropriate reference vectors. As an example, we developed reference vectors for three q-dots that emit in blue, green, and red wavelengths. Figure 6 shows three scans of the green emitting q-dots using the three reference vectors. These images were generated by assigning pixel brightness to the intensity of one spectral bin, while assigning pixel color according to the value of and the colorization code given in Fig. 6. As expected, the green q-dot emission is colorized by the green q-dot reference, but not by the blue and red references 2.5.Sample Preparation MethodsSpatial resolution tests were performed with the USAF 1951 high resolution test target. This target contains bars with spatial frequencies ranging from 1 to (finest bars are 0.8-μm wide). Three-micron diameter fluorescein-doped fluorescent beads were also used to assess image quality. These beads were drop cast from solution onto glass slides and dried in air. Spectral resolution tests were performed with quantum dots (q-dots) that respond to blue excitation and exhibit fairly discrete emission spectra. Q-dots were selected for emission at 650 nm (CdSe/ZnS powder), 558 nm (CdSe/ZnS powder), and 486 nm (CdSe in toluene). The dots were suspended in toluene and drop cast onto glass slides. Initial biomedical assessments were performed on fixed rat mammary tissue obtained from the Cedars-Sinai Medical Center. These samples16 include healthy left breast as well as right breast transfected with human breast cancer cells. Ex-vivo images of nude mouse organs were obtained at the Cedars-Sinai Medical Center. These scans were acquired within minutes of euthanizing the animal to minimize changes in metabolic fluorophores. This mouse was 20-weeks old and was anesthetized/euthanized as approved by the institutional animal protocol (CSMC: IACUC#4397) Additional ex-vivo studies have been undertaken on preclinical tumor xenografts generated by subcutaneous injection with human breast cancer cells (MDA-MB-231). Typically 2.5-million cells were injected into the flank of a 12-week old athymic nude female mouse and the tumor growth was monitored for 6 weeks until the tumor grew to about in size. At this point, the mouse was anesthetized and euthanized as approved by the institutional animal protocol (CSMC:IACUC#4397). A large tumor with adjacent skin (see Fig. 7) was excised at the Cedars-Sinai Medical Center in Los Angeles, packed in Hypothermosol (available from BioLife Solutions Inc., Bothell, Washington), and shipped to Vermont for analysis. Storing and or shipping in Hypothermosol can preserve metabolic fluorophores for 2 to 7 days. 3.System ValidationAt a typical sampling rate of 60 MHz, each image generation mode shown in Fig. 5 functions at 10 frames per second. This temporal rate is sufficient for avoiding image artifacts caused by a subject’s pulse and respiration while diagnosing disease and/or discerning surgical margins. As for spatial resolution, our microscopy mode resolves 1-μm bars on the USAF test target. Further, Fig. 8 shows fluorescent beads imaged by both the microscopy and endoscopy modes. The images in this figure were generated with the method depicted in Fig. 5(c) (display RGB values are driven by three spectral bins at 614 to 699 nm, 522 to 614 nm, and 506 to 522 nm, respectively). The images are dominated by the predominantly green fluorescein signal. Our 3-μm diameter beads correspond to the smallest spots on the microscopy image, and the smallest grouping of illuminated fibers in the endoscopy image. The endoscopic bundle contains 30,000 fibers, which are packed into the hexagonal array that appears superimposed on the image. The grin lenses on the distal tip relay an individual 3-μm diameter fiber to a 0.3- to 0.4-μm spot in the plane of the sample. This spatial resolution is sufficient for cellular level analysis. Fig. 8Fluorescent beads in microscopy mode with a 200-μm field (a), and endoscopy mode with a 43-μm field (b) ( covering 614 to 699 nm, covering 522 to 614 nm, and covering 506 to 522 nm).  As for spectral resolution, the microscopy mode has imaged quantum dots with peak emission at 650, 558, and 486 nm. These tests were completed with 488-nm laser excitation and our three emission bins: 506 to 522 nm, 522 to 614 nm, and 614 to 699 nm. An additional test was completed with a 405-nm laser and the bluest emission bin expanded to 450 to 522 nm. Histograms show that the emission for each q-dot appears in the appropriate temporal bin with expected levels of crosstalk, caused by the spectral width of each q-dot, and the spectral ripple of the coated tips. This data indicates that the mapping of spectral bins into the time domain is functional. We have subsequently shown that this approach is also functional with ten bins. 4.Biomedical ResultsImages were taken on fixed rat breast and ex-vivo mouse tissue in microscopy mode using the spectral bins defined in the figure captions. All images were adjusted for brightness and contrast. Figure 9 exhibits images of fixed, unstained, rat mammary tissue. The right breast had been transfected with human breast cancer cells. Figure 10 compares SAM-encoded images with integrated fluorescence images of the same samples in different locations. The reference vector for these SAM images was equated to the epithelial tissue on the inner duct wall of the right breast. The SAM-encoded images reveal subtle spectral differences between the left and right mammary ducts that are not readily evident in the monochrome images. It should be emphasized that the tissue in Fig. 10 is a thin slice of fixed tissue. Fixed tissues inherently exhibit fewer differences between tissue types because of the destruction of molecules during the fixation process. The red area at the bottom right of the figure may be another duct in the adjacent plane, though this could only have been confirmed if the sample had been in a fresh condition before slicing. Our main point is that the SAM image can show these differences on fixed tissue with only three bins in real time. Fig. 9Fluorescence from fixed rat mammary tissue—healthy (a), and transfected (b) both excited with 488 nm over a 200-μm-wide field ( covering 614 to 699 nm, covering 522 to 614 nm, and covering 506 to 522 nm).  Fig. 10Integrated fluorescent images (top), and SAM images (bottom) of fixed rat mammary tissue-excited with 488 nm over a 200-μm-wide field.  Figure 11 presents images of several ex-vivo mouse organs—including heart, lung, liver, spleen, and kidney. These tissues were scanned within minutes of animal euthanasia to assess signal strength before various metabolic fluorophores changed or expired. Intrinsic fluorescence of these healthy tissues is dominated by green fluorescence sensed in bin 3 (522 to 614 nm). There are, however, subtle contributions from other colors as shown in the three histograms. This data shows that our system has enough throughput to generate multispectral images of intrinsic fluorescence from several animal organs. More spectral bins and detailed spectral data processing would be needed for identifying disease in fresh tissue. Fig. 11Intrinsic autofluorescence of ex-vivo mouse organs [(a) heart, (b) spleen, and (c) liver) all excited with 488 nm over a 200-μm-wide field ( covering 614 to 699 nm, covering 522 to 614 nm, and covering 506 to 522 nm). 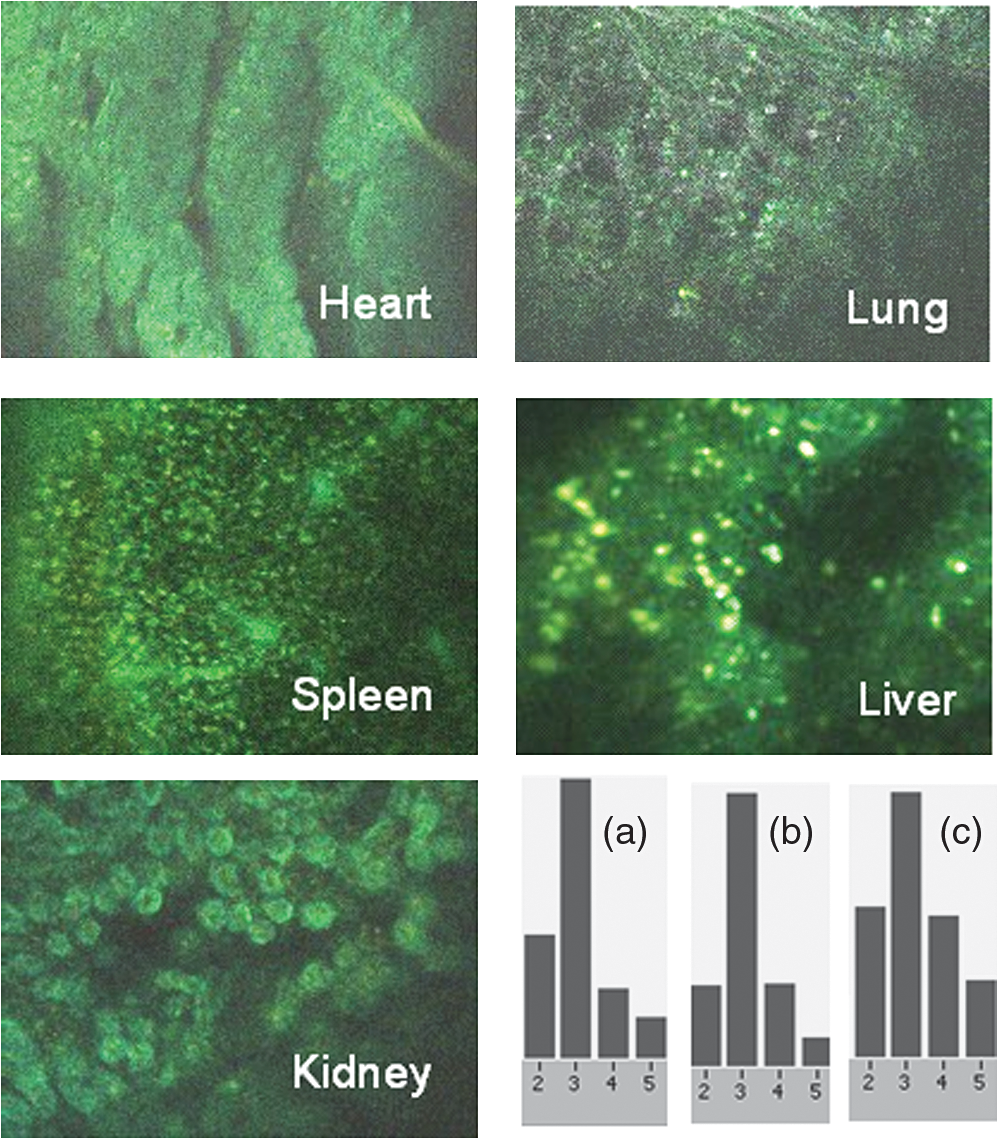 Additional ex-vivo studies have been undertaken on preclinical (mouse) models transfected with human breast cancer cells. The spectra in Fig. 12 and images in Fig. 13 were acquired from both the tumor (see Fig. 7) and from the inside surface of adjacent skin. Eight spectral bins were populated using eight free space optical filters. Experiments with free space filters are used to determine ideal spectral bin centers and widths for the fiber tip arrays. For Fig. 12, each bin was averaged over the associated image after correcting for PMT response and spectral filter width. This allowed for signal strength estimates in evenly spaced 20-nm-wide bins, which were normalized by the signal strength observed in the 515 to 535 nm bin. The gray scale images at the top of Fig. 13 represent the average fluorescence over all spectral bins. In the gray scale tumor image, a cluster of fat cells is clearly visible in the top right corner. In the gray scale skin image, there are a number of bright cells of unknown origin. A multidimensional SAM analysis was performed by assigning the spectral bins in Fig. 12 to dimensions through [see Eq. (1)]. A reference vector was taken from a region centered on the macroscopic tumor, whereas signal vectors were taken from each pixel in the images. The bottom two images in Fig. 13 show the resulting color-coded SAM images. In this scheme, pure red indicates a perfect match to the tumor spectra. As expected, the image on the bottom left has a larger percentage of red and yellow pixels that indicate a close match to the tumor reference vector, whereas the image on the bottom right has few to no red pixels. The brightest cells in the gray scale skin image (top right) do not fit well to the tumor reference vector and appear black in the pseudocolored image (bottom right). The cosine distribution in Fig. 13 is larger than the cosine distribution in Fig. 10 because a more diverse set of fluorophores is being sampled in Fig. 13. These images were acquired on recently excised tissue, not the fixed embedded sections shown in Fig. 10. Armed with reference vectors for several organs and disease states, this approach can potentially enable real time surgical guidance. Several fiber tip arrays can be designed for multiple applications and selected via a fiber switch during medical procedures. Fig. 13Images of integrated fluorescence (top) and SAM (bottom) using the spectra from Fig. 12—all excited with 488 nm over a 200-μm-wide field.  5.ConclusionsThe multispectral imaging system described in this article has been designed, built, and tested for the spectral mapping of intrinsic tissue fluorescence (autofluorescence). The spatial resolution is sufficient for cellular level imaging. The spectral resolution is suitable for detecting the spectral signatures of cancer. The temporal resolution is sufficient for avoiding the effects of cardiovascular and respiratory rhythms of living subjects. The approach is similar to confocal microscopes that use a rotating filter wheel, except that the filters are effectively rotated at the speed of light. The system has been demonstrated on several samples,17 including fluorescent beads, quantum dots, fixed tissue, and ex-vivo tissue. SAM analysis has revealed healthy versus diseased tissue and can be implemented in real time. Other systems have more resolution in either space, wavelength, or time—but generally not simultaneously. Our approach is a cost-effective design with resolution appropriate for detecting intrinsic fluorescence in a clinical setting. Armed with suitable spectral libraries, our ultimate goal is to enable preventive healthcare and the early detection of disease via optical biopsy. The technique would also allow surgeons to assess surgical margins in real time, by sensing the presence of cancerous cells surrounding an obvious tumor. For example, our multispectral imaging endoscope could be used in the intraoperative assessment of lumpectomy margins. Mapping spectral bands into the time domain can be applicable to microscopy, endoscopy, and cytometry. One can imagine other applications involving fluorescence, two-photon spectroscopy, and Raman spectroscopy with future impact on cytomics, histomics, and clinical settings. AcknowledgmentsThis project was funded by the National Cancer Institute through the National Institutes of Health (SBIR Phase II grant number 5R44CA124036-03). We thank Dr. Bob Johnson of Omega Optical for supporting this effort. ReferencesA. Chung et al.,
“Advanced optical imaging requiring no contrast agents—a new armamentarium for medicine and surgery,”
Curr. Surg., 62
(3), 365
–370
(2005). http://dx.doi.org/10.1016/j.cursur.2004.12.011 CUSUDB 0149-7944 Google Scholar
M. Zellweger et al.,
“Absolute autofluorescence spectra of human healthy, metaplastic, and early cancerous bronchial tissue in vivo,”
Appl. Opt., 40
(22), 3784
–3791
(2001). http://dx.doi.org/10.1364/AO.40.003784 APOPAI 0003-6935 Google Scholar
L. Thiberville et al.,
“In vivo imaging of the bronchial wall microstructure using fibered confocal fluorescence microscopy,”
Am. J. Respir. Crit. Care Med., 175
(1), 22
–31
(2007). http://dx.doi.org/10.1164/rccm.200605-684OC AJCMED 1073-449X Google Scholar
S. Fu et al.,
“Application of laser induced autofluorescence spectra detection in human colorectal cancer screening,”
Proc. SPIE, 5141 298
–304
(2003). http://dx.doi.org/10.1117/12.500455 PSISDG 0277-786X Google Scholar
V. K. Ramanujan et al.,
“Non-invasive, contrast-enhanced spectral imaging of breast cancer signatures in preclinical animal models in vivo,”
J. Cell Sci. Ther., 1
(102), 102
–106
(2010). http://dx.doi.org/10.4172/2157-7013 JCSTIW 2157-7013 Google Scholar
G. E. Carver, R. W. Heebner and G. Astfalk,
“Wafer level testing for semiconductor laser manufacture via spatially resolved photoluminescence,”
IEEE J. Quantum Electron., 1
(4), 980
–986
(1995). http://dx.doi.org/10.1109/2944.488395 IEJQA7 0018-9197 Google Scholar
D. L. Farkas et al.,
“Optical image acquisition, analysis and processing for biomedical applications,”
Springer Lect. Notes Comput. Sci., 1311 663
–671
(1997). http://dx.doi.org/10.1007/3-540-63508-4 0302-9743 Google Scholar
A. Vogel and V. Venugopalan,
“Mechanisms of pulsed laser ablation of biological tissues,”
Chem. Rev., 103
(2), 577
–644
(2003). http://dx.doi.org/10.1021/cr010379n CHREAY 0009-2665 Google Scholar
J. B. Pawley, Handbook of Biological Confocal Microscopy, 2nd ed.Plenum Press, New York
(1995). Google Scholar
T. Cremer et al.,
“Chromosome territories, interchromatin domain compartment and nuclear matrix: an integrated view of the functional nuclear architecture,”
J. Surg. Edu., 62
(3), 365
–370
(2005). CRGEEJ 1045-4403 Google Scholar
G. E. Carver,
“Scanned photoluminescence with high spatial resolution in semi-insulating GaAs and InP: aspects of surface passivation and photodegradation,”
Semicond. Sci. Technol., 7
(1A), A53
–A58
(1992). http://dx.doi.org/10.1088/0268-1242/7/1A/010 SSTEET 0268-1242 Google Scholar
J. A. Udovich et al.,
“Spectral background and transmission characteristics of fiber optic imaging bundles,”
Appl. Opt., 47
(25), 4560
–4568
(2008). http://dx.doi.org/10.1364/AO.47.004560 APOPAI 0003-6935 Google Scholar
G. E. Carver et al.,
“Visible wavelength fiber Bragg grating arrays for high speed biomedical spectral sensing,”
in Advanced Photonics and Renewable Energy,
(2010). Google Scholar
J. E. Midwinter, Optical Fibers for Transmission, 204
–205 John Wiley & Sons, Inc., New York
(1979). Google Scholar
A. T. Harris,
“Spectral mapping tools from the earth sciences applied to spectral microscopy data,”
Cytometry, 69A
(8), 872
–879
(2006). http://dx.doi.org/10.1002/(ISSN)1552-4930 CYTODQ 0196-4763 Google Scholar
A. O. N. Joseph,
“Hyperspectral imaging for detection, diagnosis and staging of cancer,”
(2012). Google Scholar
G. E. Carver et al.,
“High-speed multispectral confocal imaging,”
Proc. SPIE, 8587 858715
(2013). http://dx.doi.org/10.1117/12.2001883 PSISDG 0277-786X Google Scholar
BiographyGary E. Carver completed his doctorate in optical sciences at the University of Arizona in 1980. After a postdoctoral grant from the NSF and CNRS, he applied his expertise in free space and fiber optics at AT&T Bell Labs, OFS Fitel, Princeton Lightwave, and Omega Optical—resulting in over 45 publications and 11 patents. He was named distinguished member of the technical staff at Bell Labs, and is currently director of R&D at Omega. Sarah A. Locknar finished her degree in physical chemistry from Carnegie Mellon in 1999. Since then, she was director of the COBRE in Neuroscience Microscopy and Physiology Core facility at the University of Vermont College of Medicine for about 8 years, overseeing 5 fluorescence microscopy systems. She has been at Omega Optical for 4 years. Her 21 publications are in the areas of Stark effect spectroscopy, molecular modeling, neuroscience, fluorescence imaging, and thin-film optics. William A. Morrison received his BA in sensory psychology from Brown University in 1970. He then held positions at MIT Center for Space Research, Computer Vision Corporation, Wang Laboratories, National Transaction Network, Landmark College and has been an application analyst/developer and database designer at Omega Optical for 8 years. V. Krishnan Ramanujan obtained his doctorate in condensed matter physics research from Inter University Consortium for Department of Atomic Energy Facilities, India. After postdoctoral training in cell biology and biophysics at UT Health Science Center at San Antonio, Texas, he is currently an assistant professor at Cedars-Sinai Medical Center, Los Angeles, California. His laboratory is involved in developing imaging tools and analysis methods for probing energy metabolism in living cells and tissues in vivo. Daniel L. Farkas, a former Fulbright scholar, directed a National Science and Technology Center at Carnegie Mellon Univ. that won the Smithsonian Award for Science. He was a professor of bioengineering at University of Pittsburgh, and vice chairman for research and professor of surgery at Cedars-Sinai Medical Center. He counts 200 publications, 26 international conferences chaired, 11 editorial boards, and several prestigious awards. He (co)founded 10 biomedical startups, currently focusing on three as chairman and CEO. |