|
|
1.IntroductionOptical coherence tomography (OCT) is a rapidly growing noninvasive imaging technique with an increasing number of biomedical applications.1–6 The study of physical processes underlying OCT imaging of different objects is mainly due to the experimental studies. Therefore, the development of a general and fast OCT imaging simulator would greatly facilitate these studies. This advanced simulator would also be a powerful tool to design novel OCT systems with improved performance, e.g., increased depth of imaging. Earlier, we developed fast Monte Carlo methods to compute OCT signals from a turbid multilayered object.7,8 In this article, we generalize our previous work to include objects with arbitrary spatial distributions. Many available OCT simulators7–12 are based on the Monte Carlo simulation of light transport in multilayered turbid media (MCML) that was developed by Wang et al.13 MCML is still a popular simulator. However, its main drawback is its restriction to multilayered media. A simulation of OCT imaging of multilayered objects whose layer boundaries are given by different mathematical functions, instead of planes, was implemented by Kirillin et al.14 This approach to modeling nonplanar multilayered media has been used to simulate OCT imaging of paper,14 human enamel,15 and polarization-sensitive OCT images of human skin.16,17 To develop a simulator of OCT imaging of arbitrary-shaped media, we need to first consider available simulation methods of light transport in such media. Among the first efforts to model arbitrary-shaped media was the cubic voxelization method introduced by Pferer et al.18 In this method, the medium is modeled as a set of voxels with different optical properties.19–21 Another method to model the shape of turbid media uses standard geometrical building blocks such as ellipsoids, cylinders, and polyhedrons.22 A more recent approach to modeling turbid media is based on a surface mesh method proposed by Cote and Vitkin23 and Margallo-Balbas and French.24 In this approach, the surface of every homogeneous region of the turbid media is represented by a surface mesh. But a high-computational cost is involved in locating the intersection of the path of a photon with its enclosing surface mesh. Therefore, Fang proposed a Plücker coordinate system-based, mesh-based Monte Carlo method for fast computation of the location of such intersections.25 To locate the intersection of the path of a photon with the enclosing surface mesh, one needs to find intersections with all planes comprising the surface mesh. If the enclosing surface mesh is convex, then finding such intersections would be considerably simpler. Since a tetrahedron volume is convex with minimum number of planes, its usage as a building block for a surface mesh minimizes the computational cost for simulation of light in arbitrary-shaped media. A Monte Carlo simulator of light transport in arbitrary-shaped media modeled with tetrahedrons is tetrahedron-based inhomogeneous Monte Carlo optical simulator (TIM-OS) that was developed by Shen and Wang.26 Our OCT simulator is based on the TIM-OS code. A comprehensive review of methods to simulate light transport in turbid media can be found in Zhu and Liu.27 2.Photon Tracing in Turbid Media with Tetrahedron-Based MeshIn TIM-OS, each arbitrary-shaped region defined by optical parameters, scattering coefficient , absorption coefficient , refractive index , and anisotropy factor , is divided into a number of tetrahedrons. A large number of successive pencil photon packets are launched into the medium from the origin of a rectangular coordinate system (), where the -axis is normal to the surface of the medium. The initial weights of these photon packets are unity, . A photon packet will travel a distance equal to the mean free path after which it undergoes absorption and scattering. The photon packet rates of absorption and scattering depend on the absorption and scattering coefficients of the regions where this packet is traveling, respectively. If a traveling photon packet enters a region with a different refractive index, then it will undergo both specular reflection and refraction at the boundary between the two regions. Therefore, at each step, we have to check if the packet path and the enclosing tetrahedron intersect. This process is the most computationally demanding part of the simulation. Let the photon packet position be , its direction be , and its mean free-path length be . Therefore, any point on the packet path satisfies , where . Let be the equation of any plane of the enclosing tetrahedron, where is any point on this plane, is its inward normal unit vector, and is its minimum distance from the origin. If the photon packet path intersects any of the enclosing tetrahedron facets, then the distance from the current packet position to the plane will be given by The minimum positive-valued associated with intersections with each tetrahedron plane indicates the point of intersection of the photon packet path and the enclosing tetrahedron. 3.Photon Tracing in Turbid Media with Tetrahedron-Based MeshTime-domain OCT signals consist of three types of photons collected by the probe: (1) ballistic photons that are single scattered, (2) quasiballistic photons that are multiple scattered within the coherence length of the optical source, and (3) multiple scattered photons beyond the coherence length of the optical source. Ballistic and quasiballistic photons contribute to Class I diffusive reflectance. The multiple scattered photons beyond the coherence length contribute to Class II diffusive reflectance. It has been shown that the Class II diffusive reflectance is a fundamental limit for OCT imaging depth.28,29 In our simulator, we used a fiber probe with radius and acceptance angle . To calculate the Class I diffuse reflectance, we define a spatial–temporal indicator function as where is the coherence length of the source, is the distance of the ’th-reflected photon packet from the probe, is the optical path of ’th photon packet, is the angle of the photon packet direction with the -axis, and is the maximum depth reached by the photon packet. Similarly, we can define for Class II diffuse reflectance asWe calculate Class I diffusive reflectance, , and Class II diffusive reflectance, , from a particular depth, , as the weighted mean of these indicator functions An estimate of the variance of these estimations could be calculated as follows: where is the number of simulated photon packets, and is a likelihood ratio due to an importance sampling biasing scheme defined in the next section.4.Importance Sampling for Reducing Computational Time of OCT SignalsImportance sampling is a technique used to reduce the variance of results obtained by Monte Carlo methods using the same number of statistical samples. Therefore, importance sampling could be used to bias a Monte Carlo method to reduce the computational cost of a result with a required accuracy. Light propagating in turbid tissue is usually scattered in the forward direction, i.e., typical turbid tissue has a high-anisotropy factor and the probability of backscattered events is very small. Therefore, a very large number of photon packet simulations are required to estimate OCT signals in a standard, i.e., without importance sampling, Monte Carlo simulation. By properly biasing the scattering direction, we could considerably increase the number of such backscattered events. A photon packet in turbid tissue will scatter according to the Henyey–Greenstein phase function, where is the anisotropy factor, and is the longitudinal angle between the photon packet propagation direction prior to the scattering and its new scattered direction . After sampling from the above distribution, we rotate the scattering direction by an azimuthal angle sampled from uniform distribution from 0 to .The importance sampling technique used in this article is similar to the one described in Lima et al.8 If a photon packet is traveling away from the probe (), then we bias its scattering direction toward the actual position of the probe,, to increase the probability of its detection. For the first biased scattering event, we use the following probability density function to sample the biased longitudinal scattering angle : where is the given bias coefficient in the range [0,1].To maintain unbiased estimates of diffusive reflectance, we assign a compensating likelihood value to this biased scattering event, After the first biased scattering, the photon packet can undergo unbiased scatterings with probability p or other biased scattering with probability1–p. For biased scattering, we sample the longitudinal scattering angle from a Henyey–Greenstein phase function that is oriented toward the actual position of the probe and with anisotropy factor a. For both biased and unbiased scattering events, we use the following likelihood function: After the tracing of a photon packet ends, due to its collection by the probe, its exit from the medium or being absorbed by it, the total likelihood of the photon packet is calculated. This total likelihood is the product of all likelihood values assigned to all scattering events undergone by the photon packet. If , another packet with initial likelihood value of will be launched from the previous first scattering event position with a direction sampled from the unbiased Henyey–Greenstein phase function.8 5.Implementation and Validation of Our OCT SimulatorWe implemented our OCT simulator in American National Standards Institute (ANSI)-C and used a random number generator included in the GNU scientific library (GSL).30 We used an optical fiber probe with radius 1 μm, acceptance angle 5 deg, and an optical source with coherence length . We also implemented the importance sampling scheme described above with bias coefficient and additional bias probability , respectively. We ran our simulations on a 2 GHz Intel Core i7 CPU with 4 GB of RAM. Each A-scan simulation used photon packets. Our simulation results were validated by comparing them with results obtained from the previously verified OCT simulators for multilayered media by Yao and Wang9 and Lima et al.8 Since the simulator by Yao and Wang9 does not use the advanced importance sampling method in Sec. 4, photon packets were used to obtain results with comparable accuracy. 5.1.Simulation of OCT Signal from a Multilayered ObjectAs a multilayered object, we used a medium consisting of four layers with optical properties, as shown in Table 1, similar to objects used in Refs. 7–9. In our novel tetrahedron-based simulator, this multilayered object was divided into 9600 tetrahedrons that resulted in 2205 vertices. Table 1Optical parameters of the multilayered object used to validate our new tetrahedron-based OCT simulator.
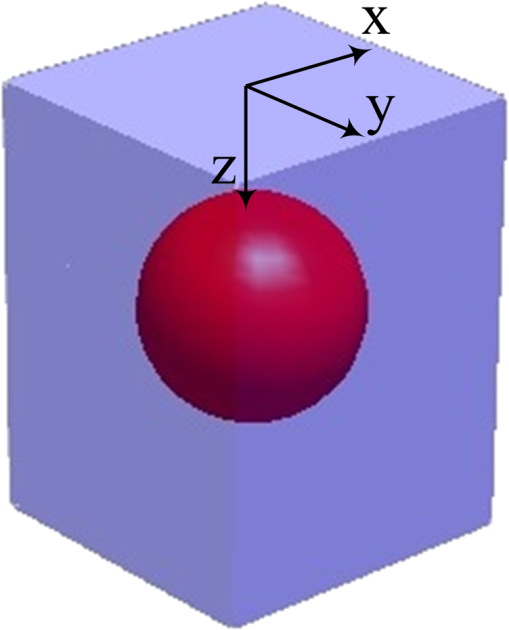
Figures 1 and 2 show the A-scans obtained from our object using two previously validated OCT simulators for multilayered objects and our novel tetrahedron-based OCT simulator for arbitrary-shaped objects. As seen in Figs. 1 and 2, the results from the three simulators are in excellent agreement, which validates the results from our new simulator. One would expect the computational cost to simulate OCT signals from a multilayered object using a tetrahedron-based simulator would be higher than using a layer-based one. The layer-based simulator by Lima et al.8 took 24 min to calculate Class I and Class II diffusive reflectances for a single A-scan, whereas our new tetrahedron-based simulator took 43 min. Fig. 1A-scan of Class I diffusive reflectance from the multilayered object above. The green and blue lines are results from the previously validated layered-based OCT simulators by Yao and Wang9 and Lima et al.,8 respectively. The red line represents the Class I signal of our novel tetrahedron-based OCT simulator. 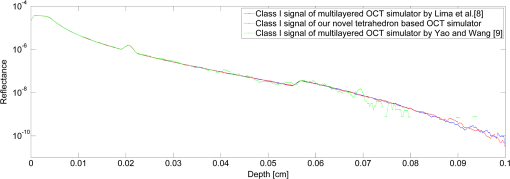 Fig. 2A-scan of Class II diffusive reflectance from the multilayered object above. The green and blue lines are results from the previously validated layered based OCT simulators by Yao and Wang9 and Lima et al.8 respectively. The red line represents the Class II signal of our novel tetrahedron-based OCT simulator. 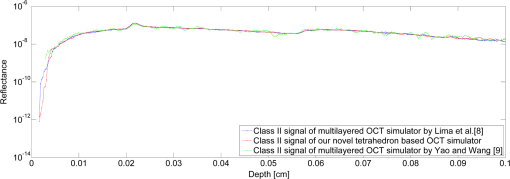 5.2.Simulation of OCT Signal from a Nonlayered ObjectTo demonstrate the ability of our new OCT simulator to simulate signals from nonlayered objects, we simulate OCT imaging of a sphere inside a homogeneous slab. As shown in Fig. 3, we placed a sphere of radius 0.1 mm, at depth 0.2 mm, inside a slab with lateral dimensions and 1 mm axial dimension. The optical properties of this nonlayered object are shown in Table 2. Table 2Optical parameters of the nonlayered object used in our new tetrahedron-based OCT simulator.
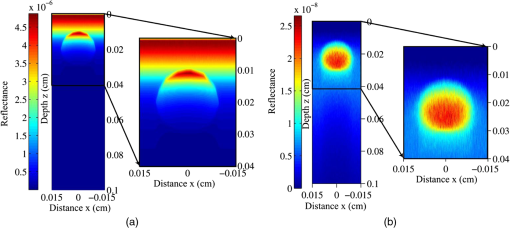
We used the mesh generator NETGEN31 to generate 4437 tetrahedrons and 800 vertices to represent our nonlayered object. To obtain an OCT B-scan, we simulated 512 equidistant A-scans along the -axis from to . A depiction of these tetrahedrons and the imaged cross-section of the object are shown in Fig. 4. The simulation of a complete B-scan took approximately 360 h on our computer. Fig. 4A depiction of the tetrahedrons representing our nonlayered object. The solid black lines shown in the imaged cross-section (B-scan) depict intersections of these tetrahedrons with the imaging cross-section. 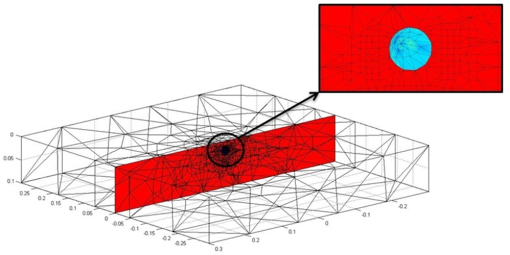 Figures 5(a) and 5(b) show the simulated B-scan OCT images from our nonlayered object, each comprised 512 A-scans along the -axis. Figure 5(a) represents the Class I OCT signal resulting from single-scattered photons, while Fig. 5(b) represents the Class II OCT signal resulting from multiple-scattered photons. We note that the Class I diffusive reflectance-based image in Fig. 5(a) closely resembles the object, a sphere inside a slab. Also, as expected, being an image based on single-scattered light, its intensity is considerably reduced as the imaging depth increases. From Fig. 5(b), we note that, as expected, the intensity of the Class II diffusive reflectance increases with depth, particularly inside the sphere, but as the imaging depth increases, it gets weaker due to absorption. All these results are as one would expect from a physical OCT, which further validates our new simulator. 5.3.Resolution, Accuracy, and Computation Time of Our OCT SimulatorIn the following subsections, we discuss three important aspects of our simulator: (1) resolution, (2) accuracy, and (3) computation time. 5.3.1.Simulation resolutionThe lateral resolution of physical OCT systems depends on the used wavelength and numerical aperture of the imaging optics. Our simulated lateral resolution of a B-scan is, however, equal to the distance between our simulated A-scans. Figures 6(a) and 6(b) show the simulated Class I and Class II B-scans of our nonlayered object using 75 equidistant A-scans, along the -axis from to . These B-scans have a lower lateral-simulated resolution than the B-scans, comprised 512 A-scans, as shown in Fig. 5. As shown in Fig. 6, the sphere is still distinguishable despite the lower lateral simulation resolution. As the computation time to simulate a B-scan is linearly related to the number of simulated A-scans, the results in Fig. 6 were obtained in approximately 53 h. Therefore, the lateral-simulated resolution, i.e., the number of A-scans to simulate, should be chosen depending on the object of interest. Fig. 6Simulated (a) Class I and (b) Class II reflectance-based B-scan OCT images of our nonlayered object using 75 A-scans. 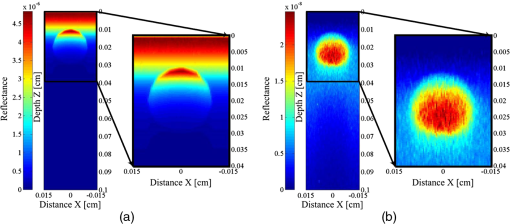 The axial resolution of physical OCT systems is approximately equal to the coherence length of the optical source. Our simulated axial resolution of an A-scan is, however, determined according to the Eq. (3). If a collected photon has traveled an optical distance and has reached a maximum depth, , satisfies the conditions or we classify it as Class I or Class II photon, respectively. Next, we assign a depth, , to this photon which satisfies the following inequality according to Eq. (3):Normally, one would assign a single A-scan pixel to represent this depth range. Our simulator, however, allows over sampling of simulation depth by dividing the depth range in Eq. (12) into a number of subresolution depth ranges and then assigning an additional pixel to each of these subresolution depth ranges. Therefore, our simulated axial resolution depends on the coherence length of the source, similar to physical OCT systems, and on the defined number of subresolution depth ranges, i.e., the required oversampling ratio. We used an oversampling ratio of 6 in all our simulations above. As our simulation computation time is dominated by the number of simulated photons, rather than the coherence length or oversampling ratio, any simulated axial resolution value will have a negligible impact on computation time. 5.3.2.Simulation accuracyAnother very important aspect of our simulator is the accuracy of its results. The accuracy of Monte Carlo simulations is generally quantified by the variance of obtained results. In Fig. 7(a), we show estimates using different number of photons of Class I signals of an A-scan of our nonlayered object, in addition to confidence intervals (CIs) of these estimates. The CI of Class I and Class II signal estimates , is defined as Fig. 7(a) Class I signal estimates and their confidence intervals, (b) signal-to-computational-noise ratios of Class I signal estimates, and (c) signal-to-computational-noise of Class I signal estimates using importance sampling with and photons and without importance sampling using photons. 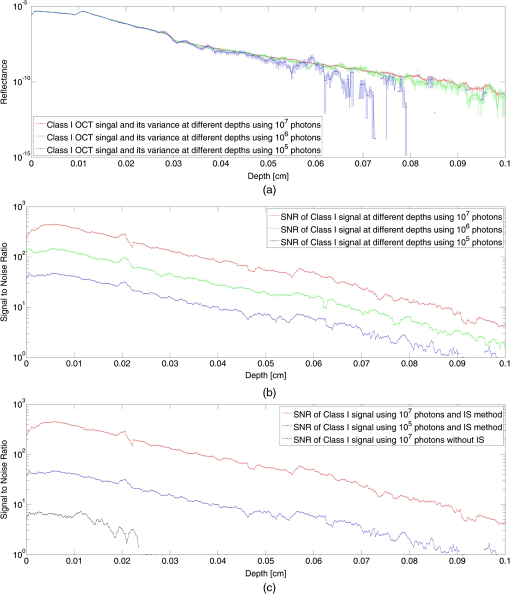 We note from Fig. 7(a) that as the depth increases, the CIs increase relative to the signal values. Therefore, as reported by Yao and Wang,9 the accuracy of our signal estimates relative to signal values decreases with depth. Another measure of the accuracy of our estimated Class I and Class II signals is the signal-to-computational-noise-ratio, which is given by In Fig. 7(b), we show signal-to-computational-noise-ratios, , of Class I signal estimates, using different number of photons, of an A-scan () of our sphere inside a slab object. We note from Fig. 7(b) that, as expected in Monte Carlo simulations, the signal-to-computational-noise-ratio is proportional to the square root of the number of simulated photons, , i.e., We also note that our simulation computation time is linearly proportional to . To illustrate the effect of our importance sampling technique, in Fig 7(c), we compare the signal-to-computational-noise-ratio of three A-scans (Class I) at of our sphere inside a slab object. Two of these A-scans were obtained with our importance sampling technique using and photons. The third A-scan was obtained using photons but without using importance sampling. As seen in Fig 7(c), our importance sampling technique has improved the accuracy of the simulation by approximately 100 times. 5.3.3.Simulation computation timeDifferent approaches could be used to reduce the computation time of our simulations. First, we could simulate a smaller number of A-scans, which would result in reduction of lateral resolution in the simulated B-scan images. Second, we could use a smaller number of launched photons per A-scan, which would result in simulation results with lower accuracy. Third, because the inherently parallel nature of Monte Carlo simulations, we could reduce our simulation time by implementing our simulator on graphics processor units (GPUs). Simulations of light transportation in turbid media32–34 and of OCT in multilayered media35 have been implemented on GPUs using the compute unified device architecture (CUDA) programming language. In addition to parallel implementation, a hardware implementation on field-programmable gate array (FPGA) of simulation of light transport in turbid media has been shown to reduce computation time.36 This FPGA-based approach could also be used to reduce computation time of our simulator. 6.ConclusionsWe developed a novel Monte Carlo-based simulator of OCT imaging for turbid media with arbitrary spatial distributions. This simulator allows computation of both Class I and Class II diffusive reflectance-based OCT images. It was implemented using a tetrahedron-based mesh that allows modeling of an arbitrary-shaped medium with a desired accuracy. This mesh also reduces the computation cost required to obtain the intersection of a photon path with its enclosing tetrahedron. We used Monte Carlo importance sampling to significantly increase the probability of a photon reaching the optical detector, thereby reducing simulation time. Our simulation results were verified by comparing them to results from two previously validated OCT simulators for multilayered media. We also presented simulation results for OCT imaging of a sphere inside a background slab, which would not have been possible with earlier simulators. We also discussed the resolution and accuracy of our simulator and suggested different ways to reduce computation time. Our simulator could be used to study important OCT phenomena and to design novel OCT systems with improved performance. As future work, we plan to implement our simulator on GPUs using the CUDA programming language, as well as develop a similar simulator for swept-source OCT systems. ReferencesW. DrexlerJ. G. Fujimoto, Optical Coherence Tomography, Springer, Berlin, New York
(2008). Google Scholar
D. P. Popescuet al.,
“Optical coherence tomography: fundamental principles, instrumental designs and biomedical applications,”
Biophys. Rev., 3
(3), 155
–169
(2011). http://dx.doi.org/10.1007/s12551-011-0054-7 1793-0480 Google Scholar
J. Welzel,
“Optical coherence tomography in dermatology: a review,”
Skin Res. Technol., 7
(1), 1
–9
(2001). http://dx.doi.org/10.1034/j.1600-0846.2001.007001001.x 0909-752X Google Scholar
M. C. Pierceet al.,
“Advances in optical coherence tomography imaging for dermatology,”
J. Invest. Dermatol., 123
(3), 458
–463
(2004). http://dx.doi.org/10.1111/jid.2004.123.issue-3 JIDEAE 0022-202X Google Scholar
W. Drexleret al.,
“Ultrahighresolution ophthalmic optical coherence tomography,”
Nat Med., 7
(4), 502
–507
(2001). http://dx.doi.org/10.1038/86589 1078-8956 Google Scholar
A. F. Fercheret al.,
“In vivo optical coherence tomography,”
Am. J. Ophthalmol., 116
(1), 113
–114
(1993). AJOPAA 0002-9394 Google Scholar
I. LimaA. KalraS. Sherif,
“Improved importance sampling for Monte Carlo simulation of time-domain optical coherence tomography,”
Biomed. Opt. Express, 2
(5), 1069
–1081
(2011). http://dx.doi.org/10.1364/BOE.2.001069 BOEICL 2156-7085 Google Scholar
I. Limaet al.,
“Fast calculation of multipath diffusive reflectance in optical coherence tomography,”
Biomed. Opt. Express, 3
(4), 692
–700
(2012). http://dx.doi.org/10.1364/BOE.3.000692 BOEICL 2156-7085 Google Scholar
G. YaoL. Wang,
“Monte Carlo simulation of an optical coherence tomography signal in homogeneous turbid media,”
Phys. Med. Biol., 44
(9), 2307
–2320
(1999). http://dx.doi.org/10.1088/0031-9155/44/9/316 PHMBA7 0031-9155 Google Scholar
A. Tychoet al.,
“Derivation of a Monte Carlo method for modeling heterodyne detection in optical coherence tomography systems,”
Appl. Opt., 41
(31), 6676
–6691
(2002). http://dx.doi.org/10.1364/AO.41.006676 APOPAI 0003-6935 Google Scholar
R. K. Wang,
“Signal degradation by multiple scattering in optical coherence tomography of dense tissue: a Monte Carlo study towards optical clearing of biotissues,”
Phys. Med. Biol., 47
(13), 2281
–2299
(2002). http://dx.doi.org/10.1088/0031-9155/47/13/307 PHMBA7 0031-9155 Google Scholar
M. Yu. Kirillinet al.,
“Monte Carlo simulation of optical clearing of paper in optical coherence tomography,”
Quantum Electron., 36
(2), 174
–180
(2006). http://dx.doi.org/10.1070/QE2006v036n02ABEH013120 QUELEZ 1063-7818 Google Scholar
L. WangS. L. JacquesL. Zheng,
“MCML—Monte Carlo modeling of light transport in multi-layered tissues,”
Comput. Methods Programs Biomed., 47
(2), 131
–146
(1995). http://dx.doi.org/10.1016/0169-2607(95)01640-F CMPBEK 0169-2607 Google Scholar
M. Yu. Kirillinet al.,
“Visualization of paper structure by optical coherence tomography: Monte Carlo simulations and experimental study,”
J. Europ. Opt. Soc. Rap. Public., 2 07031
(2007). http://dx.doi.org/10.2971/jeos.2007.07031 1990-2573 Google Scholar
B. Shiet al.,
“Monte Carlo modeling of human tooth optical coherence tomography imaging,”
J. Opt., 15
(7), 075304
(2013). http://dx.doi.org/10.1088/2040-8978/15/7/075304 JOOPDB 0150-536X Google Scholar
M. Kirillinet al.,
“Simulation of optical coherence tomography images by Monte Carlo modeling based on polarization vector approach,”
Opt. Express, 18
(21), 21714
–21724
(2010). http://dx.doi.org/10.1364/OE.18.021714 OPEXFF 1094-4087 Google Scholar
I. Meglinskiet al.,
“Simulation of polarization-sensitive optical coherence tomography images by a Monte Carlo method,”
Opt. Lett., 33
(14), 1581
–1583
(2008). http://dx.doi.org/10.1364/OL.33.001581 OPLEDP 0146-9592 Google Scholar
T. Pfeferet al.,
“A three-dimensional modular adaptable grid numerical model for light propagation during laser irradiation of skin tissue,”
IEEE J. Sel. Top. Quantum Electron., 2
(4), 934
–942
(1996). http://dx.doi.org/10.1109/2944.577318 IJSQEN 1077-260X Google Scholar
T. Binzoniet al.,
“Light transport in tissue by 3D Monte Carlo: influence of boundary voxelization,”
Comput. Methods Programs Biomed., 89
(1), 14
–23
(2008). http://dx.doi.org/10.1016/j.cmpb.2007.10.008 CMPBEK 0169-2607 Google Scholar
D. Boaset al.,
“Three dimensional Monte Carlo code for photon migration through complex heterogeneous media including the adult human head,”
Opt. Express, 10
(3), 159
–170
(2002). http://dx.doi.org/10.1364/OE.10.000159 OPEXFF 1094-4087 Google Scholar
T. Li,
“MCVM: Monte Carlo modeling of photon migration in voxelized media,”
J. Innov. Opt. Health Sci., 3
(2), 91
–102
(2010). http://dx.doi.org/10.1142/S1793545810000927 JIOHAA 1793-7205 Google Scholar
H. Liet al.,
“A mouse optical simulation environment (MOSE) to investigate bioluminescent phenomena in the living mouse with the Monte Carlo method,”
Acad. Radiol., 11
(9), 1029
–1038
(2004). http://dx.doi.org/10.1016/j.acra.2004.05.021 1076-6332 Google Scholar
D. CoteI. Vitkin,
“Robust concentration determination of optically active molecules in turbid media with validated three-dimensional polarization sensitive Monte Carlo calculations,”
Opt. Express, 13
(1), 148
–163
(2005). http://dx.doi.org/10.1364/OPEX.13.000148 OPEXFF 1094-4087 Google Scholar
E. Margallo-BalbsP. J. French,
“Shape based Monte Carlo code for light transport in complex heterogeneous tissues,”
Opt. Express, 15
(21), 14086
–14098
(2007). http://dx.doi.org/10.1364/OE.15.014086 OPEXFF 1094-4087 Google Scholar
Q. Fang,
“Mesh-based Monte Carlo method using fast ray-tracing in Plücker coordinates,”
Biomed. Opt. Express, 1
(1), 165
–175
(2010). http://dx.doi.org/10.1364/BOE.1.000165 BOEICL 2156-7085 Google Scholar
H. ShenG. Wang,
“A tetrahedron-based inhomogeneous Monte Carlo optical simulator,”
Phys. Med. Biol., 55
(4), 947
–962
(2010). http://dx.doi.org/10.1088/0031-9155/55/4/003 PHMBA7 0031-9155 Google Scholar
C. ZhuQ. Liu,
“Review of Monte Carlo modeling of light transport in tissues,”
J. Biomed. Opt., 18
(5), 050902
(2013). http://dx.doi.org/10.1117/1.JBO.18.5.050902 JBOPFO 1083-3668 Google Scholar
M. J. YadlowskyJ. M. SchmittR. F. Bonner,
“Multiple scattering in optical coherence microscopy,”
Appl. Opt., 34
(25), 5699
–5707
(1995). http://dx.doi.org/10.1364/AO.34.005699 APOPAI 0003-6935 Google Scholar
M. Y. KirillinA. V. PriezzhevR. A. Myllylä,
“Role of multiple scattering in formation of OCT skin images,”
Quantum Electron., 38
(6), 570
–575
(2008). http://dx.doi.org/10.1070/QE2008v038n06ABEH013842 QUELEZ 1063-7818 Google Scholar
The Gnu Project, “Gnu scientific library,”
(2013) http://www.gnu.org/s/gsl/ November ). 2013). Google Scholar
J. Schoberl,
“NETGEN an advancing front 2D/3D-mesh generator based on abstract rules,”
Comput. Visual. Sci., 1
(1), 41
–52
(1997). http://dx.doi.org/10.1007/s007910050004 CVSCFY 1432-9360 Google Scholar
E. AlerstamT. SvenssonS. Andersson-Engels,
“Parallel computing with graphics processing units for high-speed Monte-Carlo simulation of photon migration,”
J. Biomed. Opt., 13
(6), 060504
(2008). http://dx.doi.org/10.1117/1.3041496 JBOPFO 1083-3668 Google Scholar
Q. FangD. A. Boas,
“Monte-Carlo simulation of photon migration in 3D turbid media accelerated by graphics processing units,”
Opt. Express, 17
(22), 20178
–20190
(2009). http://dx.doi.org/10.1364/OE.17.020178 OPEXFF 1094-4087 Google Scholar
T. S. LeungS. Powell,
“Fast Monte Carlo simulations of ultrasound-modulated light using a graphics processing unit,”
J. Biomed. Opt., 15
(5), 055007
(2010). http://dx.doi.org/10.1117/1.3495729 JBOPFO 1083-3668 Google Scholar
A. KalraI. Lima Jr.S. Sherif,
“Almost instantaneous Monte Carlo calculation of optical coherence tomography signal using graphic processing unit,”
in Proceedings of IEEE Photonics Conference (IPC) 2013,
(2013). Google Scholar
W. C. Y. Loet al.,
“Hardware acceleration of a Monte Carlo simulation for photodynamic therapy treatment planning,”
J. Biomed. Opt., 14
(1), 014019
(2009). http://dx.doi.org/10.1117/1.3080134 JBOPFO 1083-3668 Google Scholar
BiographySiavash Malektaji received his BSc degree in computer engineering from K. N. Toosi University of Technology, Tehran, Iran, in 2011. He is currently pursuing his MSc degree in electrical and computer engineering at the University of Manitoba, Winnipeg, Canada. His research interests include optical coherence tomography (OCT) and Monte Carlo methods. Ivan T. Lima Jr. received his PhD degree in electrical engineering from the University of Maryland, Baltimore County, USA, in 2003. He is an associate professor with tenure in the Department of Electrical and Computer Engineering at North Dakota State University. His research interests include optical communications and biomedical engineering. He is a member of SPIE, and he is also a senior member of the IEEE Photonics Society and the IEEE EMBS. Sherif S. Sherif received his PhD degree in optics from the University of Colorado-Boulder, Boulder, Colorado, and an MS degree in digital image processing from the University of Wisconsin-Madison, Madison, Wisconsin. After postdoctoral training at University of Oxford and Imperial College London, he was a lecturer at the University of Kent, UK. He is currently an associate professor of electrical engineering at the University of Manitoba, Winnipeg, Canada. He has over 75 scientific publications, 3 patents, and he was the recipient of 3 teaching awards. |

