|
|
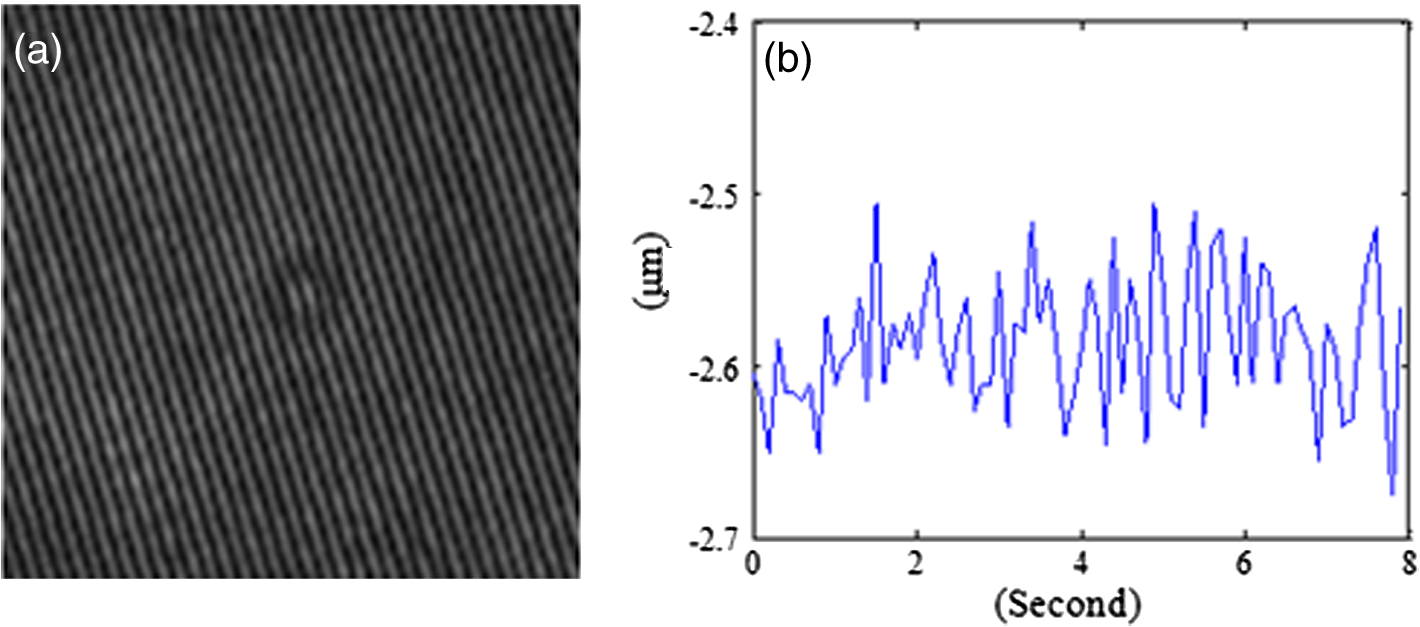
1.IntroductionMotility is a major characteristic of living cells, and it includes the form of movement of cells as well as movement within cells. Understanding the origin of cellular or intracellular motility provides information about the functional status of cells. A wide variety of cells, such as fibroblasts, amoeba, etc., move by means of crawling over substrate, and cell substrate interactions play a crucial role in the migratory behavior of these adhesive cells. A cell must exert a propulsive force to overcome friction and move along a surface, and accurate measurements of the magnitude and direction of traction forces are needed to understand cell motility. These forces are known to be able to deform flexible substrates. Knowledge of substrate elasticity, such as stiffness, and optical measurement of substrate distortion can then be combined to obtain estimates of the traction forces of cells. Digital holography microscopy (DHM) is an emerging technology of a new paradigm in general imaging and biomedical applications.1,2 Various techniques of DHM, including the quantitative phase microscopy by digital holography (DH-QPM), have been proven to be potent tools for cellular microscopy. DH-QPM allows measurement of optical thickness with nanometer-scale accuracy by single shot, wide-field acquisition, and it yields phase profiles without some of the complications of other phase imaging methods. The phase image is immediately and directly available on calculating the two-dimensional complex array of the holographic image, and the phase profile conveys quantitative information about the physical thickness and index of refraction of cells. DH-QPM has been applied to quantitatively image and analyze living cells in a collagen matrix.3,4 Phase profiles of the shape change of cardiomyocytes have been evaluated to yield quantitative parameters characterizing the cell dynamics.5 We have recently utilized DH-QPM to study the wrinkling of a silicone rubber film by motile fibroblasts.6 The wrinkle formation has been visualized, quantitative measures of surface deformation have been extracted, and cellular traction force has been estimated in a direct and straightforward manner. A nonwrinkling substrate, collagen-coated polyacrylamide (PAA), was also employed to make direct measurement of elastic deformations, albeit at discrete locations.7 The Young’s modulus of PAA can be adjusted by controlling the concentrations of the monomer and crosslinker. DH-QPM, with its capacity of yielding quantitative measures of deformation directly, has been employed to measure the Young’s modulus of PAA,8 which provided a very effective process for achieving high-precision quantitative phase microscopy. When cells are cultured on substrates of identical chemical properties but different rigidities, they are able to detect and respond to substrate stiffness by showing various motility patterns and morphologies.9 The substrate then generates deformation due to the traction forces exerted by cells. We have utilized DH-QPM to study motile fibroblasts deforming PAA gel,10 where the cell substrate adhesion has been visualized and quantitative measures of surface deformation have been extracted. The substrate stiffness and quantitative measures of substrate deformation have been combined to produce estimates of the traction forces and characterize how these forces vary depending on the substrate rigidity. DH-QPM is thus shown to be an effective approach for measuring the traction forces of cells cultured on elastic substrate. Three-dimensional profiling and tracking by digital holography provide label-free, quantitative analysis on the characteristics and dynamic process of objects. Kempkes et al. have utilized digital in-line holography (DIH) to image and analyze short and straight fibers in suspension in a three-dimensional volume.11 Microfluidic phenomena have been studied by DIH, and as indicators of the flow pattern, the trajectories and velocities of latex microspheres and red blood cells have been measured in three-dimensional volume and time.12 A three-dimensional distribution of polystyrene spheres has been obtained by deconvolution of three-dimensional reconstruction of a hologram.13 Red blood cells and HT-1080 fibrosarcoma cells in a collagen tissue model have been tracked in three dimensions by evaluating quantitative phase profiles by DH-QPM.4 Three-dimensional localization of weakly scattering objects in DHM has been presented by Rayleigh-Sommerfeld back-propagation method.14 Helical trajectories of human sperm within a large volume have been tracked and analyzed by DHM, and the statistics information of the swim path, pattern, speed, etc., were revealed.15 In this paper, specimens of suspended polymer microspheres and curved microfibers are visualized in three dimensions; and the corresponding characteristics are investigated quantitatively. Free-swimming cells, such as chilomonas, paramecium, etc., sense and respond to their surroundings by swimming toward or away from stimuli. These moving microbes are tracked in three dimensions and as a function of time by DHM without need for mechanical focus adjustment. Moreover, for a sample consists of cells and suspended microfibers, the displacement of fibers due to interaction with swimming cells in three dimensions is monitored by DHM. The main results we are reporting here are: (1) demonstration of DHM technique for three-dimensional profiling of a curved fiber structure. There are few publications of 3-D localization of fibers, and the fibers reported are all short and straight segments.11 We are the first to report on three-dimensional localization of arbitrary-shaped fiber structures; (2) introduction of differential holography as a method to three-dimensional or four-dimensional image the changing position of a microbe or fiber. Many groups12,16 have utilized differential holography method to imaging or tracking particles/cells; however, more complicated structures such as arbitrary-shaped fibers have not been studied in this method yet; and (3) application of the method to mechanical interaction between a microbe and fiber. In the study of cell-environment interaction by DHM, the 3-D trajectory of a free-swimming copepod and the complex flow around it has been performed and polystyrene spheres were seeded as the marker of the flow.17 On the other hand, we are the first to monitor the interaction between a cell and fiber, which includes more complicated structures. The effectiveness of this method is quantified in terms of the maximum number and speed of the moving cells that can be tracked, as well as the direction of the motion (lateral and axial). The results from this work can be further used to implement an optical trap that can automatically track and capture cells with specified characteristics, such as speed, size, or shape. 2.ApparatusThe DHM setup used in this work is illustrated in Fig. 1. It consists of a Mach–Zehnder interferometer illuminated with a HeNe laser.1,2 The object arm contains a sample stage and a microscope objective that projects a magnified image of the object onto a charge-coupled device (CCD) camera. The reference arm similarly contains MO2, so that the holographic interference pattern contains fringes due to interference between the diffracted object field and the off-axis reference field. The numerical aperture of the microscope objectives is 0.25 and the magnification is . The specification of CCD is , and the pixel size is . The captured holographic image is numerically converted into Fourier domain to obtain the angular spectrum1,2 and a spatial filter is then applied to retain the real image peak alone. The filtered angular spectrum is propagated to appropriate distance, and by an inverse Fourier transform, reconstructed as an array of complex numbers containing the amplitude and phase images of the sample. A background image without objects on the sample stage is first recorded by DHM. In the experiment, aberrations and background distortions of the optical field are minimized by subtracting the background image.1,2,18,19 3.Experiments and Results3.1.Three-Dimensional Localization of Suspended MicrospheresIn combination with microscopy, DHM is able to produce single hologram containing all the information about the three-dimensional structure of micro-scale objects. In a first experiment, the applicability of DHM and autofocusing algorithm is investigated by performing three-dimensional profiling of polymer microspheres (Type 7510A, Duke Scientific Corporation, Palo Alto, California, mean diameter 9.6 μm). Figure 2(a) presents the hologram of microspheres in suspension captured by DHM. Angular spectrum method1,2 is applied and the reconstructed amplitude image is shown in Fig. 2(b) where several in-focus and out-of-focus microspheres are seen at this reconstruction plane. The field of view is with . The microsphere focuses the incoming light and forms a bright spot along the optical path. Therefore, the pattern of the microsphere appears to have a maximum intensity at the center near the in-focus plane and the surrounding is dark. Then, an autofocusing algorithm based on peak searching can be applied to identify the in-focus position of each particle. Fig. 2Three-dimensional profiling of suspended microspheres. Field of view of (a)–(d) is with . (a) hologram; (b) amplitude image; (c) all-in-focus intensity profile; (d) depth position profile; (e) three-dimensional profile () and grey-scale representation of intensity; (f) view of three-dimensional profile (); and (g) view of three-dimensional.  The hologram is numerically reconstructed in longitudinal direction from 100 μm to , in steps. The autofocusing algorithm is then applied by searching on the reconstructed images for the planes that contain the objects with the peak and sharpest details to establish the all-in-focus profile.20 At each pixel, the intensity variation in longitudinal direction is investigated to find out the peak intensity. The peak intensity value becomes a pixel of an in-focus profile and its location in longitudinal direction is recorded as a corresponding depth map value. The combination of all-in-focus intensity profiles Fig. 2(c) and the corresponding depth maps Fig. 2(d) enables to produce the three-dimensional visualization of microspheres and a threshold on the intensity allows for distinguishing objects from other elements, illustrated in Fig. 2(e). In fact, we take every center position of brightest points in Fig. 2(c) as locations of particles and Fig. 2(d) is used to determine the -location of those particles identified in Fig. 2(c). Figure 2(d) is mostly noisy and information of only the locations where the particles are present is actually used. Figures 2(f)–2(h) show the , , and views of the three-dimensional profile, respectively. This straightforward autofocusing algorithm is able to determine focal planes for all the objects in the reconstructed volume automatically. The combination of depth map and axial position of objects allows for quantitative three-dimensional profiling. The accuracy of this measurement system was estimated using a microsphere (2 μm) fixed on a glass slide.21 A series of holograms of the fixed particle was recorded at 10 fps, up to 8 s. Figure 3(a) is one hologram of the fixed particle and Fig. 3(b) shows the temporal changes for the measured positions of the particle in a step of 0. 005 μm. The standard deviation of the measured positions is estimated to be 0.039 μm, which is the depth accuracy of the system. 3.2.Three-Dimensional Profiling of Stationary MicrofibersNonwoven and randomly oriented microfibers were spun onto glass coverslips from co-poly (, ) (PLEY) dissolved in water and crosslinked as described previously.22 The diameter of fibers is 0.2–5.0 μm. Figure 4(a) presents a hologram of microfiber. The angular spectrum method is applied to obtain the reconstructed amplitude image in Fig. 4(b). The microfiber appears curved and elongated, consistent with our previous work.22 The field of view is with . The hologram is then reconstructed from to , in steps. Adding these 201 reconstructed images of amplitude yields the axial projection shown in Fig. 4(c). The final image has the same number of pixels as each reconstructed image. The projected image is converted into binary by threshold and segmentation, shown in Fig. 4(d). The binary image is then axially back-projected along the path of amplitude over the set of reconstructed images. Fig. 4Three-dimensional profiling of stationary microfibers. The field of view of (a)–(f) is with . (a) hologram; (b) amplitude image; (c) projection image; (d) binary image, microfiber 1 and background 0; (e) all-in-focus intensity profile; (f) depth position profile; (g) three-dimensional profile () and gray-scale representation of intensity; (h) three-dimensional fit (); (i) view of three-dimensional fit (); (j) view of three-dimensional fit (); and (k) view of three-dimensional fit ().  We apply the same autofocusing algorithm on the resultant images to record the maximum intensity value at each pixel along the reconstruction direction and the axial and depth position of where the maximum intensity occurred at the same time. The obtained all-in-focus intensity profile Fig. 4(e) and the corresponding depth map Fig. 4(f) are then combined to generate the three-dimensional visualization of microfiber and a threshold on intensity is chosen to highlight the area of regional interest. However, there still exist noisy point clouds resulted from noise in the three-dimensional profile Fig. 4(g). To address this, an average and polynomial curve-fitting algorithm accounting for errors is adopted. The fitted line of the point clouds (standard deviations in the and directions are 0.21 and 0.06 μm) in the three-dimensional coordinate is present in Fig. 4(h). Figures 4(i)–4(k) show the , , and views of the three-dimensional profile, respectively. coordinate provides the depth information of real image of microfiber in the reconstruction volume. The length of the microfiber in three-dimensional volume is determined from , , and coordinates of real image of microfiber, that is 126 μm. 3.3.Four-Dimensional Motility Tracking of a Moving Chilomonas CellChilomonas are fast-moving cells, which sense and respond to their surroundings by swimming towards or away from stimuli. A time-lapse hologram movie of the movement of chilomonas was recorded at 30 fps (Video 1). The field of view is with . An excerpt of 14 frames is taken and the difference between consecutive hologram pairs is calculated pixel by pixel to eliminate background structure and retain only the object information, where is the ’th hologram of selected frames. The resulting seven different holograms (from a total of 14) are then summed into a single hologram Fig. 5(a), which contains all the information on moving cells.16 Reconstruction by the angular spectrum method is applied on the resultant hologram and Fig. 5(b) is the amplitude image reconstructed at the specific plane . Fig. 5Four-dimensional tracking of a moving chilomonas cell (Video 1, MOV, 188 KB) [URL: http://dx.doi.org/10.1117/1.JBO.19.4.045001.1]. The field of view of (a)–(d) is with . (a) difference hologram; (b) amplitude image; (c) all-in-focus intensity profile; (d) depth position profile; (e) three-dimensional profile of the trajectory of the cell () and gray-scale representation of intensity. (f) view of three-dimensional trajectory (); (g) view of three-dimensional trajectory (); and (h) view of three-dimensional trajectory (). 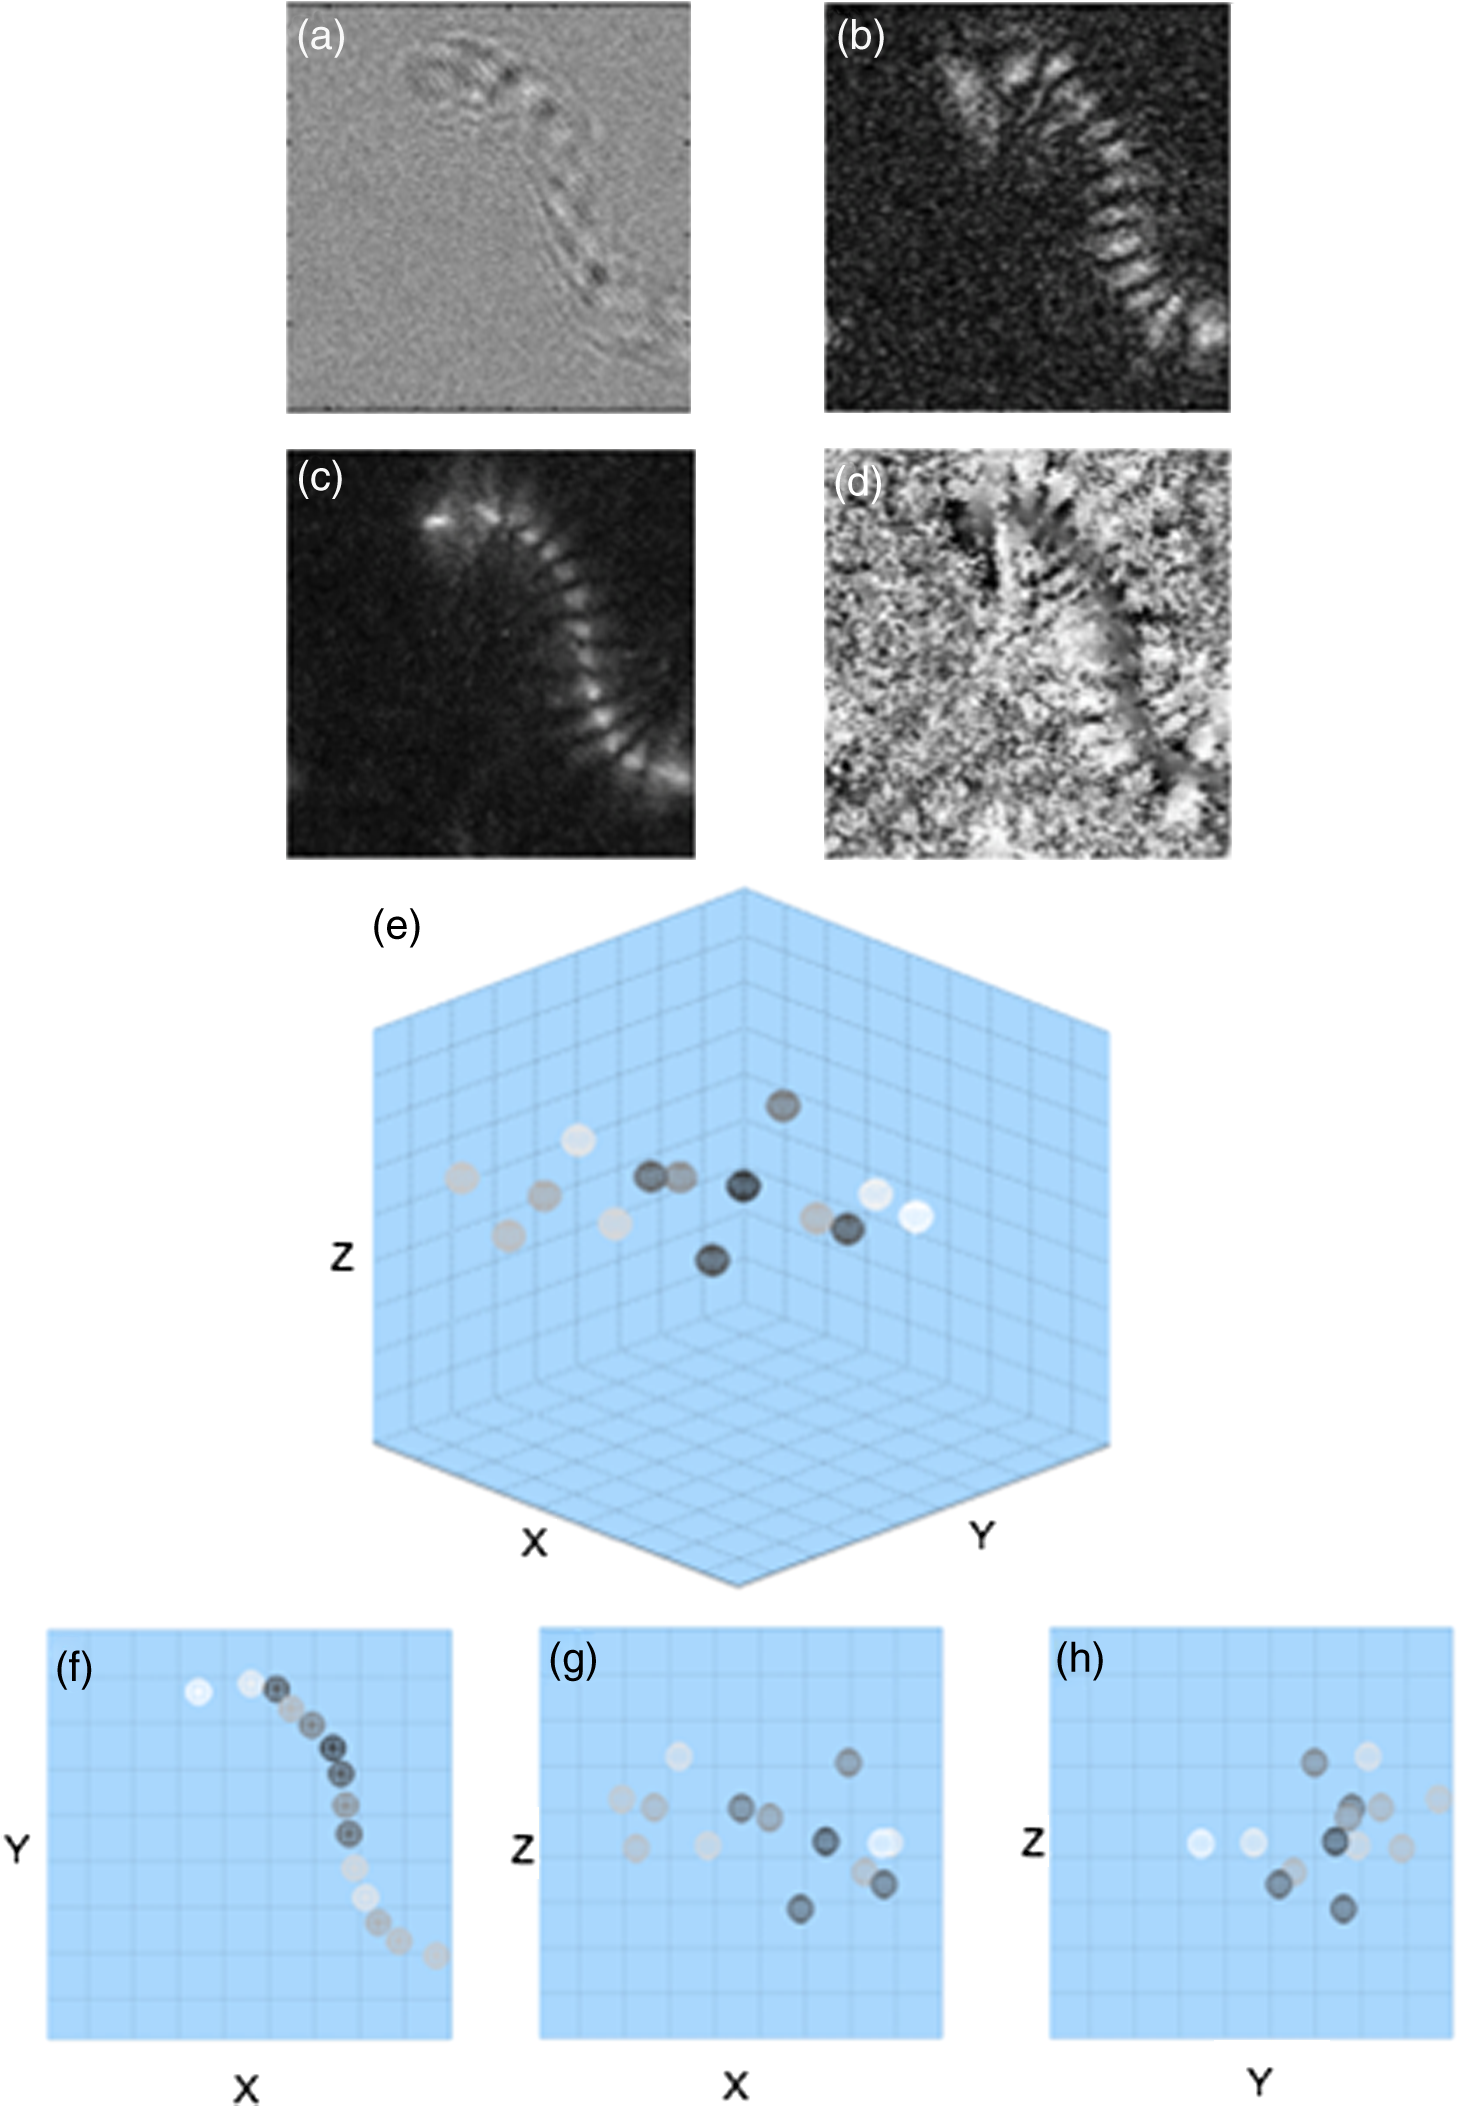 The three-dimensional trajectory of the moving chilomonas was built up by firstly reconstructing the two-dimensional resultant hologram from to , in steps. The same algorithm of numerical autofocusing is then utilized, keeping the maximum intensity value at each pixel in the reconstructed image along direction to obtain the all-in-focus intensity projection Fig. 5(c), and combining with the depth position where in-focus intensity occurred Fig. 5(d) to determine the focal planes for the entire trajectory in the reconstructed volume. A threshold of intensity is applied to eliminate the unnecessary background, and the center position and the mean intensity of every points cloud representing every trajectory of chilomonas are determined. The combination of depth positions and displacement of cells allows for quantitative three-dimensional motility tracking. The cell is estimated to move a total path length of 93 μm at the velocity of . Figure 5(e) demonstrates the applicability of DHM for automatically four-dimensional tracking of living cells with temporal and spatial resolution at the subsecond and microlevel. Figures 5(f)–5(h) show the , , and views of the three-dimensional trajectory, respectively. It is worth mentioning that cells can change their shape when they are moving, so one has to define the positions of cells to perform the cell tracking. “Center of mass” can be a reasonable definition of the position of cells, and morphology changes and center of mass methods have been discussed in the literatures, such as (Ref. 23) where the cells reported had a size of hundreds of micron. On the other hand, in our case, the chilomonas cell is relatively small and has a more rigid shape, changing of shape is not an issue here. 3.4.Three-Dimensional Displacement of Microfiber by Swimming ParameciumA hologram movie of paramecium moving through a microfibers mesh was recorded at 17 fps (Video 2). A cell is seen to swim through fibers and cause obvious displacement of fibers. Two hologram frames showing cell approaching to fibers Fig. 6(a) and swimming away after pulling fibers Fig. 6(b) are extracted. The field of view is with . The different hologram Fig. 6(c) clearly shows the displacement of the fiber due to the movement of cell and the trajectory of cell. The reconstructed amplitude images from angular spectrum method at and are shown in Figs. 6(d) and 6(e), respectively. Different parts of the fiber appear to be in focus at different reconstructed planes. Autofocusing algorithm at the reconstruction volume from to is applied and the all-in-focus intensity and depth position information are obtained in Figs. 6(f) and 6(g). Fig. 6Three-dimensional displacement of microfiber by swimming paramecium (Video 2, MOV, 384 KB) [URL: http://dx.doi.org/10.1117/1.JBO.19.4.045001.2]. The field of view of (a)–(h) and (j) is with . (a) hologram 1; (b) hologram 2; (c) difference of holograms 1 and 2; (d) amplitude reconstructed at ; (e) amplitude reconstructed at ; (f) all-in-focus intensity profile; (g) depth position profile; (h) all-in-focus intensity of the first track of the displacement of fiber; (i) three-dimensional fitted line of (h) (); (j) All-in-focus intensity of the second track of the displacement of fiber; (k) three-dimensional fitted line of (j) (); (l) three-dimensional fitted line of the displacement of fiber () (Video 3, MOV, 64 KB) [URL: http://dx.doi.org/10.1117/1.JBO.19.4.045001.3]); (m) view of (l) (); (n) view of (l) (); and (o) view of (l) (). For better visualization, the scales of and coordinates are not in ratio.  To best visualize the displacement of the fiber in three-dimensional volume, we analyze the two tracks of the displacement of the fiber independently. For brevity, most of the following descriptions refer to the first track. Numerical segmentation and thresholds are applied to Fig. 6(f) and the all-in-focus intensity image containing only one track of fiber is generated in Fig. 6(h). Combined with the obtained depth position profile Fig. 6(g) and fitting algorithm accounting for errors, the fitted line of the point clouds (standard deviations in and directions are 1.27 and 0.27 μm) in three-dimensional coordinate is present in Fig. 6(i). Similar results for the second track of fiber are shown in Figs. 6(j) and 6(k) and the standard deviation of its corresponding point clouds in the and directions are estimated to be 0.80 and 0.26 μm. The two tracks of the fiber are then plotted in one three-dimensional coordinate, Fig. 6(l) and Figs. 6(m)–6(o) show the , , and views of the three-dimensional plot, respectively. The length and the displacement of the fiber are estimated to be 210.1 and 11.1 μm. A movie of three-dimensional displacement of the fiber within 0.5 s period is also presented (Video 3). The three-dimensional displacement of an individual microfiber due to interaction with paramecium cell has been measured as a function of time at subsecond and micrometer level. To the best of our knowledge, this is the first quantitative profiling and tracking by DHM of the curvature and displacement of individual microfiber by swimming cells in three dimensions. Displacement could vary with cell type, physiological state of the cells, microfiber preparation, etc. The prospects seem excellent for DHM for particle flow analysis and three-dimensional imaging of randomly oriented microfibers, in cases where quantitative measurement of characteristics (size, length, orientation, speed, and displacement, etc.) is of great interest. 4.ConclusionsDHM has been applied to image suspended microspheres and stationary microfibers in three dimensions, track motility of cells and monitor the displacement of fibers due to interaction with swimming cells in four dimensions. The three-dimensional positions of objects have been determined subsequently from reconstructed holograms by autofocusing algorithm based on peak searching along the reconstruction direction. The technique opens up new perspectives for DHM in biological cells imaging. The approach is sensitive to cellular motility and can be applied in the field of label-free, noninvasive, dynamic 3-D cells migration analysis without mechanical realignment. It can detect and quantify cellular motility and characteristics over time. DHM is shown to be an effective approach to study motility of biological cells with temporal and spatial resolution at the subsecond and micrometer level. In the future work, we are going to apply this method to study how crawling cells move through fiber jungles in four dimensions and quantify how traction forces vary due to the environment. This will provide a novel imaging of three-dimensional profiles of cellular motility and reveals the dynamic process in biological aspects. AcknowledgmentsThis research was supported in part by the National Eye Institute of the National Institutes of Health under Award No. R21EY021876. ReferencesM. K. Kim,
“Principles and techniques of digital holographic microscopy,”
SPIE Reviews, 1 1
–50
(2010). http://dx.doi.org/10.1117/6.0000006 Google Scholar
M. K. Kim, Digital Holographic Microscopy Principles, Techniques, and Applications, Springer Series in Optical Sciences, New York
(2011). Google Scholar
F. Duboiset al.,
“Digital holographic microscopy for the three-dimensional dynamic analysis of in vitro cancer cell migration,”
J. Biomed. Opt., 11
(5), 054032
(2006). http://dx.doi.org/10.1117/1.2357174 JBOPFO 1083-3668 Google Scholar
P. Langehanenberget al.,
“Automated three-dimensional tracking of living cells by digital holographic microscopy,”
J. Biomed. Opt., 14
(1), 014018
(2009). http://dx.doi.org/10.1117/1.3080133 JBOPFO 1083-3668 Google Scholar
N. T. Shakedet al.,
“Whole-cell-analysis of live cardiomyocytes using wide-field interferometric phase microscopy,”
Biomed. Opt. Express, 1
(2), 706
–719
(2010). http://dx.doi.org/10.1364/BOE.1.000706 BOEICL 2156-7085 Google Scholar
X. Yuet al.,
“Measurement of the traction force of biological cells by digital holography,”
Biomed. Opt. Express, 3
(1), 153
–159
(2012). http://dx.doi.org/10.1364/BOE.3.000153 BOEICL 2156-7085 Google Scholar
M. DemboY. L. Wang,
“Stresses at the cell-to-substrate interface during locomotion of fibroblasts,”
Biophys. J., 76
(4), 2307
–2316
(1999). http://dx.doi.org/10.1016/S0006-3495(99)77386-8 BIOJAU 0006-3495 Google Scholar
X. Yuet al.,
“Measurement of Young’s Modulus of Polyacrylamide Gel by Digital Holography,”
in Digital Holography and Three-Dimensional Imaging, OSA Techinal Digest (CD),
(2011). Google Scholar
R. J. Pelham Jr.Y. L. Wang,
“Cell locomotion and focal adhesions are regulated by substrate flexibility,”
Proc. Natl. Acad. Sci. USA, 94
(25), 13661
–13665
(1997). http://dx.doi.org/10.1073/pnas.94.25.13661 1091-6490 Google Scholar
X. Yuet al.,
“Quantitative imaging and measurement of cell-substrate surface deformation by digital holography,”
J. of Modern Opt., 59
(18), 1591
–1598
(2012). http://dx.doi.org/10.1080/09500340.2012.729095 JMOPEW 0950-0340 Google Scholar
M. Kempkeset al.,
“Three dimensional digital holographic profiling of micro-fibers,”
Opt. Express, 17
(4), 2938
–2943
(2009). http://dx.doi.org/10.1364/OE.17.002938 OPEXFF 1094-4087 Google Scholar
J. Garcia-Sucerquiaet al.,
“4D imaging of fluid flow with digital in-line holographic microscopy,”
Optik, 119
(9), 419
–423
(2008). http://dx.doi.org/10.1016/j.ijleo.2007.01.004 OTIKAJ 0030-4026 Google Scholar
T. LatychevskaiaF. GehriH. Fink,
“Depth-resolved holographic reconstructions by three-dimensional deconvolution,”
Opt. Express, 18
(21), 22527
–22544
(2010). http://dx.doi.org/10.1364/OE.18.022527 OPEXFF 1094-4087 Google Scholar
L. WilsonR. Zhang,
“3D localization of weak scatterers in digital holographic microscopy using Rayleigh-Sommerfeld back-propagation,”
Opt. Express, 20
(15), 16735
–16744
(2012). http://dx.doi.org/10.1364/OE.20.016735 OPEXFF 1094-4087 Google Scholar
T.W. SuL. XueA. Ozcan,
“High-throughput lensfree 3D tracking of human sperms reveals rare statistics of helical trajectories,”
Proc. Natl. Acad. Sci. USA, 109
(40), 16018
–16022
(2012). http://dx.doi.org/10.1073/pnas.1212506109 1091-6490 Google Scholar
W. Xuet al.,
“Tracking particles in four dimensions with in-line holographic microscopy,”
Opt. Lett., 28
(3), 164
–166
(2003). http://dx.doi.org/10.1364/OL.28.000164 OPLEDP 0146-9592 Google Scholar
E. Malkielet al.,
“The three-dimensional flow field generated by a feeding calanoid copepod measured using digital holography,”
J. Exp. Biol., 206
(Pt 20), 3657
–3666
(2003). http://dx.doi.org/10.1242/jeb.00586 JEBIAM 0022-0949 Google Scholar
P. Ferraroet al.,
“Compensation of the inherent wave front curvature in digital holographic coherent microscopy for quantitative phase-contrast imaging,”
Appl. Opt., 42
(11), 1938
–1946
(2003). http://dx.doi.org/10.1364/AO.42.001938 APOPAI 0003-6935 Google Scholar
T. Colombet al.,
“Numerical parametric lens for shifting, magnification, and complete aberration compensation in digital holographic microscopy,”
J. Opt. Soc. Am. A, 23
(12), 3177
–3190
(2006). http://dx.doi.org/10.1364/JOSAA.23.003177 JOAOD6 0740-3232 Google Scholar
J. F. RestrepoJ. Garcia-Sucerquia,
“Automatic three-dimensional tracking of particles with high-numerical-aperture digital lensless holographic microscopy,”
Opt. Lett., 37
(4), 752
–754
(2012). http://dx.doi.org/10.1364/OL.37.000752 OPLEDP 0146-9592 Google Scholar
A. Satoet al.,
“Three-dimensional subpixel estimation in holographic position measurement of an optically trapped nanoparticle,”
Appl. Opt., 52
(1), A216
–A222
(2013). http://dx.doi.org/10.1364/AO.52.00A216 APOPAI 0003-6935 Google Scholar
D. T. HaynieD. B. KhadkaM. C. Cross,
“Physical properties of polypeptide electrospun nanofiber cell culture scaffolds on a wettable substrate,”
Polymers, 4
(3), 535
–1553
(2012). http://dx.doi.org/10.3390/polym4031535 2073-4360 Google Scholar
P. Memmoloet al.,
“On the holographic 3D tracking of in vitro cells characterized by a highly-morphological change,”
Opt. Express, 20
(27), 28485
–28493
(2012). http://dx.doi.org/10.1364/OE.20.028485 OPEXFF 1094-4087 Google Scholar
BiographyXiao Yu received her BSc degree in physics from Nankai University, Tianjin, China, in 2008, and an MSc degree in applied physics from the University of South Florida, Tampa, Florida, in 2010. She is currently working toward a PhD degree at University of South Florida. Her main research interests are digital holographic microscopy and its applications in the biological field, biomedical imaging, digital image processing, etc. Jisoo Hong received his BS and MS degrees in electrical engineering from Seoul National University, Republic of Korea, in 2002 and 2004, respectively. From 2004 to 2008, he was a senior research engineer with LG Electronics, Korea. In August 2012, he received his PhD degree from his alma mater. Presently, he is a postdoctoral researcher in the Department of Physics at the University of South Florida, Tampa, Florida. He is interested in incoherent digital holography and its application to biomedical imaging and three-dimensional (3-D) photography. Changgeng Liu obtained his BS degree in applied physics in 2007 and an MS degree in optics from Beijing University of Technology, Beijing, China, in 2010. He is currently seeking a PhD degree in applied physics in at the University of South Florida, Tampa, Florida. His research interests include digital holography, adaptive optics, biomedical imaging, computational optics, phase retrieval, digital imaging processing, and optical systems design. Michael Cross received his Sc degree in computer science from the University of Texas at San Antonio, Texas, in 2005. He is presently pursuing a PhD degree in applied physics at the University of South Florida, Tampa, Florida. His research interests are atomic force microscopy, laser-scanning confocal microscopy, and their applications to biomedical engineering and biomaterials. Donald T. Haynie joined USF physics in 2009, having been vice president of research and development at Artificial Cell Technologies Inc., New Haven, Connecticut. He holds a PhD degree in biophysics from Johns Hopkins University, Baltimore, Maryland, and he was an NSF postdoctoral fellow at Oxford University, Wellington Square, Oxford. He heads the Nanomedicine and Nanobiotechnology Laboratory. Current research interests include polypeptide materials, cell interactions with polypeptide materials, and molecular mechanisms of cell adhesion and migration. Myung K. Kim is a professor of physics at the USF, and directs the Digital Holography and Microscopy Laboratory. He received his PhD degree from the University of California, Berkeley, in 1986. His current research interests are in the development of novel techniques and applications in digital holography, microscopy, interference imaging, optical tomography, biomedical imaging, and manipulation of particles and microbes by optical force. He has more than 200 publications and 13 patents granted or pending. |