|
|
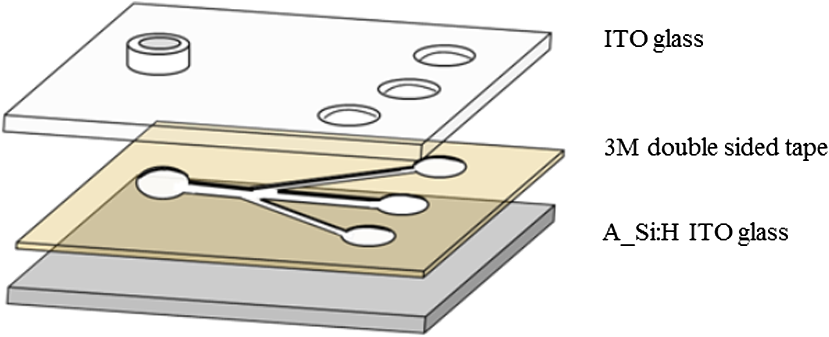
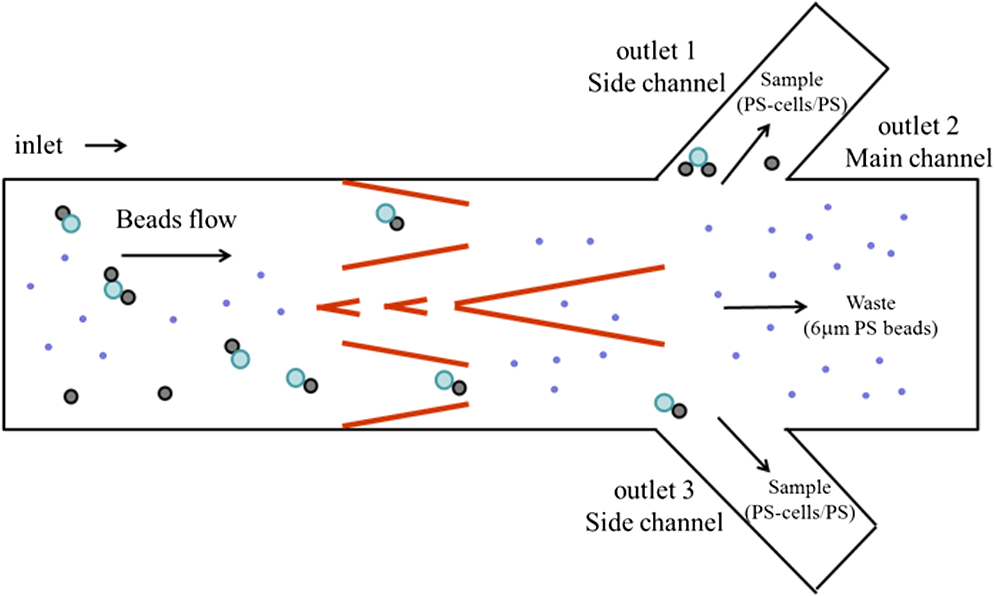
1.IntroductionThe early detection of circulating tumor cells (CTCs) in patient blood is a significant indicator for cancer prognosis and therapy. Because of very few numbers of CTCs, these cells are not easily detected. The ability to detect and concentrate CTCs1–6 in peripheral blood is of great importance for cancer research and treatment. Therefore, there are a growing number of studies in improving the way CTCs are captured, isolated, enumerated, and characterized. Traditionally, the purity of cancer cell isolation by negative selection is 0.97% to 10%;7 by positive selection it is 50% to 62%.8 By using microfluidic sorting methods, the purity can be much improved; they can be classified into biochemical and biophysical methods. The biochemical methods include fluorescence sorting,9 immunomagnetic separation,10 and adhesion based methods.11 The biophysical methods include filters,12 hydrodynamic sorting,13 deterministic lateral displacement,14 inertial separation,15 acoustophoresis,16 optical tweezers,17 electrophoresis,18,19 and dielectrophoresis (DEP).20 Among them, the DEP force can achieve high throughput and manipulation of cells. The optically induced dielectrophoresis (ODEP) operating principle is by using light to induce a nonuniform electrostatic field and manipulate micron particles (beads, carbon nanotubes, or cells). ODEP21,22 can achieve high resolution and low optical intensities (), and the electrode pattern can be dynamically changed by varied light pattern. Huang et al.23 developed an ODEP system to isolate CTCs; however, ODEP-based methods currently lag in performance in both selectivity (cancer cells enrichment over leukocytes typically 100) and throughput (typically, ). We propose that applying antibody-conjugated beads to cells can enhance ODEP force and improve selectivity and throughput of the system. 2.Materials and Methods2.1.Detection Principle2.1.1.ODEP chip structure and systemThe ODEP force applied to the micron (sized) spherical particles can be described by the following DEP force equation: where , , , and represent the micron particles radius, the permittivity of medium, the real part of the Clausius–Mossotti factor, and the root-mean-square electric field strength, respectively. For a single-shell model, the can be described by the following DEP force equation:22 where , , , , and represent the permittivity of micron particles, the permittivity of medium, the conductivity of micron particles, the conductivity of medium, and the angular frequency of the electric field, respectively.A dielectric particle within a nonuniform electrostatic field can experience a positive or negative force. In negative values of , the particles can be repelled from minimum electrostatic field, i.e., particles are pushed away from the projected light pattern. For positive values of , the particles can be attracted to minimum electrostatic field, i.e., particles are dragged by the projected light pattern. The ODEP chip structure and system are shown separately in Figs. 1 and 2. The system is divided into three parts: virtual electrodes generation system, ODEP chip, and image acquisition system. The optical patterns of the virtual electrode are generated by the computer animation software and through a special lens24 to project entire light pattern onto the ODEP chip, and the image is presented on a computer screen through the lens group and charge-coupled device (CCD)-equipped microscope to achieve large manipulating area. By high efficiency of the classification algorithm, cells can be identified accurately and rapidly. The ODEP chip structure consists of two indium-tin-oxide (ITO) glasses and a spacer, and the liquid layer containing the microparticles is sandwiched between the two ITO glasses. The bottom ITO glass is coated with a 50 nm a-Si:H layer and a 1-μm undoped a-Si:H layer by plasma-enhanced chemical vapor deposition. An alternating current (AC) bias is applied between the two ITO glasses to generate an electrostatic field in the system. The AC bias is supplied by a function generator (GW instek GFG-8020H; 0 to 2 MHz, 0 to 24 V). The spacer is defined by a 3M 8005 double-sided tape. A commercial liquid-crystal display projector, (Epson EB-G5900) through a special designed lens, projects the entire optical images onto the ODEP chip. In addition, a CCD-equipped microscope (ICX204, Sony, Japan) was used to observe the manipulation of microparticles in the system. The microscope can zoom from to . 2.1.2.Chip designThe top ITO glass consists of one inlet and three outlets for tube connecting. The spacer and channel structure are defined by a 50-μm thickness 3M double-sided tape through a 35-W laser machine. There are one main channel and two side channels, and the angle between side and main channels is 30 deg. The diameter of inlet and outlet holes is 4 mm; the width for main and side channels is 1 and 0.5 mm, respectively, as shown in Fig. 3. The mixed sample [cells and polystyrene (PS) beads] was injected into the inlet by a syringe pump. The ODEP light pattern was projected before the cross of main and side channels to separate the desired and waste samples. The outlets 1 and 3 collected the desired sample (15-μm PS beads bound cells), and the outlet 2 collected the waste sample (6-μm PS beads). 2.1.3.ODEP experiment and light pattern designThere are static and dynamic flowfields to test PS beads and cells moving speed. Different sizes (diameters: 1, 6, and 15 μm) of the streptavidin-coated PS beads are used in moving speed testing. In the static flowfield, the light pattern is moving and vertical to the main channel. The sample is injected by a pipette. When the beads (or cells) cannot catch up the light pattern speed, the maximum dragging velocity is recorded. Although in the dynamic flowfield, the sample is injected by a syringe pump with a various flow speeds. The light pattern is static and inclined at an angle to the channel, as shown in Fig. 4. According to the optimized experimental results, the final cells sorting light pattern and flow channel are designed, as shown in Fig. 5. 2.2.Sample PreparationTwo kinds of cancer cells are prepared for the ODEP experiment: AGS (gastric cancer cells) and MCF-7 (human breast cancer cells). The prepared PS microbeads (diameters: 1, 6, and 15 μm) were suspended in a 0.1% bovine serum albumin (BSA, Sigma, Taiwan). The human monocytic leukemia cell line (THP-1) is prepared in an 8.5% sucrose solution (Sigma, cat. No.S0389, Taiwan). 2.2.1.Cell cultureBreast and gastric cancer cell lines were purchased from American Type Culture Collection (ATCC, Virginia) and Bioresource Collection and Research Center (BCRC, Taiwan). Cells were cultured in DMEM (Gibco, Carlsbad, California) with 10% FBS and 100-mM nonessential amino acids (Gibco, Carlsbad, California). 2.2.2.Beads conjugationBiotin-labeled antihuman EpCAM antibody (VU-1D9) was purchased from GeneTex (Irvine, California). Different sizes of streptavidin-coated PS beads (1, 6, 15 μm) were purchased (Polysciences, Warrington, Pennsylvania). Detailed procedures were described in user’s manual from the vendor. In brief, proper amount of antibody and beads were mixed thoroughly on ice for 30 min. The mixture was washed twice with wash buffer. Unbound antibodies were collected and quantified to determine the conjugation efficiency. 2.2.3.Viability assayCells were incubated in different isotonic sugar solutions for 1, 2, 4, and 6 h. Total cell number and cell viability were detected by ADAM auto cell counter (Bulldog Bio Inc., Portsmouth, New Hampshire). 2.2.4.Fluorescence activated cell sorting analysisCells were incubated with dye-labeled monoclonal antibodies against target molecules for 30 min on ice. Stained cells were then washed twice and resuspended in cold buffer and analyzed with a fluorescence activated cell sorting (FACS) can flow cytometry (BD Biosciences, San Jose, California). More than cells were analyzed for each sample, and the results were processed by using WinMDI 2.8 software (Scripps Research Institute, La Jolla, California). 3.Results and Discussions3.1.Expression of EpCAM in Breast and Gastric Cancer Cell LinesThe major challenge in identifying CTCs is to distinguish CTCs with other cells in circulation, such as red blood cells (RBCs) and white blood cells. It is widely accepted that EpCAM is highly expressed in cells from epithelial origin but not in blood cells. Therefore, EpCAM is used as a marker for enriching CTCs.25 To choose the optimal cell model for this study, we tested the expression of EpCAM in four different breast cancer cell lines and five different gastric cancer cell lines. Among the tested breast cancer cell lines, MCF-7, T47D, and MDA-MB 453 showed complete expression of EpCAM (), and MDA-MB-231 showed partial expression of EpCAM (80%) [Fig. 6(a)]. Among the tested gastric cancer cell lines, KATO III, NCI-N87, AGS, and TMC-1 showed complete expression of EpCAM (), and SNU5 also showed high percentage of EpCAM expression (94%) [Fig. 6(b)]. 3.2.Processes of Enriching CTCs by ODEP (Assay Flow Chart)To enrich CTCs by ODEP system, we designed a series of procedures to maximize the efficiency of CTCs enrichment. The RBCs were lysed before labeling target cells with beads-conjugated anti-EpCAM antibody. Afterward, cells were sorted by ODEP system and the enrichment efficiency was verified (Fig. 7). 3.3.Buffer Selection for ODEP (Cell Survival in Different Low-Ionic Buffer)Since conductivities of buffer and particles are crucial for the efficiency of ODEP isolation, the conductivities of several different buffers were tested, including phosphate buffered saline (PBS), cell culture medium, BSA, and sugar solutions. Among the tested buffers, sugar solutions showed the lowest conductivities and were optimal for ODEP (Table 1). Table 1Conductivity of several different buffers were measured by EUTECH CyberScan CON 11 portable conductivity meter.
Although sugar solutions were optimal for ODEP, we would like to keep testing cell viable throughout this study. Therefore, we chose several isotonic sugar solutions and examined viability of tumor cells in these sugar solutions up to 6 h. All sugar solutions tested kept cells viable except dextrose (Fig. 8). Fig. 8MCF-7 (A) or AGS (B) cells were cultured in several isotonic sugar buffers. Cell viability was determined by cell counting with ADAM cell counter.  In addition, since the binding force between antibody and antigen is the combination of hydrogen bonds, ionic bonds, van der Waals forces, and hydrophobic interactions, another potential problem for using low-ionic buffer in our system is that the antibody–antigen binding affinity may be weakened. Consequently, the antibody-beads complex could detach from target cells. To examine if antibody–antigen complex remained bound in low-ionic buffer, we incubated antibody-bound MCF-7 cells in PBS and sucrose for 1 h before analyzing the binding ratio by flow cytometry. It was not observed differences in binding affinity when antibody-bound MCF-7 cells were incubated in PBS and sucrose [Figs. 9(a) and 9(b)]. 3.4.Conjugation of PS Beads and Anti-EpCAM Antibody (Beads Selection)In this study, we chose biotin–streptavidin system to conjugate beads and anti-EpCAM antibody. Detailed procedures for conjugating beads and antibodies were described in Sec. 2. To verify our conjugation efficiency, we developed an assay to indirectly measure the unbound antibody in reaction buffer and wash buffer (Fig. 10). Conjugation was done five times, and the results were shown in Table 2. To verify the efficiency of beads-conjugated anti-EpCAM antibody in recognizing EpCAM positive cells, we conjugated fluorescent PS beads to anti-EpCAM antibody and observed the binding efficiency by flow cytometry. Beads-conjugated anti-EpCAM antibody recognized over 96% of EpCAM positive cells. The result showed that PS beads conjugation did not affect antigen recognition of the anti-EpCAM antibody (Fig. 11). Furthermore, altering the reaction temperature to 37°C and increasing the incubation period to 1 h did not affect antigen recognition of the beads-conjugated anti-EpCAM antibody (data not shown). Table 2Conjugation was done five times.
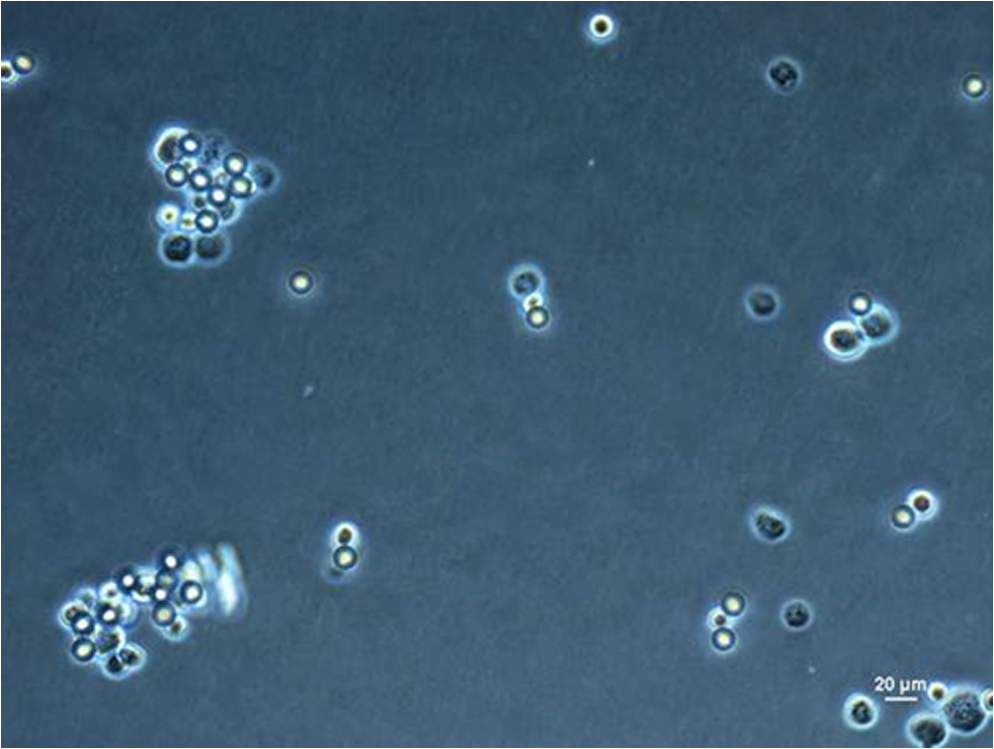
3.5.Optimized Condition for Different Types of Cells3.5.1.Static flow fluidic fieldIn the static flow fluidic field experiment, the light pattern is moving with various velocities, and the light line width is fixed at 100 μm. The sample is injected by a pipette. The dragging velocity of 6-μm PS beads alone and cancer cells bound 6-μm PS beads at fixed 22 V and various frequencies is tested, as shown in Fig. 12. The maximum dragging velocity is at 30 kHz and decreases with increasing frequency. In Fig. 13, the frequency is fixed at 30 kHz and various voltages. As the theoretical prediction, the dragging velocity is increasing as voltage increasing. The maximum dragging velocity does not exceed . To improve the dragging velocity, the 15-μm PS beads are tested at various frequencies and voltages, as shown in Fig. 14. As expected, the maximum dragging velocity is at 30 kHz and 24 V and improved to . 3.5.2.Conjugation of 15-μm PS beads and anti-EpCAM antibodySince 15-μm PS beads were required to generate enough dragging force in ODEP system, we conjugated anti-EpCAM antibody with 15-μm PS for cell recognition. When tested in vitro, we observed cells were recognized and captured by 15-μm PS beads labeled anti-EpCAM antibody (Fig. 15). 3.5.3.Dynamic flow fluidic fieldIn the dynamic flow fluidic field experiment, the light pattern is static and with various inclined angles to the main channel, and the light line width is fixed at 40 μm. The sample is injected by a syringe pump with a various flow speeds. The dragging velocity is decreasing as the inclined angle is increasing. The maximum dragging velocity can be up to at 10 deg inclined angle (Fig. 16). The dragging velocity is equivalent to fluidic flow rate. The optimized 10 deg inclined angle is designed to separate different cells, and the flow rate is 80 times faster than the literature.23 3.5.4.Dynamic flow fluidic field with mixed sampleAs the dragging velocity is almost the same for the THP-1 and 6-μm PS beads. The 6-μm PS beads are used to simulate the waste sample THP-1. The mixed sample (6-μm PS beads and 15-μm PS beads bound AGS) is injected by a syringe pump with flow rate, and the 40-μm static light pattern is inclined 10-deg angle to the main channel, as mentioned before in Fig. 5. In Fig. 17, the mixed sample is random flowing into side and main channels at 1 s. Then, the projected light is turn on 4 s, and the mixed sample is pushed by the virtual light channel. At 10 and 13 s, all the 15-μm PS beads are pushed to flow into side channels, while the 5-μm PS beads are random flowing into main and side channels. Fig. 17Mixed different sizes of PS beads, and PS beads bound AGS; and observe separation efficiency by ODEP (Video, 2.41 MB) [URL: http://dx.doi.org/10.1117/1.JBO.19.4.045002.1].  4.ConclusionBy changing projected light pattern, it is demonstrated to separate high-purity gastric cancer cells mixed in 6 and 15-μm PS beads. A novel ODEP technology is proposed to enhance the purity of cancer cells isolation about 77%, and promotes 80 times throughput than the literature.23 Ongoing studies in our laboratory are to improve the conjugated anti-EpCAM antibody with 15-μm PS beads for cell recognition. AcknowledgmentsWe would like to thank all members of the Micro-Opto-Mechanical-Electronics Division and Business and Innovation Division. All the valuable discussions contribute to our research activities so far. The corresponding author contributes the same work as the first author. ReferencesJ. ChenJ. LibY. Sun,
“Microfluidic approaches for cancer cell detection, characterization, and separation,”
Lab Chip, 12
(10), 1753
–1767
(2012). http://dx.doi.org/10.1039/c2lc21273k LCAHAM 1473-0197 Google Scholar
M. Yuet al.,
“Circulating tumor cells: approaches to isolation and characterization,”
J. Cell Biol., 192
(3), 373
–382
(2011). http://dx.doi.org/10.1083/jcb.201010021 JCLBA3 0021-9525 Google Scholar
Z. Liuet al.,
“Negative enrichment by immunomagnetic nanobeads for unbiased characterization of circulating tumor cells from peripheral blood of cancer patients,”
J. Transl. Med., 9
(70), 1
–8
(2011). http://dx.doi.org/10.1186/1479-5876-9-70 JTMOBV 1479-5876 Google Scholar
S. J. Tanet al.,
“Versatile label free biochip for the detection of circulating tumor cells from peripheral blood in cancer patients,”
Biosens. Bioelectron., 26
(4), 1701
–1705
(2010). http://dx.doi.org/10.1016/j.bios.2010.07.054 BBIOE4 0956-5663 Google Scholar
S. Nagrathet al.,
“Isolation of rare circulating tumour cells in cancer patients by microchip technology,”
Nature, 450 1235
–1239
(2007). http://dx.doi.org/10.1038/nature06385 NATUAS 0028-0836 Google Scholar
S. H. Seal,
“A sieve for the isolation of cancer cells and other large cells from the blood,”
Cancer, 17
(5), 637
–642
(1964). http://dx.doi.org/10.1002/(ISSN)1097-0142 60IXAH 0008-543X Google Scholar
P. Balasubramanianet al.,
“Confocal images of circulating tumor cells obtained using a methodology and technology that removes normal cells,”
Mol. Pharmaceutics, 6
(5), 1402
–1408
(2009). http://dx.doi.org/10.1021/mp9000519 1543-8384 Google Scholar
S. Nagrathet al.,
“Microchip-based isolation of rare circulating epithelial cells in patients with metastatic cancer,”
Nature, 450 1235
–1239
(2007). http://dx.doi.org/10.1038/nature06385 NATUAS 0028-0836 Google Scholar
T. H. Wuet al.,
“Pulsed laser triggered high speed microfluidic fluorescence activated cell sorter,”
Lab Chip, 12
(7), 1378
–1383
(2012). http://dx.doi.org/10.1039/c1lc90128a LCAHAM 1473-0197 Google Scholar
J. J. Chalmerset al.,
“Flow through immunomagnetic cell separation,”
Biotechnol. Prog., 14
(1), 141
–148
(1998). http://dx.doi.org/10.1021/bp970140l BIPRET 8756-7938 Google Scholar
S. Nagrathet al.,
“Isolation of rare circulating tumour cells in cancer patients by microchip technology,”
Nature, 450 1235
–1239
(2007). http://dx.doi.org/10.1038/nature06385 NATUAS 0028-0836 Google Scholar
H. M. Jiet al.,
“Silicon-based microfilters for whole blood cell separation,”
Biomed. Microdevices, 10
(2), 251
–257
(2008). http://dx.doi.org/10.1007/s10544-007-9131-x BMICFC 1387-2176 Google Scholar
S. YangA. UndarJ. D. Zahn,
“A microfluidic device for continuous, real time blood plasma separation,”
Lab Chip, 6
(7), 871
–880
(2006). http://dx.doi.org/10.1039/b516401j LCAHAM 1473-0197 Google Scholar
L. R. Huanget al.,
“Continuous particle separation through deterministic lateral displacement,”
Science, 304
(5673), 987
–990
(2004). http://dx.doi.org/10.1126/science.1094567 SCIEAS 0036-8075 Google Scholar
D. D. Carloet al.,
“Continuous inertial focusing, ordering, and separation of particles in microchannels,”
Proc. Natl. Acad. Sci. U. S. A., 104
(48), 18892
–18897
(2007). http://dx.doi.org/10.1073/pnas.0704958104 PNASA6 0027-8424 Google Scholar
M. KumarD. L. FekeJ. M. Belovich,
“Fractionation of cell mixtures using acoustic and laminar flow fields,”
Biotechnol. Bioeng., 89
(2), 129
–137
(2005). http://dx.doi.org/10.1002/(ISSN)1097-0290 BIBIAU 0006-3592 Google Scholar
D. G. Grier,
“A revolution in optical manipulation,”
Nature, 424 810
–816
(2003). http://dx.doi.org/10.1038/nature01935 NATUAS 0028-0836 Google Scholar
L. KremserD. BlaasE. Kenndler,
“Capillary electrophoresis of biological particles: viruses, bacteria, and eukaryotic cells,”
Electrophoresis, 25
(14), 2282
–2291
(2004). http://dx.doi.org/10.1002/(ISSN)1522-2683 ELCTDN 0173-0835 Google Scholar
C. R. CabreraP. Yager,
“Continuous concentration of bacteria in a microfluidic flow cell using electrokinetic techniques,”
Electrophoresis, 22
(2), 355
–362
(2001). http://dx.doi.org/10.1002/(ISSN)1522-2683 ELCTDN 0173-0835 Google Scholar
M. P. Hughes,
“Strategies for dielectrophoretic separation in laboratory-on-a-chip systems,”
Electrophoresis, 23
(16), 2569
–2582
(2002). http://dx.doi.org/10.1002/1522-2683(200208)23:16<2569::AID-ELPS2569>3.0.CO;2-M ELCTDN 0173-0835 Google Scholar
P. Y. ChiouA. T. OhtaM. C. Wu,
“Massively parallel manipulation of single cells and microparticles using optical images,”
Nature, 436 370
–372
(2005). http://dx.doi.org/10.1038/nature03831 NATUAS 0028-0836 Google Scholar
A. T. Ohtaet al.,
“Dynamic cell and microparticle control via optoelectronic tweezers,”
J. Micromech S., 16
(3), 491
–499
(2007). http://dx.doi.org/10.1109/JMEMS.2007.896717 JMIYET 1057-7157 Google Scholar
S. B. Huanget al.,
“An optically-induced dielectrophoretic (ODEP) microfluidic platform for isolation of circulating tumor cells (CTCS) after conventional CTC isolation process,”
Lab Chip, 13 1371
–1383
(2013). http://dx.doi.org/10.1039/c3lc41256c LCAHAM 1473-0197 Google Scholar
H. H. Chenet al.,
“Optically-induced dielectrophoretic technology for cancer cells identification and concentration,”
in 35th Ann. Int. Conf. IEEE Engineering in Medicine and Biology Society (EMBC),
2415
–2418
(2013). Google Scholar
A. AndrewL. E. Stephen,
“A new therapeutic target for an old cancer antigen,”
Cancer Biol. Ther., 2
(4), 320
–326
(2003). http://dx.doi.org/10.4161/cbt 1538-4047 Google Scholar
BiographyHsiu-Hsiang Chen is a researcher at the Industrial Technology Research Institute, Taiwan. She obtained her PhD degree from the Institute of Nano Engineering and Microsystems at National Tsing Hua University of Taiwan in 2011. Her research interests include solid-state physics, NMEMS (nano micro-electro-mechanical systems), optical MEMS, bioMEMS, and optofluidic integration. Mei-Wei Lin is a researcher at the Industrial Technology Research Institute, Taiwan. She obtained her MS degree in microbiology and immunology from National Cheng Kung University of Taiwan in 2002. Her research interest is oncology, cancer biology, and immunology. Her current focus is on studying cancer therapy and isolating circulating tumor cells. Wan-Ting Tien is a researcher at Industrial Technology Research Institute, Taiwan. He obtained his MS degree in physics from Tamkang University of Taiwan in 1990. His research interests are laser engraving, holographic optics, breast microcalcifications photoacoustic imaging, and optical dielectrophoresis experiments. Chin-Pen Lai is an associate researcher at the Industrial Technology Research Institute, Taiwan. She received her MS degree from the National Taiwan University of Zoology of Taiwan in 2004. Her research interests include oncology and cancer biology. Her current focus is on studying physically cancer treatments, isolating circulating tumor cells, and adipose-derived stem cells. Kuo-Yao Weng is an engineer at the Industrial Technology Research Institute, Taiwan. He received his PhD degree in biotechnology from National Tsing Hua University of Taiwan in 2008. His research interests are on optoelectronical devices in biomedical detection and analysis, microfluidic tools in biomicroparticle manipulation and separation, and in vitro diagnostic and point-of-care testing devices. His current focus is on studying an isolating device of circulating tumor cells and wearable image devices. Ching-Huai Ko is a senior researcher at Industrial Technology Research Institute, Taiwan. He obtained his PhD degree in pharmacy from Taipei Medical University of Taiwan in 2005. His research interest is oncology, cancer biology, and skin regeneration. His current focus is on studying cancer target therapy and cancer stem cell. Chun-Chuan Lin is a manager at the Industrial Technology Research Institute, Taiwan. He obtained his MS degree in photoelectric engineering from National Changhua University of Education, Taiwan, in 1995. His research interest is optical system design and laser scanning microscope. His current focus is on studying a cell capture and sorting system and an isolating circulating tumor cells. Jyh-Chern Chen is currently a principal researcher at the Industrial Technology Research Institute, Taiwan. He obtained his PhD degree in chemical engineering from National Taiwan University in 1988. He is also a serial entrepreneur in creating five medical diagnostic devices companies. His research interest includes bio-sensing, biochemical processing, and in-vitro diagnostics. His current focus is on the isolation and detection of circulating tumor cells. Kuo-Tung Tiao is currently a deputy general director at the Industrial Technology Research Institute, Taiwan. He obtained his MS degree in electrical engineering and MBA from National Tsing Hua University (Taiwan) and University of Illinois at Urbana-Champaign (USA), respectively. His research interest includes optical electronics system of image capturing and display, optical storage technology, optical printing technology, optical component and system research development and manufacturing, CMOS image sensor-based camera module, and bio-photonics. Tse-Ching Chen is a professor of anatomical pathology, working at Lin-Kou Chang Gung Memorial Hospital, Taiwan. He was appointed as departmental head in 2005. His subspecialties include hepatogastrointestinal pathology, cellular immunology, and molecular pathology. Now, he devotes his time to exploring novel biomarkers for cancer target therapy and automatic device/system for pathologic laboratory. Shin-Cheh Chen is specialized in breast cancer treatment and research. His clinical work focuses on breast cancer management including surgery and chemotherapy. His team focuses on treatment of breast cancer and special effort in breast cancer patients care. He has pioneered the development of breast ultrasound, not only in clinical examination but also in breast cancer screening. His research in basic science includes vitamin D metabolism, cancer biology, and miRNA. Ta-Sen Yeh is in charge of the Surgical Lab, Tissue Bank, Board of Chang Gung medical research review and research, and Division of General Surgery, CGMH. He obtained his PhD training from Chang Gung University of Taiwan in 2001. Currently, his academic interests are hepato-biliary surgery and relevant translation research, including liver regeneration, carcinogenesis of hepatobioliary cancer, and molecular imaging of animal cancer models. Chieh-Fang Cheng is a researcher at Industrial Technology Research Institute, Taiwan. He obtained his PhD degree in pathology from University of Southern California in 2008. His research interest is oncology, cancer biology, and skin regeneration. His current focus is on studying physically cancer treatments and isolating circulating tumor cells. |