
|
|
1.IntroductionCancer is a widespread disease affecting one-fourth of Europeans under the age of 75.1 Surgical resection, either by open surgery or via endoscopic/laparoscopic devices, remains one of the most important and frequently used treatment options. The precise demarcation of healthy and cancerous tissue as well as the identification of cancer spread and margins play a crucial role for the effectiveness of the surgical resection. 2 Yet, intraoperative clinical decision making still relies on visual inspection and palpation; methods that are limited by the inability of the human eye to identify malignant tissue with high accuracy or to visualize under the surface and the overall insensitivity of tactile methods to identify small groups of cancer cells. Near-infrared (NIR) fluorescence imaging has been identified as a promising modality for intraoperative imaging, as it directly relates to the surgeon’s vision and offers easy and cost-efficient integration into the operating room. Using fluorescent agents with targeting specificity to cancer cells, fluorescence imaging can offer large field of view, and observe disease with high sensitivity and specificity based on molecular biomarkers and overall improve intraoperative guidance. Thus, the method fills the gap between preoperative noninvasive diagnostic imaging modalities and postoperative histopathological analysis.3 Contrast enhancement by the administration of nonspecific extrinsic fluorescent contrast agents, such as fluorescein and indocyanine green (ICG), has been demonstrated in videoangiography, identifying the lymphatic system and the localization of brain tumors.4–6 Despite these applications, ICG has not shown strong specificity or sensitivity. Instead, targeted fluorescent probes with molecular specificity have been proposed as a means to image invisible disease biomarkers and molecular properties during surgery.7–9 Recently, the first clinical translation of such targeted probes has been achieved for intraoperative imaging of ovarian cancer;10 however, showcasing significant benefits over the visual inspection and pointing to opportunities for translating other targeted agents as well. In addition to dedicated agents, alternative translational processes based on optically labeled drugs administered in microdosing amounts have been also proposed,11 aiming to lower the translation risk of targeted probes into the clinics.12,13 The ultrasmall amounts of fluorescence dyes desirable for systemic administration in patients, possibly under microdosing requirements of less than 30 nmol of protein,14 introduces a challenging situation for highly sensitive imaging at video-rate implementation. Improving the detection sensitivity with longer acquisition times has been common in animal imaging, but it is rather impractical during intraoperative procedures and fluorescence guidance. There are two major advantages in short exposure times and video-rate implementation. First, video-rate imaging provides immediate feedback related to the surgeon’s vision, enabling direct hand-eye coordination during surgical procedures by observing the superimposed fluorescent and color images on screen in real time. Second, long exposure times would introduce motion blur that hampers image interpretation and potentially can introduce false-negative resection decisions. Motion sources include patient movement due to breathing or heartbeat, tissue movement induced by surgical tools, and systematic movements stemming from camera movements in relation to the patient. In endoscopic applications, additional motion is caused by movements of the internal organs and the mechanical instability of the flexible endoscope. Video-rate imaging can avoid these motion artifacts and offers visual inspection capabilities that are more compatible with human vision over slow refreshing images. In this work, we investigated an approach that can enhance the detection sensitivity of video-rate fluorescence imaging without slowing down the acquisition frame rate. The sensitivity improvement is based on utilizing structure-rich reflectance images for capturing motion and correspondingly integrating fluorescence photons by motion compensation. The introduction of a motion compensation for the fluorescent channel is virtually extending exposure times without introducing motion blur. We demonstrate the method on fluorescence measurements of phantoms and in vivo mouse studies for subcutaneous tumors. We discuss the application of this method and conclude on its advantages and limitations. 2.Methods2.1.TheoryOptical flow is the concept of estimating the velocities of image points on temporal differentiated images and is widely spread through different disciplines such as robotics,15 defense,16 and object tracking.17 Commonly, optical flow algorithms are based on the assumption that a change of intensity in the image occurs only due to movement, i.e., where is the image intensity at pixel coordinates () and time point , while () are the pixel velocities.A key task, then, is to calculate the velocities for each picture element. Optical flow algorithms can be divided into two main classes by the strategy they use to calculate the pixel velocity.18 The first class of algorithms, termed local algorithms, uses information from the spatial neighborhood of the pixel. The second class of algorithms, global algorithms, introduces a global energy functional, which is applied to the entire image in combination with a smoothing penalty term.19 Therein, , , and are the gradients along the spatial and directions and the temporal dimension, respectively. The weighting factor in front of the smoothness inducing term penalizes big gradients in the vector field. The minimization of this functional leads to the vector field estimation , called optical flow, which contains the motion offset components and between two time points in the and the directions, respectively. Essentially, the optical flow describes the motion-induced image intensity differences while satisfying a smoothness assumption serving as a regularization function. The main advantage of global algorithms, over local algorithms, is that the resulting flowfield is dense, meaning that the result contains velocity components for each pixel of the original image. A dense flowfield is necessary in fluorescence correction applications because corrections should be applicable on the entire image. 2.2.ImplementationThe integration of optical flow methods into intraoperative NIR imaging systems could benefit the sensitivity of video-rate imaging during open surgery or endoscopy. To achieve video-rate implementation of our proposed optical flow correction approach, we selected to offload the computationally expensive tasks onto the computer’s graphics processing unit (GPU). The compute unified device architecture (CUDA) framework was introduced by NVIDIA, (Santa Clara, California) in 200720 to enable general purpose computation on the GPU hardware (GPGPU). The parallel processing power of GPUs has been exploited in various fields and applications, such as MRI reconstruction21 and bioinformatics,22 with achieved speedups of up to .23 A previously reported intraoperative imaging system24 was employed as the platform to implement the optical flow algorithm. Briefly, the field of view was illuminated by a white light source (KL-2500 LCD, Schott AG, Mainz, Germany) for epi-illumination imaging and a 750 nm continuous wave (CW) laser diode (BWF2-750-0, B&W Tek, Newark, US-DE) for fluorescence excitation. A dichroic mirror (700DCXXR, AHF analysentechnik, Tübingen, Germany) was used to separate visible and NIR spectral bands, guiding the former to a 12-bit color charge coupled device (CCD) (PCO AG, Kelheim, Germany) and the latter to an iXon 3 EMCCD camera (Andor Technology, Belfast, Northern Ireland). We integrated the Horn and Schunk optical flow implementation for CUDA by Smirnov25 into our custom imaging software and developed a scheme for the correction of video-rate fluorescence images. The scheme first acquired color and fluorescence images which were resized and spatially coregistered. The bayer-patterned raw color image is demosaicked as described in.26 Second, the optical flow motion field was estimated from subsequent color images at time points and . All vector computations were performed on the color images since they are textured and structurally rich. Instead, estimating the optical flow from the diffuse fluorescence images would be less accurate due to the lower resolution achieved on fluorescence imaging as a result of the more prominent effects of photon scattering. Finally, the calculated optical flowfield is used to accumulate fluorescence measurements without introducing motion blur. The corrected fluorescence image at time point is then calculated as follows: The exponential smoothing factor is introduced to weight newer images more importantly than the previously accumulated signals. Figure 1 shows the proposed algorithm in a data flow diagram. Fig. 1Data flow diagram of the proposed algorithm: The raw color and fluorescence images are acquired and preprocessed in parallel. The optical flow is calculated for each structure-rich color image. The motion information is used to calculate a motion-corrected version of the fluorescence image which is exponentially weighted and accumulated. Thus, the motion-corrected fluorescence image gains from virtually extended exposure time without introducing motion artifacts. 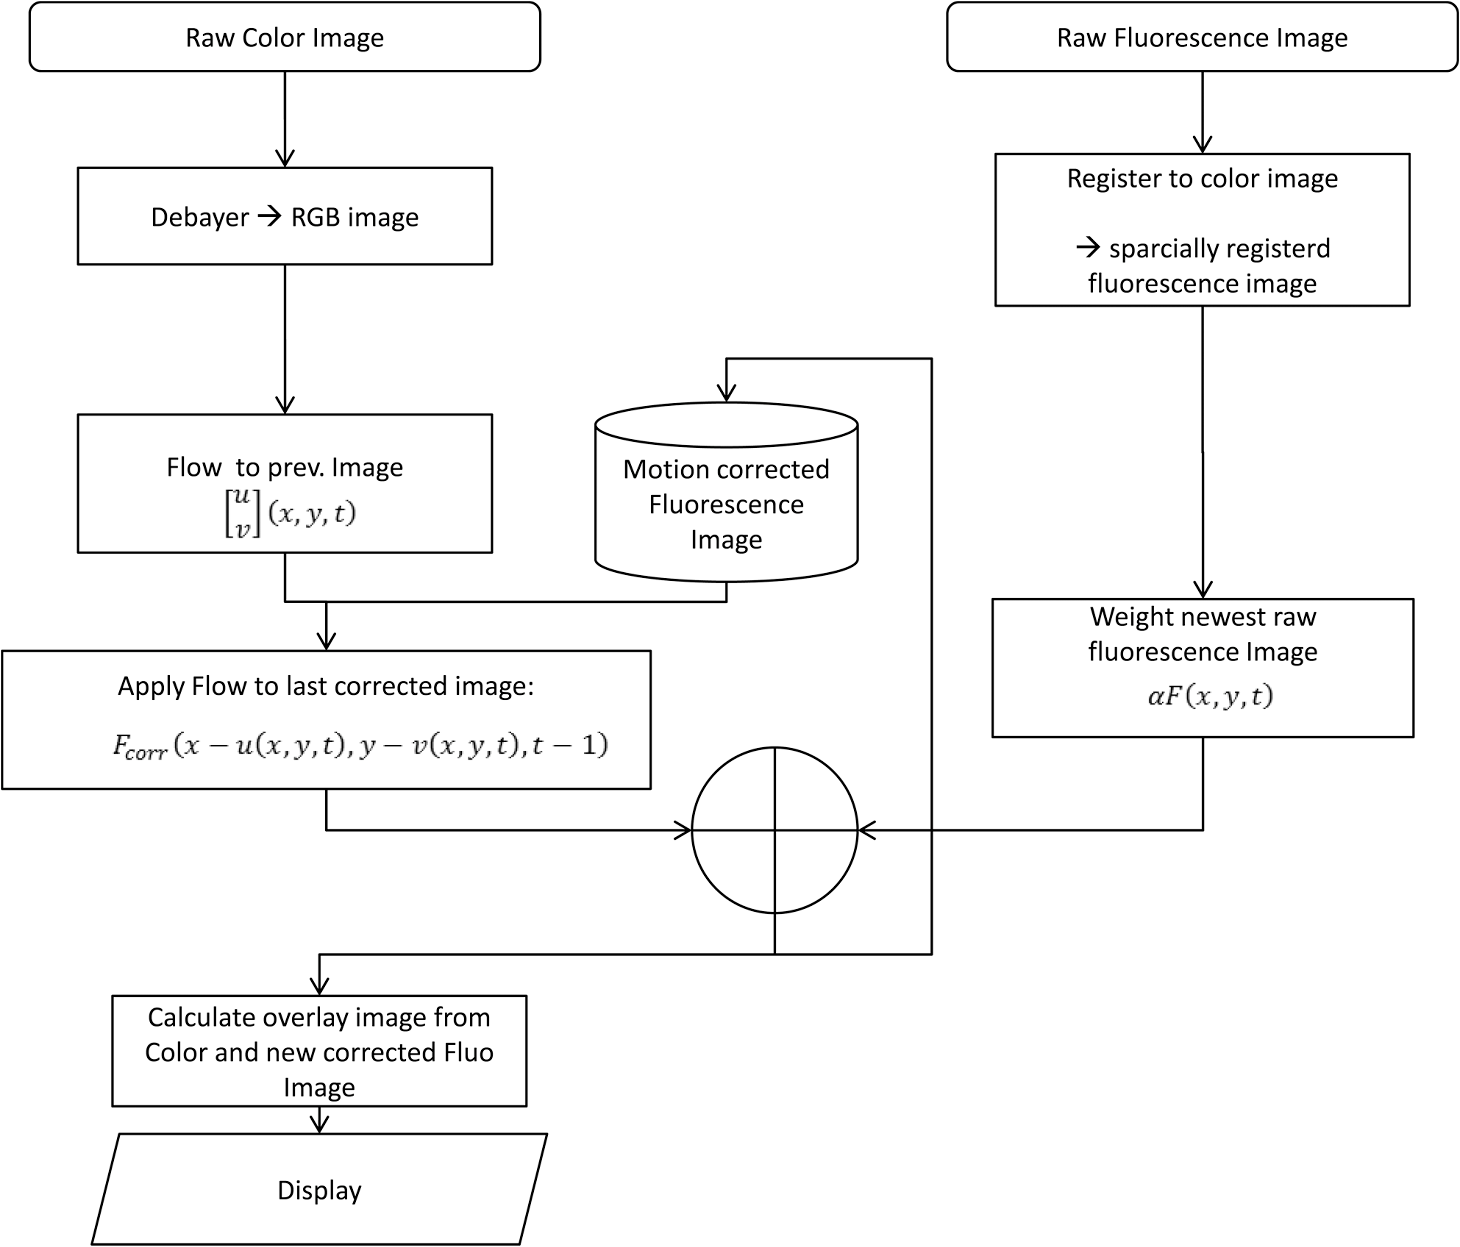 Obviously, optical flow algorithms work more reliably when tissue motion is slower than the video-rate capture. In this case, motion can be accurately captured and more precisely corrected. In order to monitor the speed of tissue movement and dynamically estimate the operational accuracy of the algorithm, we employed a data-driven reliability detection algorithm. There are different alternatives for establishing such reliability metric. One approach records a residuum between calculated velocities and the smoothness inducing operator. To retain independency from the capability of the used optical flow algorithm to provide this quality metric, we instead opted for utilizing a cutoff threshold approach. When resulting velocities are over a certain threshold, the entire motion compensation is reinitialized. This situation is recognizable by the user and created acceptable detection limits. A typical demonstration case for the reliability estimator is a fast hand movement in front of the camera. In algorithm operational measurements, we observed that after a fast movement event, a valid reinitialized fluorescent image featuring excellent imaging statistics was available in less than 2 s. A demonstration of the motion inconsistency detection is included to the supplementary media. In general, the noise contribution during image acquisition can be classified by its dependence on the exposure time. Time independent noise contributions refer to detector electronics (read out noise) or quantization error and it is added each time an image is read from the sensor. Time-dependent noise is noise that depends on the exposure time. Besides Poissonian statistics of the shot noise, other sources of error could be present here, including laser fluctuations such as drift. Typically, it can be assumed that the optical flow measurement can contribute to improving the signal-to-noise ratio (SNR) of the fluorescence measurement, since the algorithm can be effectively seen as a virtual filtered expansion of the exposure time. This could be effectively shown for test applications as described in the following. For evaluating the maximal achievable image enhancement, the corrected fluorescence image can be written in summation notation as where and represent the motion-compensated image coordinates accordingly and are the weights for the ’th-last frames . , where is the proposed exponential smoothing factor.For high photon incidence numbers, the Poisson-distributed shot noise can be modeled by a Gaussian distribution. The SNR is defined as . Where is the mean of the signal and is the standard deviation of the random variable of length , where is the mean of . The standard deviation for the weighted sum calculates to where is the number of used frames and is the proposed exponential smoothing factor.For a long running algorithm, the maximum standard deviation improvement denotes as By here, the SNR improves by a factor of compared to single fluorescence images The factor shows that the theoretical improvement depends on both the noise of the single frames and the smoothing factor . An already noise-free image cannot be improved by virtually extending the exposure time. Decreasing would indeed improve the SNR gain; however, decrease the reaction rate after image initialization or occultation. Assuming accurate motion vector fields, the resulting optical transfer function is not altered by the proposed method; however, the exponential smoothing concept is designed to compensate possible error propagation caused by slight optical flowfield inaccuracies. 2.3.Phantom ExperimentThe described method was first validated on phantom measurements. The phantom consisted of two transparent 0.5 mm diameter tubes that contained 32 μL of the fluorescent dye IRDye 800CW (LI-COR Biosciences, Lincoln, Nebraska) diluted in phosphate buffered saline. The dye concentration amounted to 1.7 μM in both tubes, which resulted in an active mass of approximately 26.7 fmol per sensor element. The mass per pixel was approximated by the proportion of one pixel area to the covered tube area within the image. The tubes were sealed and fixated on a rigid plate. For evaluation purposes, two photogrammetric targets (colored circles) were additionally fixed on the plate. The rigid plate was moved back and forth perpendicular to the tube axis, thus mimicking the movements caused by breathing motions. The phantom was placed under the two-channel intraoperative camera system and a video was recorded with 80 ms exposure time. The targets were tracked to determine the actual phantom movements and an image of the still phantom was acquired at a sufficiently high-exposure time. This image, when displaced with the calculated motion, yielded a ground truth video, which was used to validate the movement estimated by the optical flow method. 2.4.Mice and Tumor Allograftsmice (Harlan, Rossdorf, Germany) were used in this study. The animals were inoculated with 4T1 mouse breast cancer allografts ( cells on the back). When the tumors reached 8–10 mm diameter (usually 7–10 days post inoculation), the animals were intravenously injected with bevacizumab-CW800 (total injection dose 100 μg). After 24 h of the injection, the mice were anesthetized with KG ketamine and KG xylazine and imaged using the described imaging setup. Following the imaging experiments, the animals were sacrificed with an overdose of ketamine/xylazine. All the procedures with experimental animals were approved by the government of Bavaria. 3.Results3.1.Phantom ExperimentA video frame of the performed experiment is displayed in Fig. 2, showing the two tubes filled with IRDye-CW800 fixed on the rigid plate. The two blue circles shown on the photograph were used as photogrammetric markers. The markers were employed to capture two-dimensional control positions for single images for algorithm validation as mentioned later. The center of the blue circles is shown with a yellow dot. Subsequently, the phantom was moved by hand in an up and down directions to simulate breathing-induced motion. Tracking the movement of the center of the blue marker revealed the motion pattern shown by the green line. The total movement was 32 mm whereby the distance between the longer axes of the area tracked by the green line was 2 mm. The visualized movement lasted 3 s, mimicking a plausible respiration rate for anesthetized patients. Fig. 2Color image of the phantom, showing the two tubes filled with fluorescent dye and the two position markers (blue circles). The yellow dots indicate the current marker positions as determined by photogrammetric tracking, while the green line describes the moving path over the experiment. (Video 1, MOV, 5.8 MB).  Video 1Phantom experiment—original fluorescence data overlay. Raw fluorescence overlay video of the phantom experiment corresponding to Fig. 4(c) (MOV, 5.8 MB) [URL: http://dx.doi.org/10.1117/1.JBO.19.4.046012.1].  The fluorescence intensities along the vertical gray line highlighted in Fig. 2 are plotted in Fig. 3. Therein, the dotted curve shows the measured signal from a fluorescence frame captured by the camera. The two tubes exhibit a variation in their maximum intensity due to inhomogeneities of the illumination. The low-exposure time necessary to sustain video-rate imaging resulted in a SNR of 22.1 dB. Conversely, the solid-line curve shows the profile of a fluorescence image processed with the proposed optical flow algorithm using exponential smoothing (80 ms raw fluorescence exposure time, smoothing factor ). It can be seen that the SNR improved significantly, resulting in a value of 33.2 dB. The fact that the two peaks of the ground truth curve (green) align with the peaks of the motion-corrected curve (blue) proves that no spatial offset is introduced by the proposed method. Fig. 3Fluorescence intensity along the vertical axis indicated in gray in Fig. 1. Plotted in red is the measured intensity, green denotes the calculated ground truth and blue denotes the result of the optical flow correction.  Figure 4 shows a comparison of an optical flow corrected image and the corresponding unprocessed data. The fluorescence image in Fig. 4(a) contains a significant amount of noise due to the low-exposure time and high gain required to detect the signal. The segmented overlay shown in Fig. 4(c) shows the fluorescent dye not as a solid structure but rather as grainy individual spots. In contrast, Fig. 4(b) has been corrected by the proposed method and thus exhibits an increased SNR, where both the background and the tube appear more homogeneous. Consequently, the overlay in Fig. 4(d) achieves an improved segmentation and accurately highlights the dye. Fig. 4(a) Raw fluorescence image detail of the tube phantom. (b) Motion-corrected fluorescence. (c) Pseudocolor overlay of raw fluorescence signal on the color image (Video 1, MOV, 5.8 MB). (d) Overlay using motion-corrected fluorescence data (Video 2, MOV, 5.2 MB). Video 3 (MOV, 4.7 MB) shows the corresponding acquisition with prolonged exposure time (591 ms) without motion compensation.  Video 2Phantom experiment—proposed algorithm—overlay using motion corrected fluorescence data. The motion information is used to calculate a motion corrected version of the fluorescence image which is exponentially weighted and accumulated. Thus the motion corrected fluorescence image gains from virtually extended exposure time without introducing motion artefacts. (MOV, 5.2 MB) [URI: http://dx.doi.org/10.1117/1.JBO.19.4.046012.2].  Video 3Phantom experiment—long exposure time fluorescence data overlay. This video demonstrates that prolonging the true imaging exposure time is decreasing noise but also inducing motion blur. (MOV, 4.7 MB) [URI: http://dx.doi.org/10.1117/1.JBO.19.4.046012.3].  3.2.Mouse ExperimentThe feasibility of optical flow corrected fluorescence imaging was demonstrated on a subcutaneous tumor model in a mouse. Figure 5(a) shows a raw epifluorescence image frame of the tumor, exhibiting an SNR of 35.3 dB due to the limited exposure time. Conversely, the image shown in Fig. 5(b) has been motion corrected in real time by our proposed method, improving the SNR to 40.5 dB. Exponential smoothing was performed with a value of , resulting in a rapid signal accumulation. The SNR gain is not as substantial as in the phantom experiment due to better signal quality of the raw fluorescence data for this in vivo measurement. Even lower fluorescence tracer administration would be sufficient here. The pseudocolor overlay of the corrected fluorescence signal on the color channel image is displayed in Fig. 5(c). Figure 6 highlights the fluorescence intensities on a line profile through the tumor. The position of the profiled line is indicated in Fig. 6(a). Figure 6(b) shows the raw fluorescence intensities (dotted line) and the corresponding motion-corrected fluorescence intensities along the same profile. The corrected and uncorrected intensity profile basically shows the same fluorescence distribution scheme with reduced noise level but without introducing motion blur or sampling-induced shifts. Fig. 5(a) Raw fluorescent data of a subcutaneous tumor acquired at video-rate acquisition rates (80 ms). (Video 4, MOV, 6.4 MB). The short acquisition time in combination with the fluorescent signal strength is inducing noise (SNR 35.3 dB). Heartbeat and breathing of the imaged mouse are causing motion. (b) Corresponding motion-corrected fluorescence signal calculated by the described CUDA implementation instantly (SNR 40.5 dB). (Video 5, MOV, 3.8 MB). (c) Overlay image showing the corresponding color frame with the overlaid corrected fluorescence information. Video 6 (MOV, 31.6 MB). (Video 7, MOV, 33.2 MB) shows the color reflection without overlay. 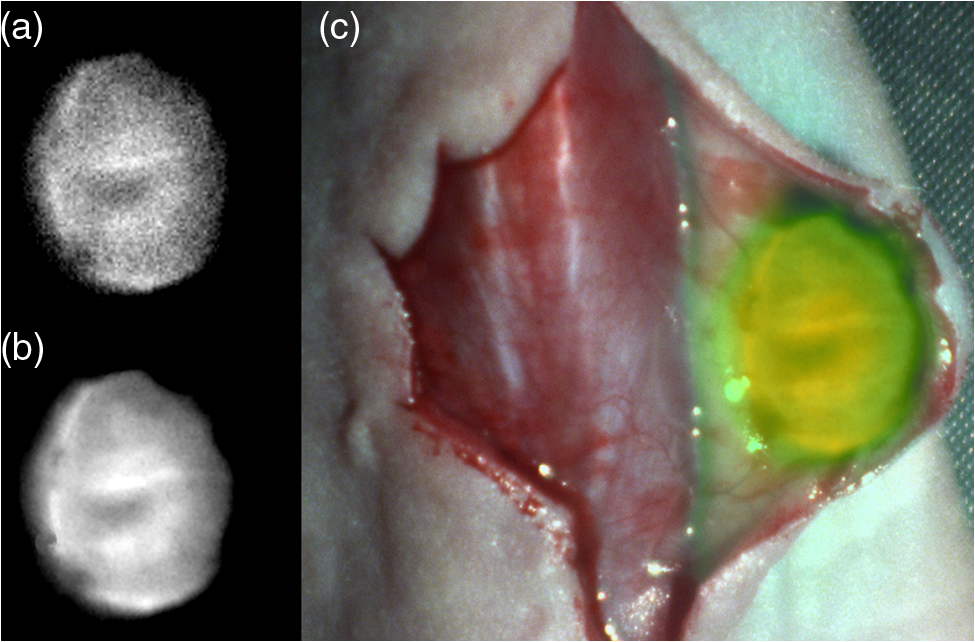 Video 4In vivo experiment—raw fluorescence channel. Raw fluorescence channel movie of the performed in vivo experiment. (MOV, 6.4 MB) [URI: http://dx.doi.org/10.1117/1.JBO.19.4.046012.4].  Video 5In vivo experiment—proposed algorithm—motion-compensated fluorescence channel. Motion-compensated fluorescence channel movie of the performed in vivo experiment. The motion information is used to calculate a motion corrected version of the fluorescence image which is exponentially weighted and accumulated. Thus the motion corrected fluorescence image gains from virtually extended exposure time without introducing motion artefacts. (MOV, 3.8 MB) [URI: http://dx.doi.org/10.1117/1.JBO.19.4.046012.5]. 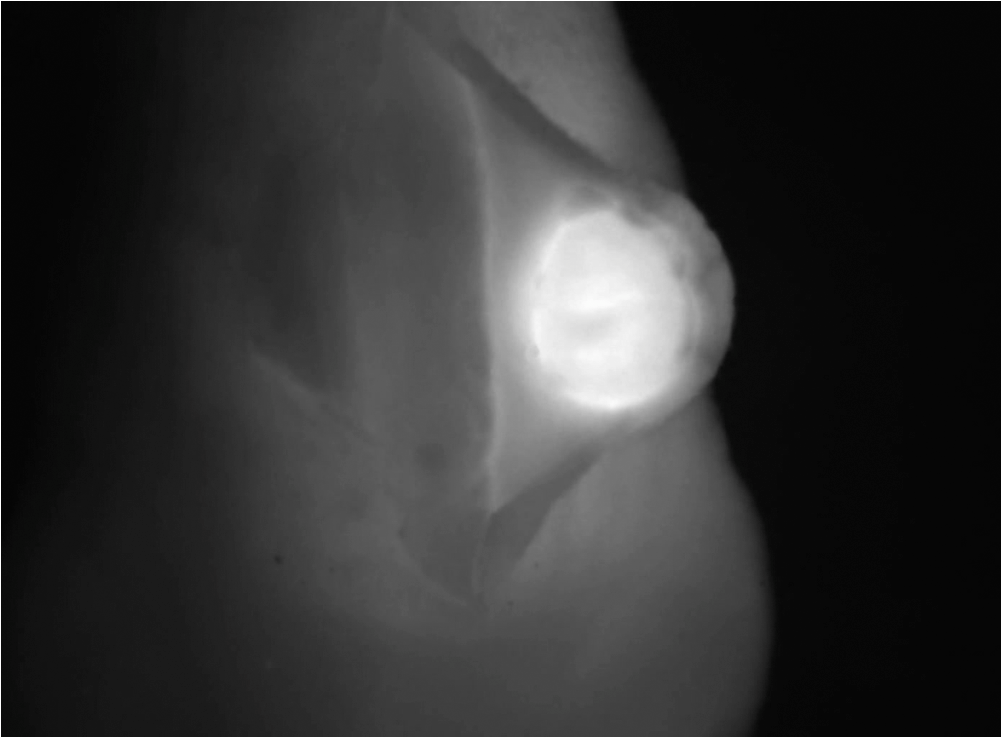 Video 6In vivo experiment—proposed algorithm—overlay of motion corrected fluorescence channel. Overlay of motion corrected fluorescence channel movie of the performed in vivo experiment. The motion information is used to calculate a motion corrected version of the fluorescence image which is exponentially weighted and accumulated. Thus the motion corrected fluorescence image gains from virtually extended exposure time without introducing motion artefacts. (MOV, 31.6 MB) [URI: http://dx.doi.org/10.1117/1.JBO.19.4.046012.6].  Video 7In-vivo experiment—color reflectance images. Color reflectance movie of the performed in vivo experiment. (MOV, 33.2 MB) [URI: http://dx.doi.org/10.1117/1.JBO.19.4.046012.7].  Fig. 6It shows the profile through the exposed tumor. (a) The solid line indicates the position of the sampled image profile. (b) The dotted line indicates the uncorrected fluorescence intensity. The solid line indicates the motion-corrected fluorescence intensity.  Video recordings of the uncorrected fluorescence signal, optical flow corrected fluorescence, and acquisition with prolonged exposure time are available as supplementary media. 4.DiscussionThis work examined the implementation of a optical flow algorithm to video-rate fluorescence imaging considered for open surgery and endoscopic applications. We could show that calculating the optical flow and introducing a motion-corrected virtual image sensor improves the SNR in the images and therefore enhances the camera sensitivity. This was demonstrated in both phantom measurements and intraoperative applications on animals in vivo. The implemented optical flow algorithm assumes and generates smooth velocity vector fields as a matter of its design and assumptions. We demonstrated the principle and potential of incorporating velocity information as a framework for considering optical flow algorithms in routine examination. However, it is foreseen that depending on the particular applications the acquisition speed, number of pixels employed for a given field of view and several related parameters will need adjustment for ensuring optimal performance compatible with the speed and signal-to-noise specifics of the problem studied. Regardless, by employing in vivo measurements and bevacizumab-CW800, an agent with high clinical relevance, we demonstrated that the parameters employed herein suffice for delivering improved sensitivity and signal to noise using the optical flow algorithm. To prevent from calculation discontinuities when unrealistic motions occur, for example, in rapid camera movement to relocate its viewing position, we further implemented a motion inconsistency detection to measure and discard artificial values generated due to fast motion. Regardless, by operating the camera at video rates () we ensured that at all times the relative motion movement of tissue results in slower time components compared to the fluorescence frame refresh rate. An important further development herein is the implementation of a globally dense optical flow algorithm (Horn and Schunk) on CUDA. We demonstrated that the application of this algorithm can lead to real-time operation, which is an important feature for practical integration of this approach into the operating room. Possible foreseen applications include any camera-based surgical or endoscopic fluorescence imaging application. This could include open surgery using fluorescence molecular imaging approaches which is an emerging field in surgery.27,28 Likewise, the emergence of diverse fluorescence imaging strategies to enhance endoscopic detection, such as esophageal imaging or in colonoscopy,29,30can similarly benefit for strategies that enhance the sensitivity of fluorescence imaging. Depending on different additional image effects, such as visible fiber honeycomb patterns in the color images or strong lens distortions, additional preprocessing methods such as pattern interpolation or distortion corrections may be necessary to fulfill the optical flow assumptions. Further research is necessary in these topics. Overall, video-rate fluorescence imaging becomes very important in large field of view applications where typically real-time video-rate operation is beneficial for the physician. In these cases, however, there are only a few tenths of milliseconds available to each fluorescence frame, which make detection particularly challenging. While most static applications on small animal imaging, as performed over the past decade, may average fluorescence signals over at least a second or more, the operation in video rate requires cameras with at least an order of magnitude better sensitivity or the use of such SNR-enhancing algorithms in order to maintain reasonable detection limits. It is also interesting to note that a surgeon or endoscopist moves the camera in interrogation mode but typically reduces its motion when a suspicious lesion is identified. During those moments, the optical flow algorithm may offer the most optimal results by offering signal averaging operation with small pixel displacements leading to highly accurate images. Therefore, its use over conventional video-rate systems may prove highly beneficial. ReferencesJ. Ferlayet al.,
“GLOBOCAN 2008 v2.0, cancer incidence and mortality worldwide: IARC CancerBase No. 10,”
(2012) http://globocan.iarc.fr December ). 2012). Google Scholar
C. M. Smittet al.,
“The importance of the lumpectomy surgical margin status in long term results of breast conservation,”
Cancer, 76 259
–267
(1995). http://dx.doi.org/10.1002/(ISSN)1097-0142 60IXAH 0008-543X Google Scholar
V. Ntziachristos,
“Going deeper than microscopy: the optical imaging frontier in biology,”
Nat. Methods, 7
(8), 603
–614
(2010). http://dx.doi.org/10.1038/nmeth.1483 1548-7091 Google Scholar
G. MooreW. Peyton,
“The clinical use of fluorescein in neurosurgery: the localization of brain tumors,”
J. Neurosurg., 5
(4), 392
–398
(1948). http://dx.doi.org/10.3171/jns.1948.5.4.0392 JONSAC 0022-3085 Google Scholar
L. Yannuzziet al.,
“Digital indocyanine green videoangiography and choroidal neovascularization,”
Retina, 12
(3), 191
–223
(1992). http://dx.doi.org/10.1097/00006982-199212030-00003 RETIDX 0275-004X Google Scholar
J. Wineret al.,
“Intraoperative localization of insulinoma and normal pancreas using invisible near-infrared fluorescent light,”
Ann. Surg. Oncol., 17
(4), 1094
–1100
(2010). http://dx.doi.org/10.1245/s10434-009-0868-8 1068-9265 Google Scholar
V. NtziachristosJ. YooG. van Dam,
“Current concepts and future perspectives on surgical optical imaging in cancer,”
J. Biomed. Opt., 15
(6), 066024
(2010). http://dx.doi.org/10.1117/1.3523364 JBOPFO 1083-3668 Google Scholar
R. Y. Tsien,
“Building and breeding molecules to spy on cells and tumors,”
FEBS Lett., 579
(4), 927
–932
(2005). http://dx.doi.org/10.1016/j.febslet.2004.11.025 FEBLAL 0014-5793 Google Scholar
R. WeisslederM. Pittet,
“Imaging in the era of molecular oncology,”
Nature, 452
(7187), 580
–589
(2008). http://dx.doi.org/10.1038/nature06917 NATUAS 0028-0836 Google Scholar
G. van Damet al.,
“Intraoperative tumor-specific fluorescence imaging in ovarian cancer by folate receptor- targeting: first in-human results,”
Nat. Med., 17
(10), 1315
–1319
(2011). http://dx.doi.org/10.1038/nm.2472 1078-8956 Google Scholar
W. Scheueret al.,
“Drug-based optical agents: infiltrating clinics at lower risk,”
Sci. Trans. Med., 4
(134), 134ps11
(2012). http://dx.doi.org/10.1126/scitranslmed.3003572 STMCBQ 1946-6234 Google Scholar
Guidance for Industry, Exploratory IND Studies, Center for Drug Evaluation, and Research, U.S. Department of Health, and Human Services, FDA, Washington
(2006). Google Scholar
P. Y. MullerF. R. Brennan,
“Safety assessment and dose selection for first-in-human clinical trials with immunomodulatory monoclonal antibodies,”
Clin. Pharmacol. Ther., 85
(3), 247
–258
(2009). http://dx.doi.org/10.1038/clpt.2008.273 CLPTAT 0009-9236 Google Scholar
W. Scheueret al.,
“Drug-based optical agents: infiltrating clinics at lower risk,”
Sci. Trans. Med., 4
(134), 134ps11
(2012). http://dx.doi.org/10.1126/scitranslmed.3003572 STMCBQ 1946-6234 Google Scholar
F. KendoulI. FantoniK. Nonami,
“Optic flow-based vision system for autonomous 3D localization and control of small aerial vehicles,”
Robot. Auton. Syst., 57
(6–7), 591
–602
(2009). http://dx.doi.org/10.1016/j.robot.2009.02.001 RASOEJ 0921-8890 Google Scholar
M. TistarelliG. Sandini,
“On the advantages of polar and log-polar mapping for direct estimation of time-to-impact from optical flow,”
Pattern Anal Mach Intell, IEEE Trans., 15
(4), 401
–410
(1993). http://dx.doi.org/10.1109/34.206959 ITPIDJ 0162-8828 Google Scholar
S. Yamamotoet al.,
“Realtime multiple object tracking based on optical flows,”
in Proc. Robotics and Automation, 1995 IEEE International Conference,
2328
–2333
(1995). Google Scholar
A. BruhnJ. WeickertC. Schnörr,
“Lucas/Kanade meets Horn/Schunck: combining local and global optic flow methods,”
Int. J. Comput. Vision, 61
(3), 211
–231
(2005). http://dx.doi.org/10.1023/B:VISI.0000045324.43199.43 IJCVEQ 0920-5691 Google Scholar
B. K. P. HornB. G. Schunck,
“Determining optical flow,”
Artif. Intell., 17
(1), 185
–203
(1981). http://dx.doi.org/10.1016/0004-3702(81)90024-2 AINTBB 0004-3702 Google Scholar
Compute Unified Device Architecture Programming Guide, NVIDIA Corporation, Santa Clara, California(2007). Google Scholar
D. KirkW. Wen-mei, Programming Massively Parallel Processors: a Hands-on Approach, Morgan Kaufmann, Burlington, Massachusetts
(2010). Google Scholar
L. LigowskiW. Rudnicki,
“An efficient implementation of Smith Waterman algorithm on GPU using CUDA, for massively parallel scanning of sequence databases,”
in Proc. IEEE International Symposium on Parallel & Distributed Processing,
(2009). Google Scholar
J. NickollsW. J. Dally,
“The GPU computing era,”
Micro, IEEE, 30
(2), 56
–69
(2010). http://dx.doi.org/10.1109/MM.2010.41 0272-1732 Google Scholar
J. Glatzet al.,
“Concurrent video-rate color and near-infrared fluorescence laparoscopy,”
J. Biomed. Opt., 18
(10), 101302
(2013). http://dx.doi.org/10.1117/1.JBO.18.10.101302 JBOPFO 1083-3668 Google Scholar
M. Smirnov,
“Optical flow estimation with CUDA,”
(2012). http://docs.nvidia.com/cuda/samples/3_Imaging/HSOpticalFlow/doc/OpticalFlow.pdf Google Scholar
H. S. MalvarL.-w. HeR. Cutler,
“High-quality linear interpolation for demosaicing of Bayer-patterned color images,”
in Acoustics, Speech, and Signal Processing, 2004. Proceedings.(ICASSP’04). IEEE International Conference,
iii
–485
(2004). Google Scholar
A. SarantopoulosN. BeziereV. Ntziachristos,
“Optical and opto-acoustic interventional imaging,”
Annal. Biomed. Eng., 40
(2), 346
–366
(2012). http://dx.doi.org/10.1007/s10439-011-0501-4 ABMECF 0090-6964 Google Scholar
B. E. Schaafsmaet al.,
“The clinical use of indocyanine green as a near-infrared fluorescent contrast agent for image-guided oncologic surgery,”
J. Surg. Oncol., 104
(3), 323
–332
(2011). http://dx.doi.org/10.1002/jso.v104.3 JSONAU 0022-4790 Google Scholar
P. Hsiunget al.,
“Detection of colonic dysplasia in vivo using a targeted heptapeptide and confocal microendoscopy,”
Nat. Med., 14
(4), 454
–458
(2008). http://dx.doi.org/10.1038/nm1692 1078-8956 Google Scholar
P. B. Garcia-Allendeet al.,
“Enriching the interventional vision of cancer with fluorescence and optoacoustic imaging,”
J. Nucl. Med., 54
(5), 664
–667
(2013). http://dx.doi.org/10.2967/jnumed.111.099796 JNMEAQ 0161-5505 Google Scholar
|


