
|
|
1.IntroductionThe Mueller matrix represents the transfer function of an optical system in its interactions with polarized light and its elements relate to specific polarization properties of light emerging from the media, such as depolarization, diattenuation, linear retardance, and optical rotation. These optical parameters depend on the intrinsic properties of the media morphological parameters such as the density, size, distribution, shape, and refractive index of scatterers.1–6 However, multiple scattering in optically thick turbid media causes extensive depolarization that confounds the resulting matrix elements. This phenomenon is called “lumped” effects.7 So, it is essential to consider these effects as resulting from a cascade of individual effects, and not from only their addition.8 Currently, the Mueller matrix decomposition (MMD) method exists to extract these individual properties in chiral turbid media.9–13 Researchers have attempted to utilize the MMD method to probe optical rotation of biological tissues.14–18 Pham and Lo15 proposed a method based on MMD to extract the optical rotation angle () of a polystyrene (PST) sphere suspension containing dissolved D-glucose () powder. Ghosh et al.7,10,13 detected the Mueller matrices of a PST sphere suspension containing sucrose in the forward scattering geometry and yielded reasonable estimates for optical rotation. Manhas et al.16 proved that the MMD method could be used to extract the component of optical rotation arising purely due to the circular retardance property of the medium prepared using known concentration of PST scatterers and glucose molecules. Firdous and Ikram17 measured the glucose concentrations in aqueous humor media with MMD method. These investigations represent an important step toward the development of a glucose sensor that may eventually be capable of detecting glucose levels of diabetic patients. However, as far as we know, there is no report on detecting the optical rotation of human blood glucose utilizing the MMD method. Hence, it is needed to further investigate the applications of MMD method in diabetes. In this study, we utilize the MMD method to analyze the optical activity of glucose molecules in chiral turbid media including a tissue phantom composed of an aqueous solution of glucose mixed with PST sphere suspensions, chicken blood, and the vein blood plasma of diabetic patients. We aim to test the feasibility of MMD method in diabetic diagnosis and monitoring. 2.TheoryLu and Chipman18 proposed a three “basis” matrix decomposition of an arbitrary Mueller matrix composed of a depolarizer , a retarder , and a diattenuator . Thus, the Mueller matrix containing the combined effects of all polarizing properties of the media is isolated and quantified each effect separately. The depolarizer causes depolarization. The retarder causes dephasing of two eigen states. The diattenuator causes different amplitude changes for its orthogonal eigen states. In general, a Mueller matrix can be written as a matrix The second term in Eq. (1) is obtained when each element is normalized by . The measured matrix can be decomposed into the product of three “basis” matrices in the form16,18 The diattenuation matrix is defined as whereis a identity matrix, is the transmittance for unpolarized light, is diattenuation vector, and is its unit vector and are defined as The product of the retardance and the depolarizing matrices can then be obtained as The matrices , , and have the following form: where , polarization vector , is the submatrix of , is the submatrix of and it can be written asThe submatrix can be computed using as where , , and are the eigen values of . The sign “+” or “−” in the right side of Eq. (9) is the same as that of the determinant of . Using Eqs. (8) and (9), can be obtained asUsing Eqs. (7) and (10), the total retardance matrix can be computed. The decomposed retardance matrix can further be used to determine the value of optical rotation17 where are the elements of the retardance matrix . is the circular retardance (i.e., optical rotation). It can be seen that is not described by the direct measured quantities, so we applied the numerical computation to obtain it from the measured Mueller matrix. The resulting distributes in two-dimensional space, which gives more information compared to one point measurement.3.Method and Materials3.1.Experiment MethodIn the form of back detection geometry the retro-reflection of the beam along the same zig-zag path as the incident beam induced an equal and opposite counter-rotation and yielded a net measured optical rotation of .19 So in order to avoid the systematic errors, the forward detection geometry should be used.13,19,20 Figure 1 shows the experimental setup to obtain the Mueller matrix in the forward detection geometry. The light source is a semiconductor laser (Beijing LASER OptoMechatronic, Beijing, China). A linear polarizer whose polarized direction was orientated along the horizontal located behind the laser. Thus the incident light was linearly polarized light. We changed the linearly polarized direction from horizontal to other directions by use of a half-wave (HW) plate behind . A quarter-wave plate () followed HW. We use the combination of and HW to control the input polarization. After interacting with the sample, the polarized light then passed through a removable quarter-wave plate and an analyzer to allow for intensity detection of all polarization states. A black-and-white charge-coupled device (CCD, 12 bits, DH-SV1420FM, China Daheng Group Inc., Beijing, China) camera mounted with a lens (M0814-MP, Computer) was used for the imaging detection. The CCD chip had and a pixel size was . Two kinds of quartz cells with the dimensions of and were used to hold the liquid sample. The center point of scattering light on the back surface of cell was blocked with a 2-mm diameter black paper in order to avoid the CCD saturation. The whole experiments were carried out at a room temperature of . A Mueller matrix was calculated from 16 recorded polarization images.1,21 The 16 combinations were HH/HV/HP/HR, PH/PV/PP/PR, VH/VV/VP/VR, and RH/RV/RP/RR. Each measurement was represented by two letters, where the first letter denotes the incident polarization state and the second letter denotes the detection polarization state. The -axis was chosen as the reference axis. H, V, and P were selected as the linearly polarized light that has polarization directions aligned with the -axis, -axis, and at 45 deg toward the -axis, respectively. R is the right-handed circularly polarized state that denotes the alignment of the fast axis of a QW plate at 45 deg toward the -axis. For example, the HV element represents the image acquired with the incident polarization H and detection polarization V. The Mueller matrix can be calculated from these measured combinations1,21 From the above equation, the accuracy of Mueller matrix measurement is determined by the intensity of various polarizations. 3.2.MaterialsD-(+)-Glucose is the principal carbohydrate metabolite; it is utilized by the tissues, and it is absorbed from the alimentary tract in greater amounts than any other monosaccharide. Glucose could serve satisfactorily in meeting at least 50% of the entire energy needs of humans and various animals. PST sphere suspension is always used as the tissue-simulating phantoms. The sphere morphology and size distribution showed in our previous work.22 Because of monodispersion, narrow distribution, and sphere structure, the scattering effect of PST sphere suspensions can be analyzed using Mie scattering theory.23 We chose glucose solution D-(+)-glucose (Sigma–Aldrich Inc., St. Louis) as the chiral medium, PST sphere suspension (Wuxi Nanozymics Biotech Co., Ltd., Wuxi, China) as a type of turbid medium and their mixture as the chiral turbid medium. When 100 g glucose powder dissolved in 100 ml water solution, we called the maximum concentration 100% by weight. We dissolved 10, 30, 50, 60, 70, and 80 g glucose powder into the deionized water, respectively, to obtain the different concentrations of the glucose named 10%, 30%, 50%, 60%, 70% and 80% by weight. We diluted the original PST sphere suspension with the concentration of 2.5% (2.5 g PST sphere in 100 ml water) with deionized water to obtain the dilute PST sphere suspension of 0.03%. The PST spheres with particle diameters of 200, 500, 650 and 1000 nm were used as the scatterers. The PST sphere suspensions were fully vibrated with ultrasonic device to avoid the reunion before using. We also chose chicken blood as another type of turbid medium before testing human blood. The fresh chicken blood samples were obtained from the slaughter house. They were kept in anticoagulant tubes to avoid solidification. We diluted the fresh chicken blood with deionized water to obtain the dilute chicken blood of 30% by volume. We chose the glucose solution with the concentrations of 10%, 30%, 45%, 57%, and 70% as the chiral media. When they were mixed with the dilute chicken blood, five different chiral turbid media of chicken blood were obtained. At last, we tested seven diabetic patients’ vein blood. The diabetic subjects (five men and two women) aged 34 to 84 years were recruited at the Capital Normal University Hospital. Their fresh blood samples were collected at the same time. They were kept in anticoagulant tubes before being diluted. The seven volunteers′ blood samples were poured into a quartz sample cell (). It took about 1 h for blood plasma from being drawn out of diabetic patients to be used in the experiment. 4.Results and DiscussionsFirst of all, we determined the accuracy of the Mueller matrix measurement system. We placed nothing at the sample position in Fig. 1. In this case, the Mueller matrix reflected various polarization modulations. Table 1 is the experimentally recorded Mueller matrix. The Mueller matrix should be a unit matrix theoretically. Comparing with the theoretical value, we obtained the maximum of relative error for all elements as 2%. Table 1The experimentally recorded Mueller matrix.
Then, we tested the validity of the numerical algorithm of and accuracy of the experimental setup, the calibration experiment was performed on the sample with known optical rotation values. The known optical component was a quartz crystal with optical rotation angle 90 deg at the wavelength of 650 nm. The quartz crystal was located at the position of sample shown in Fig. 1. Figure 2 shows the spatial intensity distribution of extracted optical rotation angle of the quartz crystal. We chose the average value in a circle with the radius of 4 mm as the actual value. The measured rotation angle was . The measurement error is originated from the angular accuracy of optical elements including linear polarizer, HW plate, and QW plate. On the whole, it was in good accordance with the nominal value and the accuracy was reasonable. So the numerical algorithm was valid and the experimental setup is credible. Fig. 2Spatial intensity distribution of the rotation angle of the quartz crystal with optical rotation angle 90 deg.  4.1.Optical Rotation of Different Glucose SolutionsWe measured the rotation angles of glucose in the mixture of different concentrations of glucose solutions and the same concentrations of PST sphere suspensions. The concentrations of glucose solutions were various as 10%, 30%, 50%, 60%, 70%, and 80% by weight. The particle sizes of PST sphere were chosen as 200, 500, 650, and 1000 nm, whereas their suspension concentration was fixed at 0.03%. We chose 35 pixels along a radius direction, and then took average value of every five continuous pixels to stand for their value. We found that seven average values, i.e., rotation angle along the radius direction ranged from 2 to 5.5 mm were almost unchanged due to dilute PST sphere suspensions. So, we selected a ring zone to determine the rotation angle. For example, Fig. 3 shows the spatial distribution of rotation angle of the glucose solution with the concentration of 60% in the PST sphere suspension with the concentration of 0.03%. The value of rotation angle was the average value in the ring zone of 1 mm (). Figure 4 shows the relationships between the rotation angles of different particle sizes of PST sphere and glucose concentrations in PST sphere suspension with the concentration of 0.03%. The results showed that the rotation angle corresponding to each glucose concentration increased with the increasing of the glucose concentration. The relationship presented the linear form. In addition, the rotation angle corresponding to each glucose concentration also increased with the increasing of the particle sizes. The error bars represent the standard deviation in the optical rotations derived. They are smaller than the size of the symbols when the concentration of PST sphere suspension was low. Fig. 3Spatial distribution of the rotation angle of glucose with the concentration of 60% and the schematic diagram of ring zone. 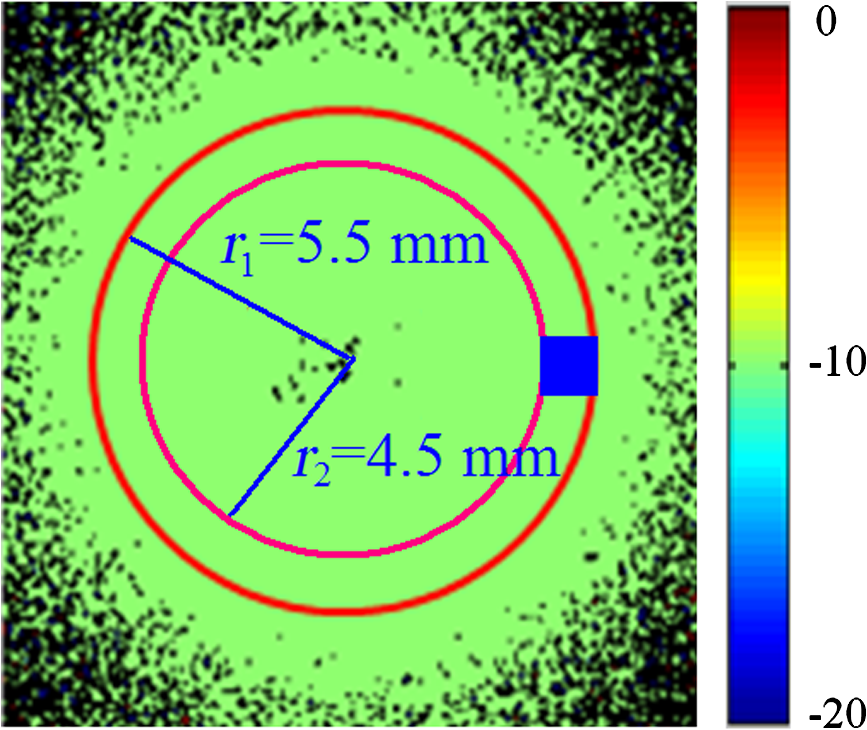 Fig. 4Linear fitting results between the rotation angle and glucose concentration in polystyrene (PST) sphere suspension.  In Secs. 4.1–4.4, the chiral turbid medium was filled up the quartz cell with the dimension of . The rotation angle was a statistical average value in a ring zone shown in Fig. 2. The laser wavelength was kept 650 nm except Sec. 4.3. The linear relationship between the rotation angle and the glucose concentration implied that the rotation angle is induced by the glucose other than the scattering. However, the scattering effect influenced the rotation angle. According to Mie theory,23 the scattering coefficients of 0.03% PST with the particle size of 200, 500, 650, and 1000 nm are 1.552, 6.242, 8.176, and , scattering anisotropy are 0.747, 0.935, 0.952, and 0.954, respectively. The results show that the rotation angle corresponding to each glucose concentration increased with the increasing of scattering coefficients and scattering is certainly forward peaked. So the forward detection geometry used in this work is reasonable. In general, the rotation angle of pure chiral materials is defined as24 where is the specific rotation of the molecule usually given in and dependent on the temperature and wavelength of the light, is the photon path length through the medium, and is the concentration of the optically active molecules. In Fig. 4, the specific rotations of glucose in four size PST suspensions were 33.53, 37.23, 39.52, and 45.27 deg, respectively. The reason for different specific rotations is that the scattering coefficients of four PST sphere suspensions were different. Strictly speaking, Eq. (13) is valid only for clear media, as scattering results in an ambiguity in . The small increases in optical rotation in the presence of turbidity are caused by the increase in optical path due to multiple scattering, resulting in slight accumulations of . The experimental results were in accordance with the MC simulations24 and some studies.7,104.2.Optical Rotation in Different PST Sphere SuspensionsWe diluted the PST_2.5% sphere suspension with the particle size of 200 nm to 0.01%, 0.02%, 0.03%, 0.04%, and 0.05%, respectively. From a Mie scattering calculation, they correspond to a scattering coefficient of 0.517, 1.035, 1.552, 2.068, and , scattering anisotropy of 0.747. The concentration of the glucose solution was kept 30% unchanged. Figure 5 shows the relationship between the rotation angles and the concentrations of PST sphere suspensions. It can be seen that the rotation angle increased exponentially with increasing of the concentrations, i.e., scattering coefficient of PST sphere suspensions. The light experienced more scattering times in denser turbid media to emergent, thus the rotation angle became larger.7,10 4.3.Optical Rotation with Different Laser WavelengthsWe used the laser with the wavelengths of 405, 532, 650, 690, and 780 nm as the source. The chiral turbid medium was mixed with 40% glucose solution and 0.03% PST sphere suspension with the particle size of 650 nm. The effects of optical activity due to glucose in the visible and near-infrared region were modeled using Drude’s dispersion equation 25,26 where is the specific rotation of the molecule at the wavelength (nm) and certain temperature, is a constant specific to the molecule, and is the center wavelength. The parameters of Drude’s dispersion equation for glucose are and .27 Figure 6 shows the relationship between the rotation angles and the laser wavelengths. In Fig. 6, the measured data (transformed to the angle of 100% glucose) were labeled with symbol square, the red solid curve was plotted according to the Drude’s equation with the parameters of glucose and the green dash curve was plotted by fitting the Drude’s equation with the experimental data. As shown in Fig. 6, the optical rotation of glucose in turbid medium also presents dispersion like in the clear solution. From Fig. 6, the specific rotation from fitting curve and Drude’s equation at the wavelength of 589 nm are 54.47 and 53 deg, respectively. The experimental result is a little larger. The reason is that the scattering effect of the turbid medium enlarges the rotation angle slightly.4.4.Optical Rotation of Glucose in Chicken BloodBefore measuring the human blood, we first measured the rotation angle of different concentrations of glucose solution mixed with chicken blood. Figure 7 shows the relationship between the rotation angles and the concentrations of glucose solutions in chicken blood. From the fitting line, we obtained the specific rotation of glucose in the chicken blood is 35.20 deg. The particle size of the red blood cell (RBC) is about 5.56 μm. Its scattering coefficient is for RBC suspension with the concentration of 0.03% at the wavelength of 632.8 nm, because the scattering coefficient is up to for RBC suspension with the concentration of 10%.28 Thus, the specific rotation of glucose in the chicken blood is between that in PST sphere suspensions with the particle size of 200 nm (33.53 deg) and 500 nm (37.23 deg). The error bars are smaller than the size of the symbols. 4.5.Optical Rotation of Human BloodThe seven blood samples of diabetic volunteers filled up the quartz cell with the dimensions of . Table 2 presents the diabetic volunteers’ information including gender, age, and qualitative disease status judged by clinical diagnosis. Blood is the liquid components of the blood cells, the primary constituents being the proteins albumin, globulins, fibrinogen, cholesterol, and urea as well as glucose.26 Table 3 shows the typically experimental Mueller matrices and the decomposed total retardance matrices of subjects , , and . The Mueller matrices and the total retardance matrices were the average of the blue area shown in Fig. 3. But the rotation angle was the statistical average value in a ring zone shown in Fig. 3. The rotation angle of subject , i.e., the healthy person was about 0 deg. Figure 8 shows the rotation angles of original vein blood of diabetic subjects. The range of circular retardance was from 0 to 0.14 deg for seven samples. Table 2The information of diabetic subjects.
Table 3The experimentally recorded Mueller matrices and the decomposed matrices of total retardance for subject, 1#, 4#, and 7# and the corresponding parameters of the circular retardance.
The human blood is a kind of turbid media. Thus the Mueller matrix is not a unit matrix as shown in Table 3. According to the specific rotation of glucose (53 deg) and Eq. (13), we estimate the glucose concentrations of diabetic subjects to were 3.49, 4.43, 7.55, 16.98, 17.64, and . The reason that the rotation angle of subject was about 0 deg is because a typical human blood glucose level is .26 This concentration corresponds to the rotation angle of 0.01 deg, which is just on the error limit of this study. It is too small to be measured accurately in experiment. All of the glucose concentrations of diabetic subjects to were larger than normal concentration (). The experimental results were in accordance with the disease status judged by clinical diagnosis. Therefore, the disease status of seven diabetic patients is different and can be distinguished with the intrinsic optical rotation of glucose using MMD method. The circular retardance arises due to a difference in phase between right circularly polarized and left circularly polarized states. As an important tissue constituent, glucose can induce circular birefringence due to its asymmetric structure shown in Fig. 9 and its presence can leads to optical rotation. It occurs by virtue of the molecule’s chirality by which we mean the molecule has at least one center about which its mirror image cannot be superimposed upon itself. In such a case, random orientation of molecules in solution will result in a bulk difference in phase between right circularly polarized and left circularly polarized states.14,24,29 With regard to the accuracy of the optical rotation, we have shown that the high-sensitivity polarization modulation and synchronous detection in the experimental system. We used the forward detection geometry so that the scattering/detection geometry-induced artifacts are minimal. In the measurements of optical rotation of human blood, the thickness of cell is 2 cm in order to enlarge the rotation signals. 5.ConclusionWe have presented that the optical rotation of chiral molecule in turbid media can be extracted by the use of MMD method. The rotation angle presents the linear relationship with the concentration of the optical activity material and the scattering effect makes the rotation angle larger. In addition, the optical rotation abides by the Drude’s dispersion relation. Especially, the decomposition method has been found useful applications in quantifying the optical rotations of blood glucose. The results of diabetic patients show that the diabetic severity status can be distinguished with the rotation angle of glucose and are also in accordance with the clinical diagnosis. Thus, it can be concluded that the method of MMD has potential applications in diabetic diagnosis and monitoring. AcknowledgmentsThis research was supported by the National Natural Science Foundation under the Grant No. 61371055 and Beijing Natural Science Foundation under the Grant No. 4102031. We show our gratitude to all the volunteers who participated in the study. ReferencesP. Sunet al.,
“Spatial pattern characterization of linear polarization-sensitive backscattering Mueller matrix elements of human serum albumin sphere suspension,”
J. Biol. Phys., 39
(3), 501
–504
(2013). http://dx.doi.org/10.1007/s10867-013-9308-x JBPHBZ 0092-0606 Google Scholar
H. Heet al.,
“Two-dimensional backscattering Mueller matrix of sphere-cylinder scattering medium,”
Opt. Lett., 35
(14), 2323
–2325
(2010). http://dx.doi.org/10.1364/OL.35.002323 OPLEDP 0146-9592 Google Scholar
C. BaravianJ. Dillet,
“Birefringence determination in turbid media,”
Phys. Rev. E, 75
(3), 032501
(2007). http://dx.doi.org/10.1103/PhysRevE.75.032501 PLEEE8 1063-651X Google Scholar
J. Dilleet al.,
“Size determination by use of two-dimensional Mueller matrices backscattered by optically thick random media,”
Appl. Opt., 45
(19), 4669
–4678
(2006). http://dx.doi.org/10.1364/AO.45.004669 APOPAI 0003-6935 Google Scholar
J. C. Ramella-RomanS. A. PrahlS. L. Jacques,
“Three Monte Carlo programs of polarized light transport into scattering media: part II,”
Opt. Express, 13
(25), 10392
–10405
(2005). http://dx.doi.org/10.1364/OPEX.13.010392 OPEXFF 1094-4087 Google Scholar
A. H. HielscherJ. R. MourantI. J. Bigio,
“Influence of particle size and concentration on the diffuse backscattering of polarized light from tissue phantoms and biological cell suspensions,”
Appl. Opt., 36
(1), 125
–135
(1997). http://dx.doi.org/10.1364/AO.36.000125 APOPAI 0003-6935 Google Scholar
N. Ghoshet al.,
“Mueller matrix decomposition for polarized light assessment of biological tissues,”
J. Biophotonics, 2
(3), 145
–156
(2009). http://dx.doi.org/10.1002/jbio.v2:3 JBOIBX 1864-063X Google Scholar
F. Boulvertet al.,
“Decomposition algorithm of an experimental Mueller matrix,”
Opt. Commun., 282
(5), 692
–704
(2009). http://dx.doi.org/10.1016/j.optcom.2008.10.076 OPCOB8 0030-4018 Google Scholar
K. DevA. Asundi,
“Mueller-Stokes polarimetric characterization of transmissive liquid crystal spatial light modulator,”
Opt. Laser. Eng., 50
(4), 599
–609
(2012). http://dx.doi.org/10.1016/j.optlaseng.2011.10.004 OLENDN 0143-8166 Google Scholar
N. GhoshI. A. Vitkin,
“Tissue polarimetry: concepts, challenges, applications, and outlook,”
J. Biomed. Opt., 16
(11), 110801
(2011). http://dx.doi.org/10.1117/1.3652896 JBOPFO 1083-3668 Google Scholar
J. M. Sanzet al.,
“Polar decomposition of the Mueller matrix: a polarimetric rule of thumb for square-profile surface structure recognition,”
Appl. Opt., 50
(21), 3781
–3788
(2011). http://dx.doi.org/10.1364/AO.50.003781 APOPAI 0003-6935 Google Scholar
X. LiG. Yao,
“Mueller matrix decomposition of diffuse reflectance imaging in skeletal muscle,”
Appl. Opt., 48
(14), 2625
–2631
(2009). http://dx.doi.org/10.1364/AO.48.002625 APOPAI 0003-6935 Google Scholar
N. GhoshM. F. WoodI. A. Vitkin,
“Mueller matrix decomposition for extraction of individual polarization parameters from complex turbid media exhibiting multiple scattering, optical activity, and linear birefringence,”
J. Biomed. Opt., 13
(4), 044036
(2008). http://dx.doi.org/10.1117/1.2960934 JBOPFO 1083-3668 Google Scholar
K. C. HadleyI. A. Vitkin,
“Optical rotation and linear and circular depolarization rates in diffusively scattered light from chiral, racemic, and achiral turbid media,”
J. Biomed. Opt., 7
(3), 291
–299
(2002). http://dx.doi.org/10.1117/1.1483880 JBOPFO 1083-3668 Google Scholar
T. T. H. PhamY. L. Lo,
“Extraction of effective parameters of turbid media utilizing the Mueller matrix approach: study of glucose sensing,”
J. Biomed. Opt., 17
(9), 097002
(2012). http://dx.doi.org/10.1117/1.JBO.17.9.097002 JBOPFO 1083-3668 Google Scholar
S. Manhaset al.,
“Mueller matrix approach for determination of optical rotation in chiral turbid media in backscattering geometry,”
Opt. Express, 14
(1), 190
–202
(2006). http://dx.doi.org/10.1364/OPEX.14.000190 OPEXFF 1094-4087 Google Scholar
S. FirdousM. Ikram,
“Polarized Mueller matrix analytical model for glucose measurement in vitro,”
Turk. J. Med. Sci., 35
(3), 149
–155
(2005). TJMEEA 1300-0144 Google Scholar
S. Y. LuR. A. Chipman,
“Interpretation of Mueller matrices based on polar decomposition,”
J. Opt. Soc. Am. A, 13
(5), 1106
–1113
(1996). http://dx.doi.org/10.1364/JOSAA.13.001106 JOAOD6 0740-3232 Google Scholar
I. A. VitkinR. D. LaszloC. L. Whyman,
“Effects of molecular asymmetry of optically active molecules on the polarization properties of multiply scattered light,”
Opt. Express, 10
(4), 222
–229
(2002). http://dx.doi.org/10.1364/OE.10.000222 OPEXFF 1094-4087 Google Scholar
D. CôtéI. A. Vitkin,
“Robust concentration determination of optically active molecules in turbid media with validated three-dimensional polarization sensitive Monte Carlo calculations,”
Opt. Express, 13
(1), 148
–163
(2005). http://dx.doi.org/10.1364/OPEX.13.000148 OPEXFF 1094-4087 Google Scholar
X. LiC. R. JanakaG. Yao,
“Polarization-sensitive reflectance imaging in skeletal muscle,”
Opt. Express, 16
(13), 9927
–9935
(2008). http://dx.doi.org/10.1364/OE.16.009927 OPEXFF 1094-4087 Google Scholar
P. Sunet al.,
“Experimentally determined characteristics of the degree of polarization of backscattered light from polystyrene sphere suspensions,”
J. Opt., 15
(5), 055708
(2013). http://dx.doi.org/10.1088/2040-8978/15/5/055708 JOOPDB 0150-536X Google Scholar
G. Mie,
“Beigrade zur optik truber medien, speziell kolloidaler metallosungen,”
Ann. Phys. (Leipz.), 330
(3), 377
–455
(1908). http://dx.doi.org/10.1002/(ISSN)1521-3889 APNYA 0003-4916 Google Scholar
M. F. G. WoodX. GuoI. A. Vitkin,
“Polarized light propagation in multiply scattering media exhibiting both linear birefringence and optical activity: Monte Carlo model and experimental methodology,”
J. Biomed. Opt., 12
(1), 014029
(2007). http://dx.doi.org/10.1117/1.2434980 JBOPFO 1083-3668 Google Scholar
B. Jirgensons, Optical Rotatory Dispersion of Proteins and Other Macromolecules, Springer-Verlag, New York
(1969). Google Scholar
M. F. WoodD. CôtéI. A. Vitkin,
“Combined optical intensity and polarization methodology for analyte concentration determination in simulated optically clear and turbid biological media,”
J. Biomed. Opt., 13
(4), 044037
(2008). http://dx.doi.org/10.1117/1.2968198 JBOPFO 1083-3668 Google Scholar
R. J. McNicholsG. L. Coté,
“Optical glucose monitoring in biological fluids: an overview,”
J. Biomed. Opt., 5
(1), 5
–16
(2000). http://dx.doi.org/10.1117/1.429962 JBOPFO 1083-3668 Google Scholar
X. Z. WangJ. C. LaiZ. H. Li,
“Polarization studies for backscattering of RBC suspensions based on Mueller matrix decomposition,”
Opt. Express, 20
(18), 20771
–20782
(2012). http://dx.doi.org/10.1364/OE.20.020771 OPEXFF 1094-4087 Google Scholar
M. K. Swamiet al.,
“Polar decomposition of Mueller matrix: a tool for quantitative tissue polarimetry,”
Opt. Express, 14
(20), 9324
–9337
(2006). http://dx.doi.org/10.1364/OE.14.009324 OPEXFF 1094-4087 Google Scholar
BiographyPing Sun received her master’s and PhD degrees in optical engineering from Beijing Institute of Technology, China, in 2000 and 2004, respectively. She is an associate professor of Beijing Normal University, China. Currently, her major research interests lie in interaction between light and complex turbid medium like biological tissue and biomedical imaging. She has published over 50 scientific papers in peer-reviewed journals. Wei Liu received her master’s degree from Beijing University of Technology, China, in 1998 and a PhD degree from Beijing Institute of Technology, China, in 2005. She is an associate professor of Capital Normal University, China. Currently, her major research interests focus on spectrographic analysis of tissues. |
||||||||||||||||||||||||||||||||||||||||||||||||||||||||||||||||


