|
|
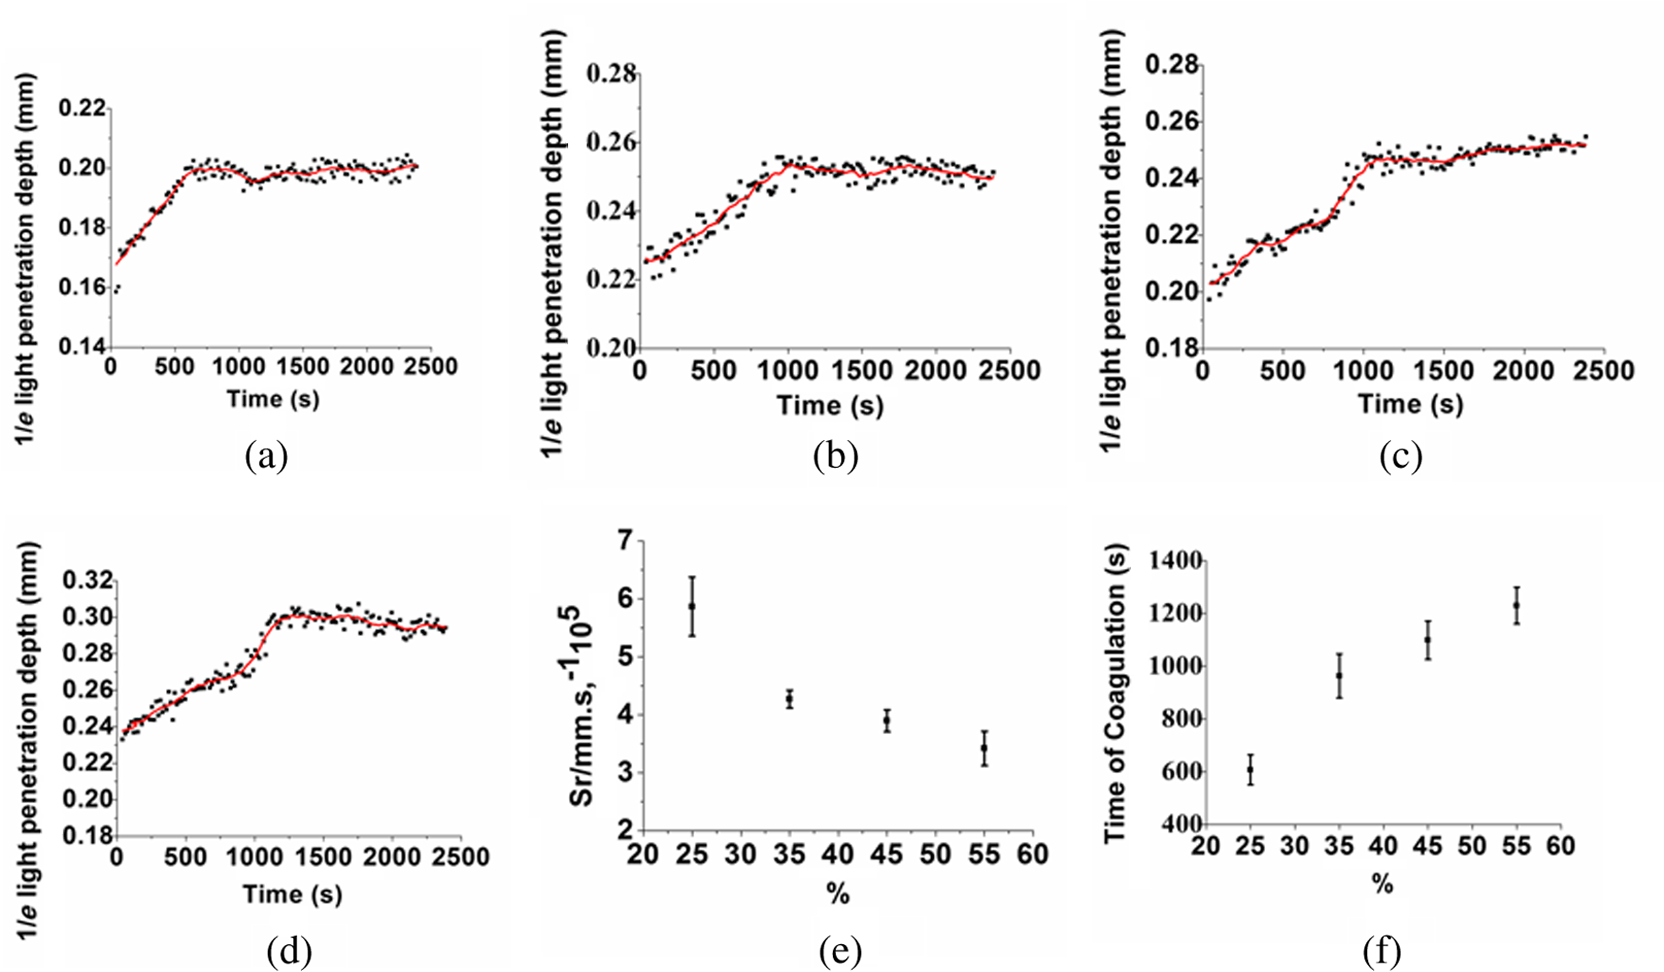
1.IntroductionBlood coagulation is a complex process including initiation, the formation of the fibrin clot and platelet plug, and localization of the clot to the area of vascular injury. It is a natural process that can be both beneficial and life-threatening for the human body. It allows the maintenance of hemostasis after vascular injury in the normal process of coagulation. But the disordered blood coagulation course may bring several pathological complications in increasing hemorrhage, thrombosis, and embolism in the vascular system. Many thromboses, including those found in coronary thrombosis, peripheral deep venous thrombosis, and pulmonary embolus, are life threatening.1 Therefore, it is crucial to develop techniques for assessing blood coagulation in vessels for clinical diagnoses. A lot of previous studies on the detection of blood coagulation have been performed, in which techniques have been developed or applied including the use of mechanical impedance, electromagnetism, photometry, and acoustics.2–5 Most of these available modalities are not appropriate for continuous and dynamic measurements and monitoring. In addition, the vast majority of existing methods for testing blood coagulation in vitro is performed under “no flow” conditions. For example, most measurements of ultrasound backscattering, ultrasound velocity, and attenuation have been used to detect the process of blood coagulation under static or stirred conditions.4,Blood coagulation is a dynamic process and generally is dependent on states of shear rate and shear stress of blood flow in vessels.6 Therefore, the tests in static state do not precisely reproduce the physiologic event. Thus, the coagulation processes in moving blood were studied with acoustic methods in the recent works by Uzlova et al.,7,8 who performed simultaneous optical and acoustic registration of the clotting processes. Taking advantage of parallel optical and acoustic methods in the experiments, the authors revealed a direct correlation between the changes in amplitude of acoustic backscattering and the formation of fibrin clots.8A water tank filled with degassed water must be used to allow propagation of ultrasound waves into the circulated blood. Optical coherence tomography (OCT) relies on short temporal coherence interferometry and measures the optical path and intensity of back-reflected, near-infrared light.9 The technique has the major advantage of providing a description of whole blood properties with high resolution, high sensitivity, and potential application in vivo, such as characterizing blood optical clearing, hematocrit (HCT), red blood cells (RBCs) aggregation, blood photocoagulation, blood oxygen saturation, thrombus volume, and blood fibrinogen level.10–18 Recently, we reported that OCT technique was able to characterize the whole blood coagulation process and the effects of anticoagulants on blood coagulation in the static state.19,20 The light penetration depth () [the point where the signal attenuated to 37% () of the point with the greatest reflectance] versus time of blood coagulation process was able to differentiate various stages of blood properties during coagulation in the static state. The study developed two parameters: (1) clotting time (), defined as the period of time where the light penetration depth curve started to be stabilized, and (2) rate of fibrin formation (), defined as the slope of within the period of time where increased dramatically following the induction of blood coagulation from the variations in versus time.19 The aim of this study was to evaluate whether the OCT technique and the parameters can characterize and monitor the flowing blood coagulation process that mimics physiological states. The versus time was measured, and and were obtained from the circulated porcine blood in a flow conduit throughout the entire process of blood clotting at flow rates of 5 to with tubing diameters of 0.9 to 2 mm. The fastest flow rates of 18 to are observed in the aorta and the slowest blood flow rates of 0.3 to are found in the capillaries in humans. The flow rates of 5 to in this study simulated the blood flow in small veins and arteries. Blood coagulation is initiated by -dependent binding of the coagulation Factor VIIa (FVIIa) to its cofactor, tissue factor. Therefore, calcium ions were selected to induce blood coagulation in this study. An initial set of measurements performed in the model consisting of various concentrations of calcium ions in the blood was used to determine the optional concentration of calcium for flowing blood coagulation. In the last set of measurements, the blood samples of HCT in the range of 25% to 55% were investigated, since blood coagulation is HCT dependent in which a higher HCT of the blood is more likely to be associated with increasing risk of the formation of thrombosis or embolism,21 and a lower HCT might interfere with the capability of blood coagulation for bleeding.22 2.Materials and Methods2.1.Sample Preparation and Sets of ExperimentsThe fresh porcine blood was taken from a local slaughterhouse and stabilized by 3.2% sodium citrate solution with the volume ratio of 9:1 for anti-coagulation purposes. The blood samples of various HCT levels were prepared by resuspending the concentrated RBCs into the native plasma separated from the whole blood.19 All measurements were performed within 12 h after the blood was collected to ensure the porcine blood was kept fresh. Experiment 1 was performed in the model with calcium chloride as a trigger factor. The influence of five calcium final concentrations (5, 15, 25, 40, and ) in the reconstituted blood of HCT 45% flowing through 0.9-mm glass tube at a flow rate of was investigated. Experiment 2 was performed in the model with various flow rates. The influence of four flow rates (5, 15, 20, and ) on the reaction process of the reconstituted blood samples of HCT 45% flowing through a glass tube with a diameter of 0.9 mm was investigated. The coagulation process was initiated by calcium chloride with final concentration of . Experiment 3 was performed in the model with various glass tube diameters. The effect of three tubes with diameters of 0.9, 1.1, and 2 mm on the reaction process of the reconstituted blood samples of HCT 45% flowing at 5 mm/s was investigated. The coagulation process was initiated by calcium chloride with final concentration of . Experiment 4 was performed in the model with various HCTs. The reconstituted blood samples of HCTs of 25%, 35%, 45%, and 55% flowing through a 0.9-mm glass tube at a flow rate of were studied. The coagulation process was initiated by calcium chloride with final concentration of . 2.2.OCT MeasurementsA spectral domain OCT system with a spectrum centered at 840 nm and a full-width at half-maximum bandwidth of 40 nm and a total delivered power of 2 mW was used. Back-reflected light from the reference and sample arms was guided into a spectrometer and dispersed over a indium gallium arsenide (InGaAs) detector array at 20 kHz. The resulting axial resolution of the system was about 8 μm in air. The lateral resolution was about 15 μm. The experimental setup for the registration of OCT signals during the clotting process under flow conditions is shown in Fig. 1. In our experiments, we used an open-circuit system of a round glass tube with its two ends connected to flexible silicone tubes. The glass tube was placed perpendicular to the probing beam and the sample arm of OCT system adjusted to ensure that only light scattered by blood constituents was detected and the specular reflection that occurs at the glass-fluid interface was eliminated from the detection. The flow model comprised a peristaltic pump to drive the blood circulating in a direction from a reservoir and to the same reservoir. The flow velocity was set by power regulation of the peristaltic pump and kept constant through the experiment. The OCT signals were acquired immediately when the blood sample was added with solution as a coagulation agent. A magnetic stirrer was used to mix well the solution with the blood. The OCT signals were taken every 15 s until 40 min. 2.3.Data ProcessingQuantitative data were obtained by averaging the signal intensity of 800-A scans in M-mode as a function of depth to one depth profile. A curve fit in depth was applied to the averaged and normalized signal from which the corresponding light penetration depth was derived as shown in Fig. 2.19,20 A time curve was set up by plotting the values obtained from the entire observation. From the versus time signals, the clotting time () and coagulation rate () were determined by averaging the results of triplicates for each sample.19 3.ResultsFigure 3 shows the variations in as a function of time acquired from the flowing blood samples with final concentrations of 5 [Fig. 3(a)], 15 [Fig. 3(b)], 25 [Fig. 3(c)], 40 [Fig. 3(d)], and [Fig. 3(e)] . Two distinct stages of all the five samples in the flow conditions could be identified during coagulation in accordance with the human and porcine blood coagulation induced by in the static state in our previous OCT measurements.19,20 The intersection of the two stages where the curve started to be stabilized was defined as the coagulation time (). Before solution was added to the blood sample, the medium was in a liquid state. During the first stage (0–), the medium turned into a gel state because of the transformation of fibrinogen into fibrin through a coagulation cascade reaction. In this stage, the increased markedly. In the second stage (), changed to a small extent with an approximate horizontal asymptote. The values of the five samples are illustrated in Fig. 3. Fig. 3as a function of time acquired from the flowing blood () with at (a) 5, (b) 15, (c) 25, (d) 40, and (e) . (f) The concentration-dependent coagulation time ().  The results demonstrated that calcium could cause clot formation of the flowing blood in the range of 5 to investigated in this study. When the concentration was 5 to , the clotting time was calcium concentration dependent and decreased with the increase of concentration, suggesting more calcium resulted in more effective blood coagulation in the flowing static as well as in the static state.20 However, when the concentration was 25 to , the clotting time increased with the increase of concentration [Fig. 3(f)]. The dual functions of calcium in blood coagulation have long ago been evidenced and explained, i.e., the overdose of calcium could play a role in anti-coagulation.23 At the same concentration () of , it took almost twice the time for the moving blood sample to coagulate than the stagnant blood, although there was sample variation.20 This difference is worthy of being noted for understanding the real physiologic coagulation, i.e., the effect of flow on the blood coagulation. The concentration was used for the following experiments. Figure 4 shows the effect of flow rates on the variation of as a function of time acquired from the blood of HCT 45% flowing through a 0.9-mm tube. At all the four flow rates of 5 [Fig. 4(a)], 15 [Fig. 4(b)], 20 [Fig. 4(c)], and [Fig. 4(d)], the blood coagulation process could be divided into two stages in agreement with the blood at static state.19 However, the slopes of the first stages in the four curves varied largely, i.e., the derived and were significantly different (Fig. 5). As expected, the mean () decreased from to as the flow rate increased [Fig. 4(e)] in the velocity from 5 to . Correspondingly, the increased with the blood flow [Fig. 4(f)]. The blood at all the four flow rates gave a much slower coagulation rate and longer clotting time than the blood in static state with () of and of .19 It was noted that the standard deviation of value increased along with the growing flow rate [Fig. 4(f)], which indicated that the coagulation time depending on each blood sample in the same flow rate became more scattering. Fig. 4as a function of time obtained from the flowing blood () during coagulation at the flow rates of (a) 5, (b) 15, (c) 20, and (d) . (e) The HCT concentration-dependent coagulation rate and (f) HCT concentration-dependent coagulation time (). 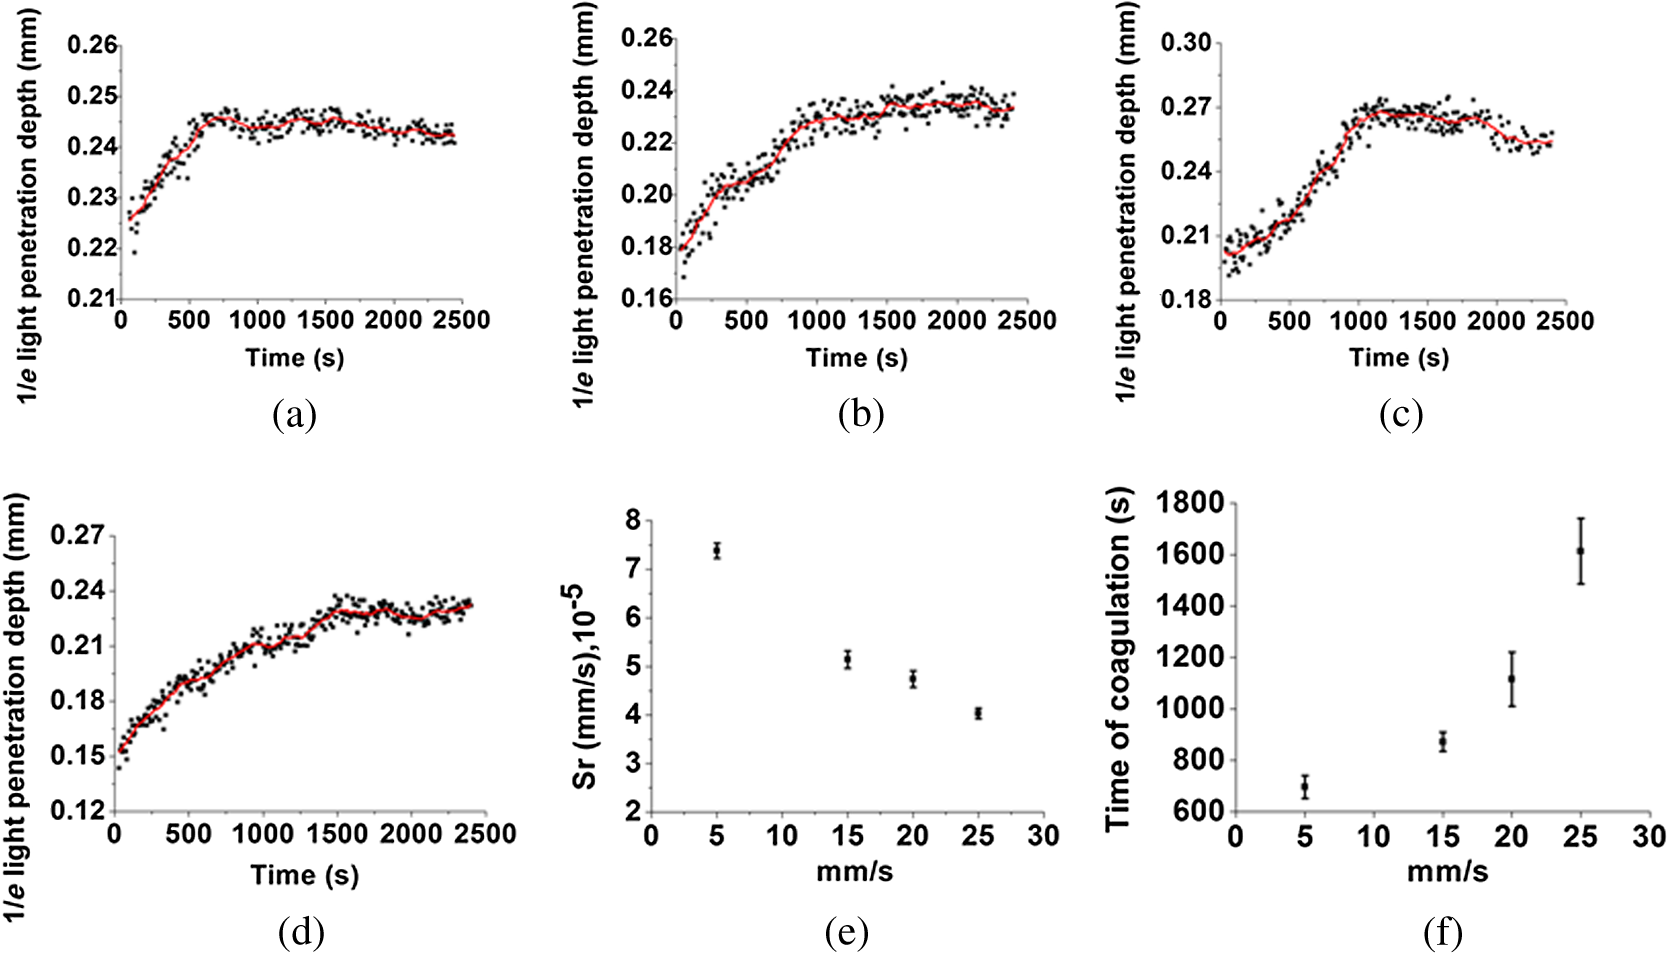 Fig. 5as a function of time obtained from the flowing blood () through the tubes with diameters of (a) 0.9, (b) 1.1, and (c) at flow rate of .  Figure 5 shows the variation of as a function of time acquired from the blood of HCT 45% flowing through the glass tubes with inner diameter of 0.9 [Fig. 5(a)], 1.1 [Fig. 5(b)], and 2.0 mm [Fig. 5(c)] at a flow rate of . The curves of versus time were also divided into two distinct stages. Following the development of blood coagulation, the corresponding parameter increased largely and then tended to a flat stage. The derived and could nicely characterize the difference of the coagulation course in diverse tubing size with the () decreased from , , to and the increased from , , to . The results demonstrated that the coagulation progress was enormously affected by tubing size, i.e., the blood samples in larger vessels needed longer time to clot than those in narrower vessels at the same flow rate. To investigate the effect of blood HCT on flowing blood coagulation, the blood samples of 25%, 35%, 45%, and 55% flowing through a 0.9-mm tube at a flow rate of were monitored. Figure 6 shows that the four curves of versus time were divided into two stages. The shapes of the curves of the blood samples of HCTs in 35% [Fig. 6(b)] and 45% [Fig. 6(c)] appeared similar to those in the static state.19 However, the curves of the flowing blood of 25% with the typical two stages [Fig. 6(a)] and 55% with an abnormal three stages [Fig. 6(d)] were different from those of the blood in the static state that had an abnormal curve with three stages and a much longer clotting time of 1969 s for the blood in HCT 25% and the normal two stages for the blood in HCT 55%,19 demonstrating again the effect of shear force on the blood coagulation process. The derived and were significantly different among the four HCTs [Figs. 6(a) and 6(b)]. With the increase of blood HCTs from 25% to 55%, the mean decreased and the increased, indicating that the blood samples of higher HCTs took longer to clot than those of lower HCTs. 4.DiscussionExisting standard optical tests in clinical practice involve mixing the plasma specimen and coagulation reagent, and then measuring changes in the transmitted light or the scattered light during the process of the plasma coagulating. However, the tests based on the temporal change in optical density are limited because of whole blood opacity. The increase in optical density of blood during coagulation is indisputable for plasma samples as reported in the literature but is a lot less detectable for whole blood samples.24,25 Because the plasma tests do not precisely reproduce the physiologic event, i.e., the effect of RBCs in whole blood as the main component of the blood clot is trapped RBCs by fibrin strands, to develop accurate and global standard in vitro coagulation tests using blood samples is an important need. We recently developed an OCT method to detect blood coagulation in static state on whole blood samples rather than plasma.19 OCT is able to quantify the attenuation coefficient (a result of scattering and absorption). The attenuation property obtained by OCT can be used for the characterization of several different kinds of tissues and these have been demonstrated by several groups.10–14 Because blood coagulation introduced local changes in their optical properties (scattering coefficient and local and mean refractive indices), thus, we first analyzed light penetration depth () versus time during blood coagulation under the static state.19 In our case, the blood sample was uniform and the parameter actually represented the attenuation property of the blood sample. In this region, the attenuated power signal within the sample mostly follows the first-order scattering approximation and can be modeled as an exponentially decaying function.26,27 The choosing of parameter ensures that the fitting is accurate. The present study extends the analysis of coagulation of flowing blood different from our previous studies which were performed from the static blood. The data presented in this work unambiguously pointed to the possibility of the OCT determination of the intravascular blood coagulation. A direct correlation between the changes in the and the moving blood coagulation process was revealed. In all our experiments, the beginning of clotting processes in the flow caused a marked increase in the corresponding to the transformation of the blood from liquid to gel state when fibrinogen turned into fibrin as in static state. The parameters could characterize and differentiate the coagulation process of flowing blood in diverse concentrations of calcium, vessel diameter, and HCTs. Various concentrations of calcium chloride, added as the inducer of coagulation, were investigated to reveal the influence of concentration on coagulation. The model suggests that ions play two distinct roles in the process: the ions are primarily responsible for optimal concentration of the experiments because of the shortest [showed in Fig. 3(f)] and the smaller standard deviation, whereas both increase and decrease the concentration of ions lead to prolong and enlarge the standard deviation. The presence of as a cofactor resulted in the Factor Xa formation and the rate of Factor Xa formation increases in proportion to the concentration when the concentration of is lower.28 Based on Fig. 3(f), the higher concentration of may inhibit the formation of Factor Xa or the reaction of transforming fibrinogen to fibrin. Appropriate concentration of is an essential factor for the experiment we conduct for this paper. The results demonstrated that the higher the mean flow rate applied to the flowing blood, the longer the time needed for the blood to be coagulated after the induction by a coagulant in the same inner diameter of 0.9 mm (Fig. 4). The formation of fibrin meshwork plays an important role in the process of blood coagulation. However, owing to the increasing shear stress, the higher shear rate has stronger capability of breaking the formation of fibrin meshwork.7 In addition, the elevated shear rates slow down the procedure of enmeshing the red cells and plasma, which also prolong the coagulation time; i.e., it will take longer to form adequate thrombus to block the tube at the increased shear rate. This is consistent with the effect of flow on clotting being inhibitory, as can be seen from both flow chamber perfusion experiments and in vivo studies.29–33 The blood samples flowing through the larger tubes need longer time to clot under the equal velocity of (Fig. 5). The results could be explained in that the formation of fibrin meshwork and the reaction of cells aggregate is easy to achieve in the smaller tubes.34 It will take more time to grow to quite large occlusive diameters, i.e., the greater tubes will call for more time to form a quite large thrombus. These evidences illustrate that the blood coagulation is partially dependent on the tubing size. The blood flow rate and vessel size are in a certain scope at normal circumstances. Our data demonstrated that the sample HCT was strongly correlated with the measured variables; low HCT was associated with relative hypercoagulability, and high HCT was associated with relative hypocoagulability (Fig. 6), which were consistent with the findings by thromboelastometry.35 A sample with a high HCT would contain less plasma (and consequently less plasma protein mass) than a sample with a lower HCT, i.e., RBCs act as a diluent for plasma coagulation factors and there could be less fibrinogen able to be converted into fibrin fibers in the blood in a higher HCT.35 Depending on the viscosity of blood samples and intensity of fibrin meshwork, a slightly high HCT of 55% blood led to an abnormality in optical properties [Fig. 6(d)] with the curve being divided into three distinct stages during coagulation. There may be a process of assembling more plasma protein to strengthen clotting viscosity and intensity to offset the lack of plasma coagulation factors in the second stage of Fig. 6(d). As stated before, due to most of the conventional methods being applied in plasma coagulation24,25 and whole blood coagulation of static condition,8,19,36,37 it is not feasible to compare the OCT results to the clotting times estimated with the traditional techniques, such as a conventional prothrombin time test. Compared to the traditional clotting time measurements, the OCT technology has the advantage of measuring flowing whole blood rather than plasma under static state and getting rid of the restriction of media (e.g., water). 5.ConclusionsThis study confirmed that OCT technique was a promising approach to monitor the flowing blood clotting process. In particular, the variations in versus time were associated with clotting rate and clotting time of moving blood in mimic vessels. The important effect of concentration, sample HCT, and flow rate on the flowing blood coagulation process was also emphasized by the and parameters. In comparison with other modalities, OCT allows direct monitoring of the coagulation properties of flowing blood. AcknowledgmentsThis work was supported by research grants from the National Natural Science Foundation of China (81171378). ReferencesD. Lillicrapet al., Practical Hemostasis and Thrombosis, Wiley-Blackwell, Hoboken, NJ
(2009). Google Scholar
B. Sqrensenet al.,
“Whole blood coagulation thrombelastographic profiles employing minimal tissue factor activation,”
J. Thromb. Haemostasis, 1
(3), 551
–558
(2003). http://dx.doi.org/10.1046/j.1538-7836.2003.00075.x JTHOA5 1538-7933 Google Scholar
J. GennissonS. LerougeG. Cloutier,
“Assessment by transient elastography of the viscoelastic properties of blood during clotting,”
Ultrasound Med. Biol., 32
(10), 1529
–1537
(2006). http://dx.doi.org/10.1016/j.ultrasmedbio.2006.06.008 USMBA3 0301-5629 Google Scholar
W. XuJ. AppelJ. Chae,
“Real-time monitoring of whole blood coagulation using a microfabricated contour-mode film bulk acoustic resonator,”
J. Microelectromech. Syst., 21
(2), 302
–307
(2012). http://dx.doi.org/10.1109/JMEMS.2011.2179011 JMIYET 1057-7157 Google Scholar
K. Leiderman,
“Grow with the flow: a spatial–temporal model of platelet deposition and blood coagulation under flow,”
Bur. Stand. J. Res., 28
(1), 47
–84
(2011). BSJRAV 0091-1801 Google Scholar
C. HuangS. Wang,
“Assessment of blood coagulation under various flow conditions with ultrasound backscattering,”
IEEE Trans. Biomed. Eng., 54
(12), 2223
–2230
(2007). http://dx.doi.org/10.1109/TBME.2007.908334 IEBEAX 0018-9294 Google Scholar
S. G. UzlovaK. G. GuriaG. T. Guria,
“Acoustic determination of early stages of intravascular blood coagulation,”
Philos. Trans. R. Soc. A, 366
(1880), 3649
–3661
(2008). http://dx.doi.org/10.1098/rsta.2008.0109 PTRMAD 1364-503X Google Scholar
D. Huanget al.,
“Optical coherence tomography,”
Science, 254
(5035), 1178
–1181
(1991). http://dx.doi.org/10.1126/science.1957169 SCIEAS 0036-8075 Google Scholar
M. Y. Kirillinet al.,
“Effect of red blood cell aggregation and sedimentation on optical coherence tomography signals from blood samples,”
J. Phys. D, 38
(15), 2582
–2589
(2005). http://dx.doi.org/10.1088/0022-3727/38/15/008 JPAPBE 0022-3727 Google Scholar
D. J. Faberet al.,
“Toward assessment of blood oxygen saturation by spectroscopic optical coherence tomography,”
Opt. Lett., 30
(9), 1015
–1017
(2005). http://dx.doi.org/10.1364/OL.30.001015 OPLEDP 0146-9592 Google Scholar
N. V. Iftimiaet al.,
“Toward noninvasive measurement of blood hematocrit using spectral domain low coherence interferometry and retinal tracking,”
Opt. Express, 14
(8), 3377
–3388
(2006). http://dx.doi.org/10.1364/OE.14.003377 OPEXFF 1094-4087 Google Scholar
X. XuL. YuZ. Chen,
“Optical clearing of flowing blood using dextrans with spectral domain optical coherence tomography,”
J. Biomed. Opt., 13
(2), 021107
(2008). http://dx.doi.org/10.1117/1.2909673 JBOPFO 1083-3668 Google Scholar
X. XuL. YuZ. Chen,
“Effect of erythrocyte aggregation on hematocrit measurement using spectral-domain optical coherence tomography,”
IEEE Trans. Biomed. Eng., 55
(12), 2753
–2758
(2008). http://dx.doi.org/10.1109/TBME.2008.2002134 IEBEAX 0018-9294 Google Scholar
X. XuL. YuZ. Chen,
“Velocity variation assessment of red blood cell aggregation with spectral domain Doppler optical coherence tomography,”
Ann. Biomed. Eng., 38
(10), 3210
–3217
(2010). http://dx.doi.org/10.1007/s10439-010-0066-7 ABMECF 0090-6964 Google Scholar
L. Coutureet al.,
“An optimized method to assess in vivo efficacy of antithrombotic drugs using optical coherence tomography and a modified Doppler flow system,”
J. Pharmacol. Toxicol. Methods, 64
(3), 264
–268
(2011). http://dx.doi.org/10.1016/j.vascn.2011.09.001 JPTMEZ 1056-8719 Google Scholar
R. V. Kuranovet al.,
“Depth-resolved blood oxygen saturation measurement by dual-wavelength photothermal (DWP) optical coherence tomography,”
Biomed. Opt. Express., 2
(3), 491
–504
(2011). http://dx.doi.org/10.1364/BOE.2.000491 BOEICL 2156-7085 Google Scholar
F. FuX. XuJ. Geng,
“Characterization of flowing blood optical property under various fibrinogen levels using optical coherence tomography,”
IEEE Trans. Biomed. Eng., 59
(9), 2613
–2618
(2012). http://dx.doi.org/10.1109/TBME.2012.2207899 IEBEAX 0018-9294 Google Scholar
X. XuJ. LinF. Fu,
“Optical coherence tomography to investigate optical properties of blood during coagulation,”
J. Biomed. Opt., 16
(9), 096002
(2011). http://dx.doi.org/10.1117/1.3615667 JBOPFO 1083-3668 Google Scholar
X. Xuet al.,
“Evaluation of optical coherence tomography for the measurement of the effects of activators and anticoagulants on the blood coagulation in vitro,”
IEEE Trans. Biomed. Eng., 60
(8), 2100
–2106
(2013). http://dx.doi.org/10.1109/TBME.2013.2245329 IEBEAX 0018-9294 Google Scholar
J. Shibataet al.,
“Hemostasis and coagulation at a hematocrit level of 0.85: functional consequences of erythrocytosis,”
Blood, 101
(11), 4416
–4422
(2003). http://dx.doi.org/10.1182/blood-2002-09-2814 BLOOAW 0006-4971 Google Scholar
B. M. Iselinet al.,
“Isolated reduction of haematocrit does not compromise in vitro blood coagulation,”
Br. J. Anaesth., 87
(2), 246
–249
(2001). http://dx.doi.org/10.1093/bja/87.2.246 BJANAD 0007-0912 Google Scholar
C. M. JacksonY. Nemerson,
“Blood coagulation,”
Annu. Rev. Biochem., 49
(1), 755
–811
(1980). http://dx.doi.org/10.1146/annurev.bi.49.070180.004001 ARBOAW 0066-4154 Google Scholar
W. D. BostickP. W. Car,
“Plasma and blood coagulation time detector based on the flow sensitivity of self-heated thermistors,”
Anal. Chem., 46
(5), 1095
–1102
(1974). http://dx.doi.org/10.1021/ac60344a042 ANCHAM 0003-2700 Google Scholar
D. LevitzL. ThraneM. Frosz,
“Determination of optical scattering properties of highly-scattering media in optical coherence tomography images,”
Opt. Express, 12
(2), 249
–259
(2004). http://dx.doi.org/10.1364/OPEX.12.000249 OPEXFF 1094-4087 Google Scholar
C. Xuet al.,
“Characterization of atherosclerosis plaques by measuring both backscattering and attenuation coefficients in optical coherence tomography,”
J. Biomed. Opt., 13
(3), 034003
(2008). http://dx.doi.org/10.1117/1.2927464 JBOPFO 1083-3668 Google Scholar
K. MertensR. M. Bertina,
“The contribution of Ca2+ and phospholipids to the activation of human blood coagulation Factor X by activated Factor IX,”
Biochem. J., 223
(3), 607
–622
(1984). BIJOAK 0264-6021 Google Scholar
F. Shenet al.,
“Threshold response of initiation of blood coagulation by tissue factor in patterned microfluidic capillaries is controlled by shear rate,”
Arterioscler. Thromb., Vasc., 28
(11), 2035
–2041
(2008). http://dx.doi.org/10.1161/ATVBAHA.108.173930 ATVBFA 1079-5642 Google Scholar
G. X. J. Brogan,
“Bench to bedside: pathophysiology of acute coronary syndromes and implications for therapy,”
Acad. Emerg. Med., 9
(10), 1029
–1044
(2002). http://dx.doi.org/10.1111/acem.2002.9.issue-10 1069-6563 Google Scholar
H. J. WeissV. T. TurittoH. R. Baumgartner,
“Role of shear rate and platelets in promoting fibrin formation on rabbit subendothelium. Studies utilizing patients with quantitative and qualitative platelet defects,”
J. Clin. Invest., 78
(4), 1072
–1082
(1986). http://dx.doi.org/10.1172/JCI112663 JCINAO 0021-9738 Google Scholar
H. R. Baumgartner,
“The role of blood flow in platelet adhesion, fibrin deposition, and formation of mural thrombi,”
Microvasc. Res., 5
(2), 167
–179
(1973). http://dx.doi.org/10.1016/0026-2862(73)90069-1 MIVRA6 0026-2862 Google Scholar
M. K. Runyonet al.,
“Propagation of blood clotting in the complex biochemical network of hemostasis is described by a simple mechanism,”
J. Am. Chem. Soc., 129
(5), 7014
–7015
(2007). http://dx.doi.org/10.1021/ja072602p JACSAT 0002-7863 Google Scholar
Z. Liuet al.,
“Influence on thrombosis of blood flow in curved Blood Vessel,”
Sci. Technol. Rev., 27
(3), 50
–55
(2009). Google Scholar
C. HuangS. Wang,
“Characterization of blood properties from coagulating blood of different hematocrits using ultrasonic backscatter and attenuation,”
Jpn. J. Appl. Phys., 45
(9), 7191
–7196
(2006). http://dx.doi.org/10.1143/JJAP.45.7191 JJAPA5 0021-4922 Google Scholar
K. P. ShungR. A. SigelmannG. Schmer,
“Ultrasonic measurement of blood coagulation time,”
IEEE Trans. Biomed. Eng., 22
(4), 334
–337
(1975). http://dx.doi.org/10.1109/TBME.1975.324454 IEBEAX 0018-9294 Google Scholar
BiographyXiangqun Xu received a BSc degree in biochemistry from Xiamen University, China, an MSc degree in biochemistry from Zhejiang Medical University, China, and the PhD degree in biomedical engineering from Keele University, UK, in 2003. She received postdoctoral training in biomedical optics at Cranfield University, UK. She is currently a professor of biomedical engineering at Zhejiang Sci-Tech University, China. Her research interests include medical imaging, diagnostic spectroscopy, and the application of optics in medicine. |