|
|
1.IntroductionDental implants, which retain prostheses by substituting the root of a lost tooth, have made a great contribution to prosthetic dentistry. In the mid-twentieth century, Brånemark discovered that titanium adhered firmly to the bone; since then, implants have undergone a major evolution, with a large number of implants being developed in different ways and based on different theories.1–3 Basically, an implant unit is composed of an implant fixture inserted into the prepared bone socket, an abutment screwed to the implant, and the prosthetics placed over the abutment. Now, there are a number of prosthetic implant–abutment choices, among which the dentist is supposed to choose the most predictable and reliable one. All prosthetic abutments in some way end up being screwed on implants, which generally provide two types of platforms, internal and external connections. Regardless of the type of platform, an interface is generated between the implant and abutment, which is located at the remaining bone beneath the gingival margin. Tight closure of the interface between the abutment and implant is critically important since an excessive level of gap could cause harm, such as plaque accumulation, difficulty to remove cement, and stress in the cervical area of the implant.4–6 Additionally, microleakage produced by a gap between the components of implant restorations allows the passage of acids, enzymes, bacteria, and/or their metabolic products.7 Several studies show that the bacteria are present on all surfaces; outside, between the implant components, and within them.5,8,9 These bacteria and metabolites directly affect the periodontal tissue, causing bleeding, swelling, and odor;10,11 the bacteria can trigger the development of inflammation (known as peri-implantitis) and subsequent bone and implant loss.12,13 Therefore, an absolute and passive fit of the abutment to the implant has been considered as prerequisite for long-term clinical success. The detection of marginal gaps at the implant–abutment interface is a common clinical task in prosthodontics treatment. Various methods have been suggested for the monitoring of the fit. These methods include probing with dental explorers, visual control, use of a periotest device, etc.14,15 Intraoral radiography has been shown to be the most popular method for the verification of the gap at the implant–abutment interface. Specific techniques, such as using a paralleling device, should be used to ensure proper angulation of the x-ray film and the radiographic tube, but their use in daily practice is often neglected. Intraoral radiography, however, shows certain limitations and false diagnosis of the x-ray may occur.16–18 Therefore, a new imaging/detection modality for this purpose is on demand and would be extremely helpful in implant dentistry. In the past two decades, optical coherence tomography (OCT) has been addressed as a noninvasive cross-sectional imaging of the internal biological system at the micrometer scale.19 It is a promising imaging modality, which does not require cutting and processing of the specimens and allows the visualization of microstructures of tissue and biomaterials in the real time.19,20 OCT was developed based on the concept of low-coherence interferometry. In simple words, a laser source is projected over a sample, and the backscattered signal intensity from within the scattering medium reveals depth-resolved information about scattering and reflection of the light in the sample. The signal from serial scans can be transformed into a two-dimensional (2-D) image by software.19 It has been reported in the literature that the first application of low-coherence interferometry in the biomedical optics field was for eye length measurement in late 1980s. Now, OCT is being used as a clinical diagnostic modality in various medical fields.21 In dentistry, the first series of reports about imaging of the dental hard and soft tissues appeared in the late 1990s.22–24 Afterward, several researchers used different types of OCT systems for research and diagnosis of dental diseases, including periodontal diseases and early caries lesions.25–29 The majority of earlier OCT imaging systems were based on the principles of time-domain low-coherence interferometry. The OCT technology has been greatly advanced by the introduction of spectral discrimination techniques, which provide a substantial increase in sensitivity over traditional time-domain OCT. Swept-source OCT (SS-OCT) is one of these recent developments; SS-OCT uses a wavelength-tuned laser source and provides improved imaging resolution and scanning speed.30 More recently, the SS-OCT systems with hand-held probes suitable for intraoral imaging have been introduced.31 The location of abutment–implant gingival interface is relatively accessible for imaging; however, limited imaging depth range of OCT and attenuation of the signal through the overlying GN tissue are concerns for obtaining suitable images of the implant surface (IS). To date, no studies have investigated the potential of OCT for detection of marginal gaps at the implant–abutment interface. Therefore, the purpose of this study was to evaluate the detective ability of SS-OCT in misfit of the abutment–implant interface at different imaging inclinations and overlying gingiva thicknesses. The null hypotheses in this study were that the implant gaps size measured by SS-OCT did not correspond to the actual gap size (GS) and that the measurement was not affected by the thickness of GN or imaging inclinations. 2.Materials and Methods2.1.Preparation of the SamplesThe implants used were threaded, titanium oxide-surface implants with a machined collar and external hexagonal connection (Brånemark System Mk III TiUnite RP 4 mm, Nobel Biocare, Göteborg, Sweden) and the abutments used were titanium abutments (Healing Abutment Brånemark System RP , Nobel Biocare, Göteborg, Sweden). Stainless steel plates of 50, 100, 150, and 200 μm in thickness were obtained and cut in sizes of (Oguchi Shearing, Nagano, Japan). In order to create gap spaces of known dimensions, two of the plates were placed in the opposite direction between an implant and an abutment, and the abutment was screwed on the implant using a wrench at 35 N-cm of torque, as recommended by the manufacturer [Fig. 1(a)]. After the specimens were stored in room temperature for 24 h to stabilize the dimensions of the stainless steel plates, direct observation and confirmation of the actual gaps of the implant–abutment interface were accomplished by confocal laser scanning microscope (1LM21H/W, Lasertec Co., Yokohama, Japan). The parameters used for this technique were as follow; numerical aperture: 0.30, magnification: , and nominal resolution . Fig. 1(a) Stainless steel plates (approximately 50, 100, 150, or 200 μm in thickness) were placed between an implant and an abutment, and the abutment was screwed on the implant at 35 N cm of torque. The gap size (GS) was confirmed by confocal laser scanning microscope. Then, the specimens with porcine gingival tissue were observed by optical coherence tomography (OCT) in different angles. (b) Collar diameter width was 4.1 mm and external hex width 2.7 mm. GS: gap size or the dimension of the space between an implant and an abutment; GT: gingival thickness; 0.5, 1.0, 1.5, or 2.0 mm; MD: misfit depth or the distance from implant–abutment surface to external hex which ranged 0.49 to 0.7 mm depending on the location of hex. (c) The real-time photographic image provided by a CMOS camera incorporated into the hand-held intraoral probe of the prototype dental OCT system. 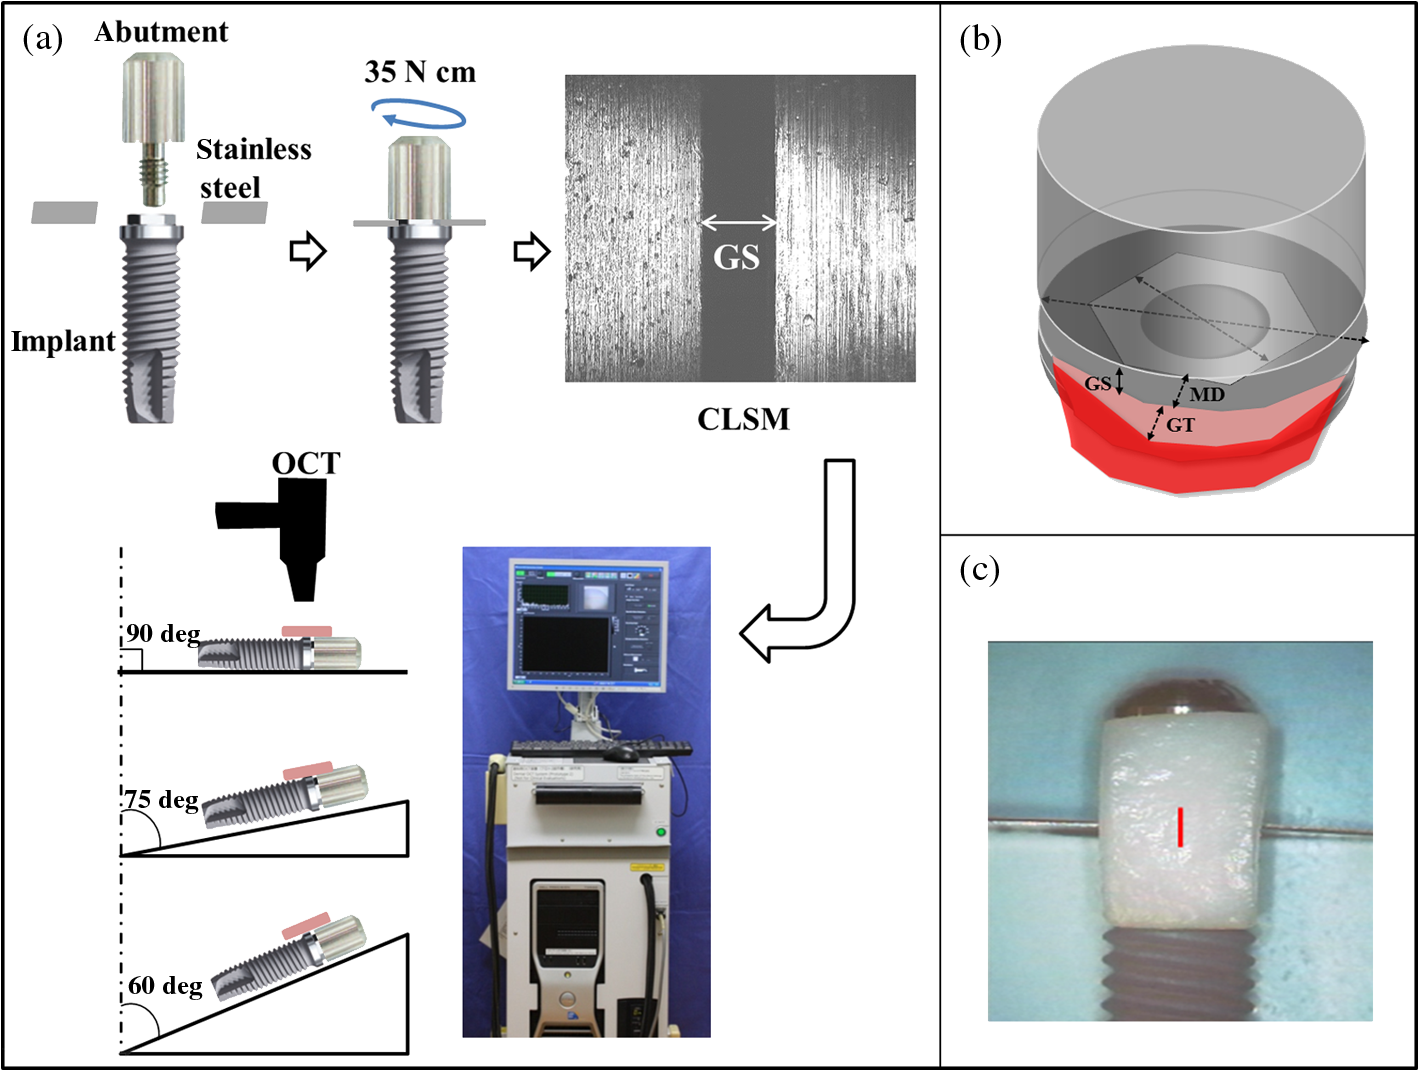 2.2.OCT ImagingFresh porcine periodontal tissues, obtained from a local slaughter house (Tokyo, Japan), were sliced in advance in thicknesses intended to be 0.5, 1.0, 1.5, and 2.0 mm. The thicknesses of the gingival slices at the time of experiment were measured by SS-OCT as described later. The sliced tissues were placed on the implant–abutment interface where the gaps were located. Each of the samples was placed on top of a silicone impression material in order to acquire B-scan images by SS-OCT. A schematic of the system (Dental SS-OCT, Prototype 2, Panasonic Healthcare, Co., Ltd., Ehime, Japan) used in this study was shown in Fig. 1(a). The light source is a commercially available scanning laser and sweeps in the near-IR wavelength at a rate of 30 kHz over a span of 100 nm centered at 1330 nm. Axial resolution of the system is 12 μm in air and the lateral resolution of 20 μm is determined by the objective lens at the hand-held probe designed for intraoral imaging. The acquired 2-D OCT image size was , with pixel dimensions of . This system employs a complementary metal oxide semiconductor (CMOS) camera for real-time photographic imaging of a surface area on the scanned sample and is capable of acquiring serial 2-D sections (B-scans) to construct three-dimensional scans. The hand-held scanning probe connected to the SS-OCT was set at a fixed distance over the sample’s surface, 20 images for each specimen were captured at 100-μm intervals with the scanning beam oriented approximately 90, 75, and 60 deg with respect to the IS with gap. Figure 1(c) is a photographic image obtained from CMOS camera attached to the scanning probe showing an in vitro sample subjected to OCT imaging. 2.3.OCT Image AnalysisSS-OCT raw B-scan data were imported to an image analysis software (ImageJ Ver. 1.48d) to detect significant increases in the signal intensity at the abutment–implant gap.32 The higher signal intensity appeared as bright clusters formed by bright pixels at the gap. In this study, to calculate the size of those bright clusters, an experimental threshold determination algorithm developed as a plugin for ImageJ under JAVA was used. The measurement of the length of target white pixels (gap) over the region of interest (ROI) length was automatically done by this plugin, according to an algorithm described previously.33 In short, after ranking all intensity values in the ROI, the threshold was determined so that the top 10% pixels were distinct from the background. This plugin can measure the X-component; in order to know the accurate length of 75 and 60 deg, the measurement should be divided by cos 15 deg and cos 30 deg, respectively. 2.4.Statistical AnalysisStatistical analysis of the results was performed using a statistical software package (SPSS Ver. 22.0 for Windows, SPSS, Chicago, Illinois). The bright cluster length (corresponding to increased OCT signal intensity) was compared among different groups according to the factors actual GS, OCT probe inclination, and gingival thickness (GT). The data was statistically analyzed with three-way analysis of variance (ANOVA) with the significance defined as . 3.ResultsFigure 2(a) shows the 2-D OCT image of the control which was tightened without a stainless steel plate, and Fig. 2(b) shows the image which was overlaid with a porcine tissue demonstrating a good tightened component with an implant and an abutment. However, increased signal intensities at the implant–abutment interfaces of 2-D OCT cross-sections in Figs. 2(c) and 2(d) correspond to gaps between an implant and an abutment. Fig. 2(a) OCT image of the control which was tightened without stainless steel plates with three-dimensional (3-D) OCT image. (b) The sample in (a) overlaid with porcine gingiva (GN). Implant surface is in a close proximity to the GN. (c) Increased signal intensity at the implant–abutment interface corresponds to gap between an implant and an abutment in OCT image (arrows). The length of this line indicates GS. The bottom image is a 3-D OCT scan. (d) Porcine tissue covering the implant–abutment interface. The gap (arrows) can be clearly observed in this sample. 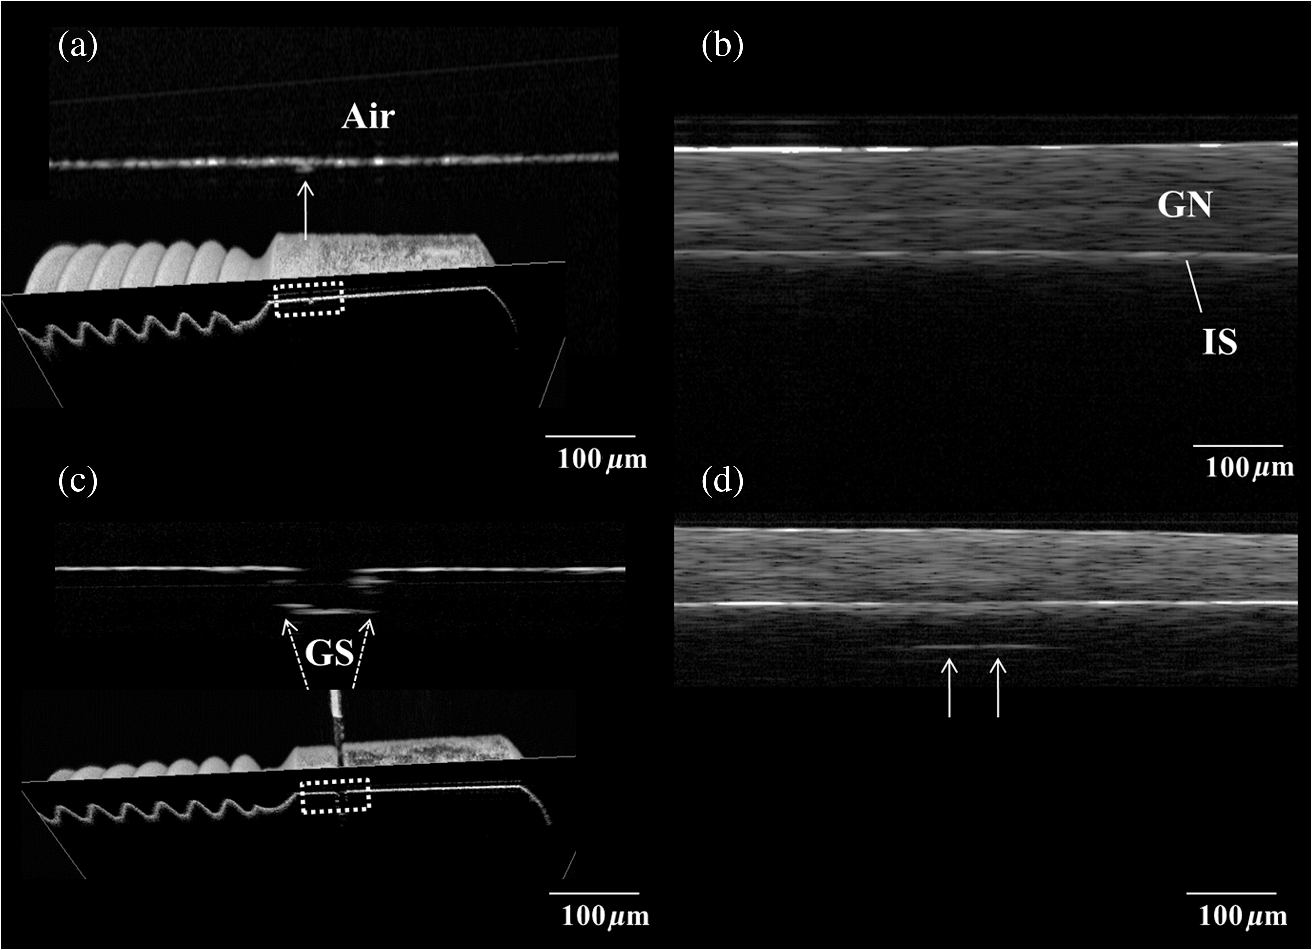 Figure 3 shows the OCT representative images; implant–abutment GS is 150 μm and OCT probe angle is 75 deg in this case, with various GTs. The white line, which indicated the gap of implant–abutment interface, was detected clearly under the gingival tissue of in thickness [Figs. 3(a) and 3(b)]. However, for the gingival tissue of 1.5 mm in thickness [Fig. 3(c)], the gap was detected only to some extent; and for the 2.0-mm-thick gingival tissue, it was challenging to detect the gap. A similar trend was observed in the cases of 90 and 60-deg probe angles. The white line was generally consistent with the actual GS in 0.5 and 1.0 mm of GT; on the other hand, these white clusters were found to be shorter than the actual GS under 1.5 and 2.0 mm of GT (Table 1). Fig. 3Representative OCT images with implant–abutment GS of 150 μm and probe angle of 75 deg. GT was (a) 0.5 mm, (b) 1.0 mm, (c) 1.5 mm, and (d) 2.0 mm, respectively. It was difficult to detection the gap in (d).  Table 1Three-way ANOVA with gingival thickness (GT), imaging probe angle, and actual gap size (GS).
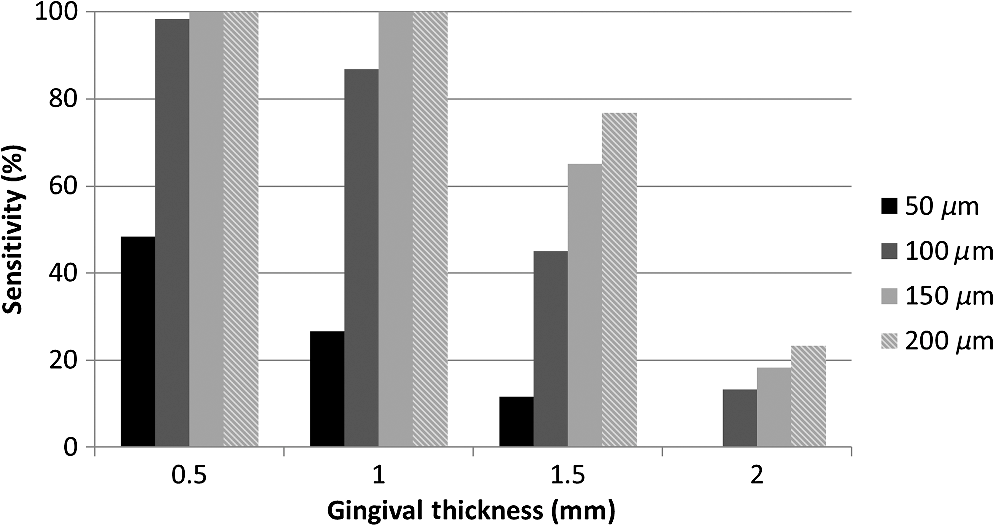
Note: Optical GT was based on 10 separate measurements (refractive index=1.396±0.051). The sensitivity data averaged among 90, 75, and 60 deg groups are plotted in Fig. 4. It suggests that the bigger the gaps are, the easier they can be detected. Additionally, gap detection gradually became less sensitive with thicker gingival tissues. The sensitivity reflects the ability of this method to determine cases with implant–abutment interface gap at various GTs, or in other words, the proportion of actual positive gap cases correctly identified as such regardless of the accuracy of length measurement. The null hypothesis of the present study was rejected since three-way ANOVA analysis of the OCT data revealed that all the factors of actual GS (), imaging probe angle (), and GT () were significant, while the three-factor interaction was not significant (). Pair-comparisons of estimated marginal means with Bonferroni correction indicated that there were significant differences among values measured for 50, 100, 150, and 200-μm actual GSs ( in all cases). On the other hand, there was no difference in measurements between 75 and 60 deg () while they were both different from 90 deg (). Finally, gap values measured under 0.5 and 1.0-mm GT were not statistically different (), while they were both significantly higher than those measured under 1.5-mm GN layer (). Table 1 shows the data of mean and standard deviation for each group. The 2.0-mm groups were excluded from statistical analysis due to an inadequate number of valid measurements. 4.DiscussionIn this study, SS-OCT appeared as a potential tool which can evaluate the gaps between an implant and an abutment nondestructively and without the need of radiation exposure. When light from OCT probe was directed onto the samples, there was increase in signal intensity of light at the surface of the porcine gingival tissue. This increase in signal intensity occurs due to scattering of light traversing through media of different refractive indices (i.e., air and gingival surface). The surface of implant/abutment immediately beneath the gingival also appears to be bright on OCT images. It is well known that the OCT light has little penetration into the metal, and most of the light projected over the metal surface is backscattered. The misfit of an implant and abutment appears as a depression with a depth of almost 0.7 mm as shown in Fig. 1(b). The reflection at the base of this pseudo-depression is a total reflection of the beam at the surface of the metallic body of the implant and served as an indication of GS in the current study. Images were obtained at different beam orientation angles (90, 75, and 60 deg) to simulate a clinically-relevant imaging setting, where the orientation of light beam cannot be perpendicular to IS due to anatomic position of the implant or probe position. Under the clinical situation, it is possible to determine such inclination and correct the length calculations on the OCT image by noting the orientation of the surface of implant and abutment. Although the imaging probe degree turned out to be a statistically significant factor, the length correction could help to improve the accuracy of GS prediction. Moreover, a perfectly perpendicular beam orientation to the sample surface is not desirable since it often results in artifacts due to peculiar mirror reflections from smooth surfaces. A function to correct measured length according to the beam orientation can be incorporated as a software feature for a clinical OCT system; otherwise, it is an extra step that should be taken into account to improve the accuracy of measurement, particularly if the inclination angle is large. It was reported that the microgap size of implant–abutment interface of some brands ranged from 2.3 to 5.6 μm even if tightened firmly.34 Many previous studies have discussed the harmful effect caused by marginal misfit of the implant–abutment interface; however, there is no evidence of the acceptable range of misfit. Most authors empirically accept 120 μm as the maximum tolerable misfit of dental restorations.35–38 In other words, clinically, gaps of this size or larger are not desirable and should be detected and corrected. It was suggested that the 200-μm gap was not detectable at angulations higher than 20 deg by the x-ray diagnosis;39 therefore, the evaluation of implant–abutment gaps by SS-OCT is considered to be an accurate and sensitive method when compared with x-ray. However, the current results suggest that when the gaps were in the range of 50 μm, the OCT results were not as sensitive as those of 100 μm and above. This limitation is thought to be related to the noise resulting from imaging of total reflective metal surface and the lateral resolution of the current system, which was 20 μm. Lateral resolution (determined by spot size at the objective lens) is in tradeoff with range of focus in the current OCT set ups.40 It appears that detection of an implant–abutment gap 2.5 times the nominal best resolution of 20 μm was challenging, particularly when the overlying gingival tissue was thicker. The OCT measurement depends on light intensity; the intensity of the light reaching a particular depth for any position across the sample is affected by how strongly features directly above that position reflect or randomly scatter the light. Nevertheless, it is noteworthy that in the cases where a distinct gap was detected over the background noise and measured, the measurement was quite accurate even for the smallest gaps (Table 1). The results of the study indicated that sensitivity and accuracy of determination of implant–abutment vertical misfit by OCT is greatly affected by both the thickness of gingival tissue overlying the structure and size of the gap. Considering that gingival tissue is a very thin and soft structure, it was difficult to obtain slices with exactly the same thicknesses in this study. Therefore, the optical thickness of the slice in each group at the time of imaging was measured and reported. Determination of actual gingival tissue thickness by OCT requires knowledge of the bulk refractive index () of the tissue. The is an important parameter of light propagation in biological tissues; indeed, scattering is the end result of local variation.41 Since there were no previous reports on the value of gingival tissue , an additional experiment was carried out to determine the value. In the case of porcine gingival tissue, value was calculated from five samples as by OCT using the optical path-length-matching method as previously described.42 This value is in the range of 1.38 to 1.41 previously reported in the visible wavelength for various soft tissues such as kidney, liver, and blood in human and other mammals,43 and close to of dermis and muscle tissue evaluated by OCT in 1300-nm wavelength.44 It has been shown that the OCT imaging depth is limited due to the attenuation of light (loss of signal) through the tissue. Light scattering and absorption are known to be dependent on variations caused by microscopic tissue elements that eventually lead to attenuation. Attenuation through soft tissue would depend on compositional factors. Pathological changes can affect the optical properties of periodontal tissue; it has been suggested that multiple inflammatory indices can be monitored in periodontal tissues by infrared spectroscopy.45 Likewise, the attenuation coefficient of GN is expected to depend on such factors as blood flow, oxygen levels, health state, etc. Further investigation is necessary to determine how these factors affect OCT imaging through the oral mucosal tissue. Colston et al.23 demonstrated the potential of OCT to obtain images of dental structures through the oral mucosa. The current results suggest that 1-mm thickness of healthy gingival tissue did not significantly affect the OCT measurements, whereas 2 mm or thicker of the tissue would remarkably decrease the sensitivity of the current OCT system. Clinically, Cardaropoli et al.46 reported that the thickness of gingival covering the implant above bone is at the time of implant placement and at the time of abutment connection. On the other hand, in the anterior region of the mouth, gingival tissue is relatively thin and the implants are required to be placed as deep as possible into the bone because of aesthetic reasons. Therefore, direct observation of the implant–abutment surface is more difficult. In this regard, OCT is expected to be an effective tool for detecting implant–abutment gaps, particularly in the anterior region. Regardless of the accuracy of GS measurements and image analysis approach, the fact that OCT imaging can help in finding these gaps with good sensitivity is very promising. Even in the case where the metal reflection from the bottom of the gap is not detected, OCT could be used to evaluate the space left open between the outer surface of the abutment and implant. Nevertheless, only clinical imaging can confirm that the proposed application for OCT is feasible. 5.ConclusionDetection of the marginal misfit of implants by conventional x-ray is very difficult; according to the results presented on this in vitro study, OCT can detect smaller gaps and obtain images in larger angulations than x-ray. The sensitivity of gap detection by OCT was affected by a thick () layer of soft tissue. Nevertheless, OCT is considered to be a new useful tool to evaluate the implant–abutment interface nondestructively without the use of x-ray exposure. AcknowledgmentsThis work was supported by the Research Funding for Longevity Sciences (23-20) from National Center for Geriatrics and Gerontology (NCGG), Japan. ReferencesP. I. Brånemarket al.,
“Osseointegrated implants in the treatment of the edentulous jaw. Experience from a 10-year period,”
Scand. J. Plast. Reconstr. Surg. Suppl., 16 1
–132
(1977). Google Scholar
R. Adellet al.,
“A 15-year study of osseointegrated implants in the treatment of the edentulous jaw,”
Int. J. Oral Surg., 10
(6), 387
–416
(1981). http://dx.doi.org/10.1016/S0300-9785(81)80077-4 IJOSB6 0300-9785 Google Scholar
I. M. Fingeret al.,
“The evolution of external and internal implant/abutment connections,”
Pract. Proced. Aesthet. Dent., 15
(8), 625
–632
(2003). Google Scholar
P. G. Coelhoet al.,
“In vitro evaluation of the implant abutment connection sealing capability of different implant systems,”
J. Oral Rehabil., 35
(12), 917
–924
(2008). http://dx.doi.org/10.1111/jor.2008.35.issue-12 JORHBY 0305-182X Google Scholar
S. Harderet al.,
“Molecular leakage at implant-abutment connection—in vitro investigation of tightness of internal conical implant-abutment connections against endotoxin penetration,”
Clin. Oral Investig., 14
(4), 427
–432
(2010). http://dx.doi.org/10.1007/s00784-009-0317-x 1432-6981 Google Scholar
T. Jemt,
“Failures and complications in 391 consecutively inserted fixed prostheses supported by Brånemark implants in edentulous jaws: a study of treatment from the time of prosthesis placement to the first annual checkup,”
Int. J. Oral Maxillofac. Implants, 6
(3), 270
–276
(1991). IJOIED 0882-2786 Google Scholar
F. H. Aguiaret al.,
“Quantitative evaluation of marginal leakage of two resin composite restorations using two filling techniques,”
Oper. Dent., 27
(5), 475
–479
(2002). Google Scholar
P. R. HuntJ. L. GartnerF. J. Norkin,
“Choice of a dental implant system,”
Compend. Contin. Educ. Dent., 26
(4), 239
–240
(2005). Google Scholar
J. P. Aloiseet al.,
“Microbial leakage through the implant-abutment interface of Morse taper implants in vitro,”
Clin. Oral Implants Res., 21
(3), 328
–335
(2010). http://dx.doi.org/10.1111/clr.2010.21.issue-3 0905-7161 Google Scholar
M. QuirynenD. van Steenberghe,
“Bacterial colonization of the internal part of two-stage implants. An in vivo study,”
Clin. Oral Implants Res., 4
(3), 158
–161
(1993). http://dx.doi.org/10.1034/j.1600-0501.1993.040307.x 0905-7161 Google Scholar
M. Quirynenet al.,
“Microbial penetration along the implant components of the Brånemark system. An in vitro study,”
Clin. Oral Implants Res., 5
(4), 239
–244
(1994). http://dx.doi.org/10.1034/j.1600-0501.1994.050407.x 0905-7161 Google Scholar
A. Piattelliet al.,
“Fluids and microbial penetration in the internal part of cement-retained versus screw-retained implant-abutment connections,”
J. Periodontol., 72
(9), 1146
–1150
(2001). http://dx.doi.org/10.1902/jop.2000.72.9.1146 JOPRAJ 0022-3492 Google Scholar
N. Brogginiet al.,
“Persistent acute inflammation at the implant-abutment interface,”
J. Dent. Res., 82
(3), 232
–237
(2003). http://dx.doi.org/10.1177/154405910308200316 JDREAF 0022-0345 Google Scholar
R. T. Yanaseet al.,
“Current issue forum. How do you test a cast framework for a full arch fixed implant supported prosthesis?,”
Int. J. Oral. Maxillofac. Implants, 9 471
–474
(1994). IJOIED 0882-2786 Google Scholar
K. B. Mayet al.,
“The Periotest method: implant-supported framework precision of fit evaluation,”
J. Prosthodont., 5
(3), 206
–213
(1996). http://dx.doi.org/10.1111/jopr.1996.5.issue-3 JPORCN 1059-941X Google Scholar
J. F. CoxM. Pharoah,
“An alternative holder for radiographic evaluation of tissue-integrated prostheses,”
J. Prosthet. Dent., 56
(3), 338
–341
(1986). http://dx.doi.org/10.1016/0022-3913(86)90016-8 JPDEAT 0022-3913 Google Scholar
H. J. MeijerW. H. SteenF. Bosman,
“Standardized radiographs of the alveolar crest around implants in the mandible,”
J. Prosthet. Dent., 68
(2), 318
–321
(1992). http://dx.doi.org/10.1016/0022-3913(92)90337-A JPDEAT 0022-3913 Google Scholar
N. NaffahJ. J. Chidiac,
“A modified periapical radiographic holder used for standardized implant assessment,”
J. Prosthet. Dent., 91
(4), 398
(2004). http://dx.doi.org/10.1016/j.prosdent.2003.12.020 JPDEAT 0022-3913 Google Scholar
D. Huanget al.,
“Optical coherence tomography,”
Science, 254
(5035), 1178
–1181
(1991). http://dx.doi.org/10.1126/science.1957169 SCIEAS 0036-8075 Google Scholar
D. Levitzet al.,
“Non-destructive label-free monitoring of collagen gel remodeling using optical coherence tomography,”
Biomaterials, 31
(32), 8210
–8217
(2010). http://dx.doi.org/10.1016/j.biomaterials.2010.06.042 BIMADU 0142-9612 Google Scholar
A. F. FercherK. MengedohtW. Werner,
“Eye-length measurement by interferometry with partially coherent light,”
Opt. Lett., 13
(3), 186
–188
(1988). http://dx.doi.org/10.1364/OL.13.000186 OPLEDP 0146-9592 Google Scholar
B. Colstonet al.,
“Dental OCT,”
Opt. Express, 3
(6), 230
–238
(1998). http://dx.doi.org/10.1364/OE.3.000230 OPEXFF 1094-4087 Google Scholar
B. W. Colstonet al.,
“Imaging of hard- and soft-tissue structure in the oral cavity by optical coherence tomography,”
Appl. Opt., 37
(16), 3582
–3585
(1998). http://dx.doi.org/10.1364/AO.37.003582 APOPAI 0003-6935 Google Scholar
F. Feldchteinet al.,
“In vivo OCT imaging of hard and soft tissue of the oral cavity,”
Opt. Express, 3
(6), 239
–250
(1998). http://dx.doi.org/10.1364/OE.3.000239 OPEXFF 1094-4087 Google Scholar
Y. Shimadaet al.,
“Validation of swept-source optical coherence tomography (SS-OCT) for the diagnosis of occlusal caries,”
J. Dent., 38
(8), 655
–665
(2010). http://dx.doi.org/10.1016/j.jdent.2010.05.004 JDENAB 0300-5712 Google Scholar
D. Friedet al.,
“Imaging caries lesions and lesion progression with polarization sensitive optical coherence tomography,”
J. Biomed. Opt., 7
(4), 618
–627
(2002). http://dx.doi.org/10.1117/1.1509752 JBOPFO 1083-3668 Google Scholar
M. M. Mandurahet al.,
“Monitoring remineralization of enamel subsurface lesions by optical coherence tomography,”
J. Biomed. Opt., 18
(4), 046006
(2013). http://dx.doi.org/10.1117/1.JBO.18.4.046006 JBOPFO 1083-3668 Google Scholar
T. A. Bakhshet al.,
“Concurrent evaluation of composite internal adaptation and bond strength in a class-I cavity,”
J. Dent., 41
(1), 60
–70
(2013). http://dx.doi.org/10.1016/j.jdent.2012.10.003 JDENAB 0300-5712 Google Scholar
T. A. Bakhshet al.,
“Non-invasive quantification of resin-dentin interfacial gaps using optical coherence tomography: validation against confocal microscopy,”
Dent. Mater., 27
(9), 915
–925
(2011). http://dx.doi.org/10.1016/j.dental.2011.05.003 DEMAEP 0109-5641 Google Scholar
M. Chomaet al.,
“Sensitivity advantage of swept source and Fourier domain optical coherence tomography,”
Opt. Express, 11
(18), 2183
–2189
(2003). http://dx.doi.org/10.1364/OE.11.002183 OPEXFF 1094-4087 Google Scholar
Y. Shimadaet al.,
“Noninvasive cross-sectional imaging of proximal caries using swept-source optical coherence tomography (SS-OCT) in vivo,”
J. Biophotonics,
(2013). JBOIBX 1864-063X Google Scholar
V. GirishA. Vijayalakshmi,
“Affordable image analysis using NIH Image/ImageJ,”
Indian J. Cancer, 41
(1), 47
(2004). IJCAAR 0019-509X Google Scholar
B. Bistaet al.,
“Nondestructive assessment of current one-step self-etch dental adhesives using optical coherence tomography,”
J. Biomed. Opt., 18
(7), 076020
(2013). http://dx.doi.org/10.1117/1.JBO.18.7.076020 JBOPFO 1083-3668 Google Scholar
T. TsugeY. HagiwaraH. Matsumura,
“Marginal fit and microgaps of implant-abutment interface with internal anti-rotation configuration,”
Dent. Mater. J., 27
(1), 29
–34
(2008). http://dx.doi.org/10.4012/dmj.27.29 DMJOD5 0287-4547 Google Scholar
M. Jesús Suárezet al.,
“Marginal fit of titanium metal-ceramic crowns,”
Int. J. Prosthodont., 18
(5), 390
–391
(2005). Google Scholar
E. Gonzaloet al.,
“A comparison of the marginal vertical discrepancies of zirconium and metal ceramic posterior fixed dental prostheses before and after cementation,”
J. Prosthet. Dent., 102
(6), 378
–384
(2009). http://dx.doi.org/10.1016/S0022-3913(09)60198-0 JPDEAT 0022-3913 Google Scholar
R. Castillo de Oyagüeet al.,
“Influence of CAM vs. CAD/CAM scanning methods and finish line of tooth preparation in the vertical misfit of zirconia bridge structures,”
Am. J. Dent., 22
(2), 79
–83
(2009). Google Scholar
R. Castillo OyagüeM. I. Sánchez-JorgeA. Sánchez Turrión,
“Influence of CAD/CAM scanning method and tooth-preparation design on the vertical misfit of zirconia crown copings,”
Am. J. Dent., 23
(6), 341
–346
(2010). 0894-8275 Google Scholar
H. Papavassiliouet al.,
“Radiographical evaluation of the gap at the implant-abutment interface,”
J. Esthet. Restor. Dent., 22
(4), 235
–250
(2010). http://dx.doi.org/10.1111/(ISSN)1708-8240 1496-4155 Google Scholar
W. DrexlerJ. G. Fujimoto, Optical Coherence Tomography: Technology and Applications, 49
–51 Springer Berlin Heidelberg, Berlin
(2008). Google Scholar
A. KnüttelS. BonevW. Knaak,
“New method for evaluation of in vivo scattering and refractive index properties obtained with optical coherence tomography,”
J. Biomed. Opt., 9
(2), 265
–273
(2004). http://dx.doi.org/10.1117/1.1647544 JBOPFO 1083-3668 Google Scholar
I. Haririet al.,
“Effects of structural orientation of enamel and dentine on light attenuation and local refractive index: an optical coherence tomography study,”
J. Dent., 40
(5), 387
–396
(2012). http://dx.doi.org/10.1016/j.jdent.2012.01.017 JDENAB 0300-5712 Google Scholar
F. P. Bolinet al.,
“Refractive index of some mammalian tissues using a fiber optic cladding method,”
Appl. Opt., 28
(12), 2297
–2303
(1989). http://dx.doi.org/10.1364/AO.28.002297 APOPAI 0003-6935 Google Scholar
G. J. Tearneyet al.,
“Determination of the refractive index of highly scattering human tissue by optical coherence tomography,”
Opt. Lett., 20
(21), 2258
–2260
(1995). http://dx.doi.org/10.1364/OL.20.002258 OPLEDP 0146-9592 Google Scholar
K. Z. Liuet al.,
“In vivo determination of multiple indices of periodontal inflammation by optical spectroscopy,”
J. Periodontal Res., 44
(1), 117
–124
(2009). http://dx.doi.org/10.1111/jre.2009.44.issue-1 JPDRAY 0022-3484 Google Scholar
G. CardaropoliU. LekholmJ. L. Wennström,
“Tissue alterations at implant-supported single-tooth replacements: a 1-year prospective clinical study,”
Clin. Oral Implants Res., 17
(2), 165
–171
(2006). http://dx.doi.org/10.1111/clr.2006.17.issue-2 0905-7161 Google Scholar
|
|||||||||||||||||||||||||||||||||||||||||||||||||||||||||||||||||||||||||||||||