
|
|
1.IntroductionThe preclinical models of the action of drugs in medicine is a key point to evaluate the effectiveness of those drugs over tissues or cells, such as tumors, before their adoption in serial treatments. The advanced evaluation allows a thorough knowledge of the cells’ response and in addition allows the adjustment of the optimum concentration of the chemicals. In order to achieve the models, tests can be carried out in cells in vivo merged in a nutritive medium, which creates an adequate condition for the cells to survive and to introduce different drugs. The monitoring of the drugs and of the cell interactions can be done by means of some routine techniques, such as chemotaxis,1 DNA synthesis speed,2 investigation of existing inactive zymogens in living cells, apoptotic caspase becoming activated during apoptosis,3 and apoptotic DNA fragmentation.4 The measure of the activity of the interactions between cells and drugs can also be provided by optical techniques, and dynamic laser speckle would be elected as a potential alternative.5 Dynamic laser speckle is based on the monitoring of the Doppler beating phenomenon caused by the multiple scattering of the coherent light of a laser returning from or passing by the illuminated sample. The noisy signal observed is, thus, analyzed by means of many techniques, such as those associated with statistical analysis. Therefore, the ability to monitor the activity of the illuminated sample without any contact and the use of a low-power light set the dynamic laser speckle as a potential tool in a broad range of applications in biological material. Moreover, the ability of that technique to offer objective outputs and at real time makes it an outstanding tool when compared to the traditional methods to test biological features, which are time consuming and demand the subjectivity of human judgment. Applications of dynamic laser speckle in biological samples have been recounted, for example, in fruits,6 in seeds analysis,7 in motility of bovine frozen semen,8 as well as in blood flow9,10 and in bacterial chemotaxis.11 In addition, dynamic laser speckle presents itself as a reliable tool to monitor nonbiological samples, such as in paint drying12 and in zeta potential in colloids.13 Particularly related to the analysis of cancer tissues, one can see some reports of the adoption of dynamic laser speckle in the identification of melanoma in live human beings,14 or even the signature in frequency of different types of cancer in animal tissues.15 Despite the great application of dynamic laser speckle, and despite the reports of many methods to monitor the response of cancer cells,16 there is no account in the literature about the adoption of dynamic laser speckle associated with preclinical models to monitor the action of drugs in cancer cells. Therefore, this work evaluated the feasibility of providing reliable outputs of dynamic laser speckle related to the reaction of cancer cells of line MEL-RC0817 to the introduction of Colcemid (Gibco, Invitrogen, Life Technologies LTD, Paisley, United Kingdom) in different concentrations with time. 2.Materials and Methods2.1.SpecimenIn this study, the cell line MEL-RC08 was used. This cell line was derived from a pericraneal metastasis of a cutaneous melanoma; it is well characterized and has been cultured for passages.17 Culture medium used was sterile RPMI-1640 (Gibco BRL, Grand Island, New York) with a defined standard composition and a good stability at a pH of 7 to 7.2. The medium was supplemented with 10% bovine fetal serum (Gibco), 1% l-glutamine (Gibco), and an antibiotic mix with penicillin (), and streptomycin sulfate () (Gibco). The cells grew into tissue culture flasks (Nunc, Roskilde, Denmark) in controlled conditions, maintained in a humidified atmosphere at 5% and air at 37°C, until use. The bioactive substance assayed in this work was Colcemid. Colcemid is a microtubule-depolymerizing drug. It has different functions: suppression of both dynamic instability and cell migration, and inhibition of microtubule assembly during cell division.18 Colcemid inhibits mitosis by suppressing microtubule plus-end dynamics; it leads to cell-cycle arrest in metaphase of cell division, and therefore, it allows to obtain metaphase chromosomes to make cytogenetic studies.19 The mechanism of action of this drug is similar to that of Colchicine, but toxicity of Colcemid is lower in mammals. In this experiment, MEL-RC08 cells were seeded in multiwell cell culture plates with clear-bottom polystyrene treated with CellBIND® (Corning Life Sciences, Hazebrouck, France), which enhances the attachment, thus making it easier to grow cells under difficult conditions. Four wells were used: well number 1 had only 1.5 mL of complete medium. In the other wells, 100,000 cells per well were seeded upon 1.5 mL of complete culture medium (wells 2, 3, 4) and were grown for 48 h, until they were semiconfluent (Fig. 1). After this time, in well numbers 3 and 4, Colcemid was added at 0.2 and , respectively. Well number 2, with cells and without drug, was used as a control. We checked the standard concentration of Colcemid for metaphase-arresting in human lymphocyte cultures, which is ,19 because this concentration induces cell cycle arrest without being toxic to cells. A twofold concentration, , was selected since it shows sufficient differences to assess the effect of the drug in a short-term study, near to a toxic concentration. 2.2.Experimental SetupFigure 2 presents the experimental setup to acquire the speckle patterns generated in time by the illumination of the samples using a linear polarized He-Ne laser beam (632.8 nm, 30 mW). The beam size of the expanded laser light was 110 mm in diameter, presenting a monitored area of a square edge with 38 mm. The well with a diameter of 16 mm was situated in the center of the illuminated area, which presented a uniform illumination provided by a diffuser.11,20 In addition, a high contrast of the speckle grains was adjusted, in order to have grains with high definition of their shapes. The distance between the diffuser and the well was 7 mm. The well contained a sample with a thickness of 7.5 mm related to a volume of 1.5 mL. Fig. 2Scheme of experimental setup used to record the dynamic speckle patterns produced by human cell line activity.  The images were acquired by a macro (SIGMA) with a focal length of 50 mm, numerical aperture of f/16, connected to an Allied Vision Technologies CCD Camera (AVTMarlin F-145B, pixel size of 4.65 μm). Image quality was tested in order to avoid speckle grains with unworthy information about the phenomena. Therefore, the setup was biased in order to avoid speckle grains smaller than the pixel size and to avoid large speckle grains with blurred appearance. Blurring was avoided using the contrast test.21 The setup was maintained during all the analysis; thus, the speckle grain sizes remained in the same range. The speckle size in the image plane was 12.35 μm. At the beginning of each hour, along 8 h, a collection of 128 images (8 bits, and shutter speed ) was acquired during 8.53 s at a time rate of 15 frames per second. 2.3.Biospeckle Image ProcessingThe setup was evaluated using the homogeneity test,22 and the images of each well were cropped in four regions of interest (ROIs) in the homogeneous areas. Each ROI was analyzed with respect to its behavior in time by means of the absolute values of the differences (AVD) method, after the creation of a time history speckle pattern (THSP) matrix, as can be seen in Fig. 3. The AVD method can be expressed by Eq. (1): where COM is the co-occurrence matrix23 related to the THSP,24–26 and and variables represent the line and column of each point of the COM matrix.Fig. 3Biospeckle image processing protocol adopted in each region of interest of the image. The construction of the time history speckle pattern and its co-occurrence matrix are showed.  The data were also analyzed using the filtering of the signals in different frequency bands. Thus, wavelet transform was used to perform the filtering and the reconstruction of the signal in different bands in order to analyze again by the AVD. The decomposition of a signal using the continuous wavelet transform (CWT) can be summarized in Eq. (2), where CWT represents the coefficients as a function of time () and scale (). Therefore, the signal in time is convolved with , which is the mother wave27 After the decomposition of each pixel from the speckle pattern in time, the reconstruction of the collection of images was carried out at each scale, related to the real value of the frequencies, by means of Eq. (3).27 The number of frequency ranges varies in accordance with the number of images assembled and with the time rate of image acquisition. where the scale () represents a range of frequencies.2.4.Statistical AnalysisIBM Statistical Package for the Social Sciences version 19.0 was used for statistical analysis. An analysis of variance of two factors with repeated measurements was carried out to determine the difference between variables studied. Bonferroni’s test was used for multiple comparison and the test was considered significant for . The AVD relative error was determined as a percentage relation between standard deviation and mean value, and lies between 15 and 19% (Table 1). Table 1Relative error of absolute values of the differences (AVD) for temporal and frequency analysis.
3.Results and DiscussionThe AVD results from the four ROIs within each treatment were averaged, and the evolution in time can be seen in Fig. 4. The AVD values for the activity of the culture medium (RPMI-1640) alone maintained the same in time, which means that the culture medium was stable and, therefore, would not interfere in the analysis of the cancer cells and of the cancer cells with the Colcemid. After the transitions presented in the first 2 h, the treatment of the cancer cells with of Colcemid can be distinguished statistically () from the other two cases [control culture cells and cancer cells with of Colcemid ()]. At time zero, it is possible to see a difference (not significant, ) among the treatments, which was expected since the solutions had different densities caused by the distinct concentrations of the drug. Fig. 4Evolution temporal of the biological activity, quantified by absolute values of the differences (AVD) for control cells, 0.2 and Colcemid-treated cells, and culture medium (RPMI-1640) during 8 h.  Therefore, with time the drug (Colcemid) acts arresting the cell cycle in mitosis and, thus, the activities of the cells are affected, mainly where the concentration of the drug is the highest, , which was expected. The information of the exact moment of the effect of the chemical is key information and presents the dynamic of the drug, and its effect in the cancer cells helps the election of the best drugs and concentrations. Variations in activity between the control cultured cells and cells exposed to 0.2 and of Colcemid shown in Fig. 4 may be explained taking into account the mechanism of action of the drug and its concentration.
Further analysis of the data was conducted using the frequency domain. The relations of biological activity of Colcemid and Colcemid respectively, with the control were analyzed at all frequencies (whole signal) and at all frequency ranges possible regarding the sampling theory. The range of 6.0 to 6.3 Hz was empirically found to be the best region to monitor the phenomena, due to the largest difference between the drug and the control (Fig. 5). Fig. 5Ratio of biological activity of Colcemid-treated cells with control cells during 8 h. The whole signal is compared with the signal in the range of 6.0 to 6.3 Hz. 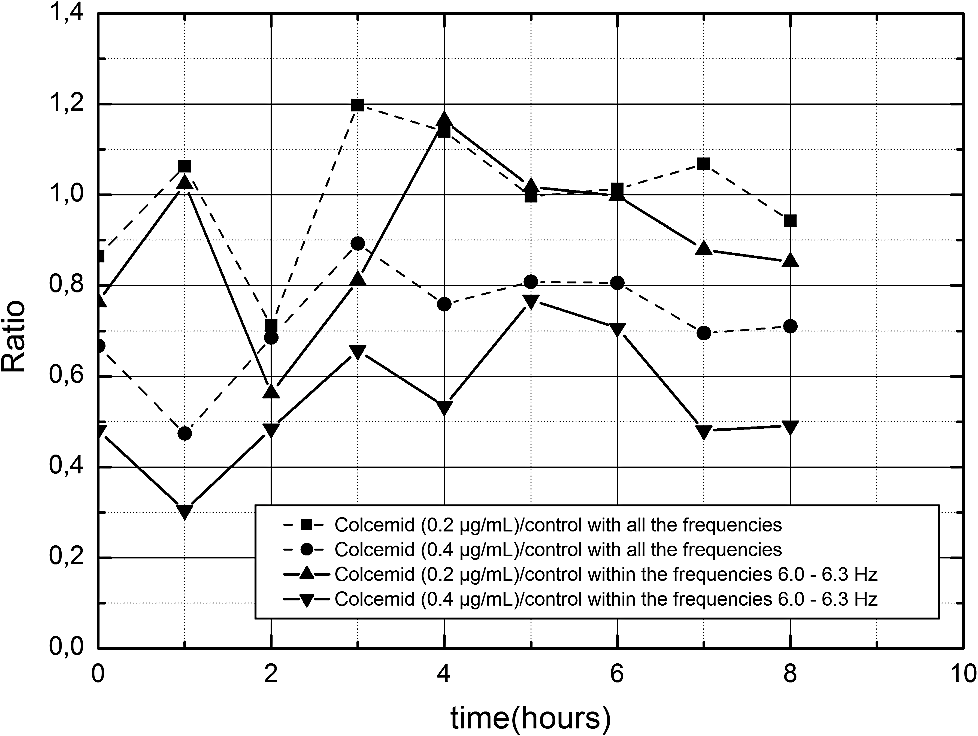 Therefore, this signature in frequency can be used to compare the signals from the biospeckle of a cancer cell with the action of the drug. The differences were shown to be greater than the other intervals after 3 h. Using this signature, it was possible to separate even more the response of the cells with the Colcemid () and the control cells if compared to the signal with all the frequencies. This suggests the use of the monitoring under frequency analysis, and particularly in the range of 6.0 to 6.3 Hz in this particular case. 4.ConclusionsOne can conclude that the dynamic laser speckle, in the experimental configuration proposed and associated with the analysis in the frequency domain, could monitor the interaction of the drug in different concentrations with the cancer cells. In addition, it was possible to identify when the action of the drug, particularly of Colcemid (), provides changes in the biological activity of the cells with melanoma line MEL-RC08 as was expected, since in the literature it is possible to see some works28–30 addressing the effects of Colcemid in cancer cells by means of the traditional chemical methods. The ability of the dynamic laser speckle to provide numerical evaluations, avoiding human judgments and without contact with the biological material, offers analysts a safe tool to monitor the different reactions of cancer cells to drug delivery. AcknowledgmentsThanks to the Department of Pathology of the Medicine and Odontology Faculty of the University of Valencia for the free access to its laboratories and human help, as well as thanks to the University of Lavras and FAPEMIG, CNPq, CAPES, and FINEP for the financial support. ReferencesH. Caiet al., M. Shimaoka,
“Analysis of chemotaxis in Dictyostelium,”
Integrin and Cell Adhesion Molecules: Methods and Protocols, Methods in Molecular Biology, 451
–468 2012). Google Scholar
S. T. Mosleyet al.,
“Targeted killing of cultured cells by receptor-dependent photosensitization,”
Proc. Natl. Acad. Sci. U. S. A., 78
(9), 5717
–5721
(1981). http://dx.doi.org/10.1073/pnas.78.9.5717 PMASAX 0096-9206 Google Scholar
C. Duet al.,
“Smac, a mitochondrial protein that promotes cytochrome c-dependent caspase activation by eliminating IAP inhibition,”
Cell, 102
(1), 33
–42
(2000). http://dx.doi.org/10.1016/S0092-8674(00)00008-8 CELLB5 0092-8674 Google Scholar
S. Elmore,
“Apoptosis: a review of programmed cell death,”
Toxicol. Pathol., 35
(4), 495
–516
(2007). http://dx.doi.org/10.1080/01926230701320337 TOPADD 0192-6233 Google Scholar
H. J. RabalR. A. Braga Jr., Dynamic Laser Speckle and Applications, CRC Press/Taylor & Francis Group, New York
(2009). Google Scholar
A. ZdunekJ. Cybulska,
“Relation of biospeckle activity with quality attributes of apples,”
Sensors, 11
(6), 6317
–6327
(2011). http://dx.doi.org/10.3390/s110606317 SNSRES 0746-9462 Google Scholar
R. A. Braga Jr.et al.,
“Assessment of seed viability by laser speckle techniques,”
Biosyst. Eng., 86
(3), 287
–294
(2003). http://dx.doi.org/10.1016/j.biosystemseng.2003.08.005 BEINBJ 1537-5110 Google Scholar
P. H. A. Carvalhoet al.,
“Motility parameters assessment of bovine frozen semen by biospeckle laser (BSL) system,”
Biosyst. Eng., 102
(1), 31
–35
(2009). http://dx.doi.org/10.1016/j.biosystemseng.2008.09.025 BEINBJ 1537-5110 Google Scholar
Y. A. GanilovaS. S. Ulyanov,
“A study of blood flow in microvessels using biospeckle dynamics,”
Biophysics, 51
(2), 299
–304
(2006). http://dx.doi.org/10.1134/S0006350906020230 BIOPAE 0006-3509 Google Scholar
V. Rajanet al.,
“Speckles in laser Doppler perfusion imaging,”
Opt. Lett., 31
(4), 468
–470
(2006). http://dx.doi.org/10.1364/OL.31.000468 OPLEDP 0146-9592 Google Scholar
S. E. Murialdoet al.,
“Analysis of bacterial chemotactic response using dynamic laser speckle,”
J. Biomed. Opt., 14
(6), 064015
(2009). http://dx.doi.org/10.1117/1.3262608 JBOPFO 1083-3668 Google Scholar
A. Mavilio-Nuñezet al.,
“Characterization of a paint drying process through granulometric analysis of speckle dynamic patterns,”
Signal Process., 90
(5), 1623
–1630
(2010). http://dx.doi.org/10.1016/j.sigpro.2009.11.010 SPRODR 0165-1684 Google Scholar
R. González-Peñaet al.,
“Zeta potential determination using a ZetaMeter-dynamic speckle assembly,”
Proc. SPIE, 8413 84131H
(2012). http://dx.doi.org/10.1117/12.977785 PSISDG 0277-786X Google Scholar
L. Tchvialevaet al.,
“Polarization speckle imaging as a potential technique for in vivo skin cancer detection,”
J. Biomed. Opt., 18
(6), 061211
(2013). http://dx.doi.org/10.1117/1.JBO.18.6.061211 JBOPFO 1083-3668 Google Scholar
R. A. Bragaet al.,
“Biospeckle numerical values over spectral image maps of activity,”
Opt. Commun., 285
(5), 553
–561
(2012). http://dx.doi.org/10.1016/j.optcom.2011.10.079 OPCOB8 0030-4018 Google Scholar
M. A. Hui-Junet al.,
“The study on the response of Cloudman S91 melanoma cells to the specific ingredients of some Chinese herbal medicine in vitro,”
J. Clin. Dermatol., 33
(3), 145
–147
(2004). Google Scholar
R. Gil-Bensoet al.,
“Characterization of a new human melanoma cell line with CD133 expression,”
Hum. Cell, 25
(2), 61
–67
(2012). http://dx.doi.org/10.1007/s13577-011-0027-y HUCEE7 0914-7470 Google Scholar
H. YangA. GangulyF. Cabral,
“Inhibition of cell migration and cell division correlates with distinct effects of microtubule inhibiting drugs,”
J. Biol. Chem., 285
(42), 32242
–32250
(2010). http://dx.doi.org/10.1074/jbc.M110.160820 JBCHA3 0021-9258 Google Scholar
P. S. Moorheadet al.,
“Chromosome preparations of leukocytes cultured from human peripheral blood,”
Exp. Cell. Res., 20 613
–616
(1960). http://dx.doi.org/10.1016/0014-4827(60)90138-5 ECREAL 0014-4827 Google Scholar
J. A. Pomaricoet al.,
“Speckle interferometry applied to pharmacodynamic studies: evaluation of parasite motility,”
Eur. Biophys. J., 33
(8), 694
–699
(2004). http://dx.doi.org/10.1007/s00249-004-0413-4 EBJOE8 0175-7571 Google Scholar
J. D. BriersS. Webster,
“Laser speckle contrast analysis (LASCA): a nonscanning, full-field technique for monitoring capillary blood flow,”
J. Biomed. Opt., 1
(2), 174
–179
(1996). http://dx.doi.org/10.1117/12.231359 JBOPFO 1083-3668 Google Scholar
R. R. Cardosoet al.,
“Alternative protocols on dynamic speckle laser analysis,”
Proc. SPIE, 8413 84131F
(2012). http://dx.doi.org/10.1117/12.977628 PSISDG 0277-786X Google Scholar
R. M. Haralick,
“Statistical and structural approaches to texture,”
Proc. IEEE, 67
(5), 786
–804
(1979). http://dx.doi.org/10.1109/PROC.1979.11328 IEEPAD 0018-9219 Google Scholar
A. Oulamaraet al.,
“Biological activity measurements on botanical specimen surfaces using a temporal decorrelation effect of laser speckle,”
J. Mod. Opt., 36
(2), 165
–179
(1989). http://dx.doi.org/10.1080/09500348914550221 JMOPEW 0950-0340 Google Scholar
Z. Xuet al.,
“Temporal and spatial properties of the time-varying speckles of botanical specimens,”
Opt. Eng., 34
(5), 1487
–1502
(1995). http://dx.doi.org/10.1117/12.199878 OPEGAR 0091-3286 Google Scholar
R. Arizagaet al.,
“Speckle time evolution characterization by the co-occurrence matrix analysis,”
Opt. Laser Technol., 31
(2), 163
–169
(1999). http://dx.doi.org/10.1016/S0030-3992(99)00033-X OLTCAS 0030-3992 Google Scholar
C. TorrenceG. P. Compo,
“A practical guide to wavelet analysis,”
Bull. Am. Meteorol. Soc., 79
(1), 61
–78
(1998). http://dx.doi.org/10.1175/1520-0477(1998)079<0061:APGTWA>2.0.CO;2 BAMIAT 0003-0007 Google Scholar
M. N. Jha,
“Cell cycle arrest by Colcemid differs in human normal and tumor cells,”
Cancer Res., 54
(18), 5011
–5015
(1994). CNREA8 0008-5472 Google Scholar
C. L. Rieder,
“Colcemid and the mitotic cycle,”
J. Cell Sci., 102
(3), 387
–392
(1992). JNCSAI 0021-9533 Google Scholar
B. K. Bhuyanet al.,
“Colcemid effects on B16 melanoma cell progression and aberrant mitotic division,”
J. Cell. Physiol., 132
(2), 237
–245
(1987). http://dx.doi.org/10.1002/(ISSN)1097-4652 JCLLAX 0021-9541 Google Scholar
BiographyRolando J. González-Peña received his Master of Science degree in optics from the High Technology Institute of Havana in 1998 and his PhD in technical science from the High Technology Institute of Havana in 2001. His current research is focused on digital speckle interferometry and dynamic speckle laser. Currently, he is professor at the Physiology Department in the Faculty of Medicine and Odontology at the University of Valencia. Roberto A. Braga Jr. graduated with a master’s degree in electrical engineering from UFMG, Brazil, and has a doctoral degree in agricultural engineering UNICAMP, Brazil. He has been an associate professor at UFLA, Brazil, since 1996. He teaches electricity and automation and researches in optical instrumentation. His sabbatical leaves include BIOSS Scotland 2005 and 2008 and senior stage in BIOSS and JHI Scotland in 2011. His publications include more than 40 papers, the majority in international journals; he has some patents, chapters of books, and books published. Rosa M. Cibrián graduated in physics from the University of Valencia, Spain, in 1978 and received her PhD in physics from the same university in 1987. She is currently associate professor of Biophysics and Medical Physic of Physiology Department, and director of Master’s Degree in Medical Physics of the University of Valencia. Her current research is focused on digital speckle procedures, non lesive medical image techniques as structured light and thermography, and acoustic perception. Rosario Salvador-Palmer graduated in physics from the University of Valencia, Spain, in 1978 and received her PhD in physics from the same university in 1987. She is currently associate professor of Biophysics and Medical Physic, director of Master’s Degree in Physiology and Coordinator of Doctoral Programme in Physiology of the University of Valencia. Her current research is focused on digital speckle procedures and non lesive medical image techniques as structured light and thermography. Rosario Gil-Benso received her PhD degree in pharmacy from the University of Valencia, Spain, and currently, she is professor in the Department of Pathology of the Medical School of the University of Valencia. Her current research is focused on maintenance and establishment in vitro of human tumoral cells and on the study of genetic and molecular mechanisms implicated in the development and progression of solid human tumors. Teresa San-Miguel graduated in pharmacy from the University of Valencia, Spain. She was a grant-assisted PhD student, got her diploma of advanced studies in human solid tumors program and is currently finishing her PhD. She is a professor in the Department of Pathology of the Medical School. Her current research is focused on cell cultures from human tumors and the study of genetic and molecular mechanisms involved in the genesis and aggressiveness of solid tumors. |


