
|
|
1.IntroductionSkin covers the body and accomplishes multiple defensive functions. Its physiological health and function depend on many parameters. The epidermis represents a barrier against the loss of water and other components from the organism.1,2 Furthermore, this epidermal barrier, mainly due to the stratum corneum (SC), is the limiting unit for the penetration of exogenous substances through the skin.3–5 This well-controlled function is fully assumed in intact skin, but sometimes the SC barrier status can be modified by different external factors such as climate,6 physical stressors, and internal physiological characteristics like hormonal secretion,7 nutrition, as well as the composition of a lipid matrix, i.e., ceramides, free fatty acids, and cholesterol and its derivatives in the intercellular spaces.8–10 The modification of one parameter perturbs the skin homeostasis.11–13 Thus, the effect of each internal characteristic and its relation with the surroundings should be understood. In that optic, dermatologists and cosmetic scientists are highly interested in global characterization of the skin status. Due to the complexity of its structure and functions, a single parameter is not sufficient to describe entirely the skin physiological status.14 Therefore, different methods for monitoring skin functions have been introduced. Among the in vivo skin characterization parameters, transepidermal water loss (TEWL), skin surface acidity (pH), SC hydration, natural moisturizing factors (NMFs) content, and lipids classes’ content are the most frequently analyzed. The measurements of the TEWL give an idea on the SC barrier function, thus providing information on permeability barrier status under normal, experimentally perturbed, or diseased conditions.15–17 Moreover, it has been established that the pH value of the skin surface plays an important role for the epidermal barrier.11,18,19 SC hydration is not only important for maintaining skin’s functional properties, but also has great impact on the skin’s aesthetic properties. Different in vivo methods for the assessment of SC hydration have been described, namely electrical, microwave, thermal, microscopic, magnetic resonances, and spectroscopic including Raman spectroscopy.20–24 However, most commonly applied methods are based on measuring the electrical conductance, capacitance, or impedance as an indirect indicator for SC water content. Meanwhile, those conventional classical in vivo noninvasive methods do not provide direct information about the depth profiles of water content and SC components structure. Confocal Raman microspectroscopy is the first commercial technique that provides an in vivo noninvasive method to determine depth profiles of water concentration in the skin.20,25–30 In-depth measurements allow biopharmaceutical studies.31–33 This technique can also be used to study skin physiology and pathological conditions including cancers.34–38 Thus, Raman spectroscopy seems to be a highly sensitive technique to tiny molecular changes. Therefore, one can assume that variations in a skin parameter would induce changes in the vibrational state. Raman signature associated with the adequate data processing appears to be a good candidate for multiparametric analysis of the skin. Partial least square (PLS) processing coupled to Raman spectroscopy has been presented as a novel approach, making possible to obtain qualitative information about the distribution of the compounds.39,40 The aim of this study was to demonstrate the proof-of-principle of a novel and single-quantitative method in vivo assay for different skin characteristics by using confocal Raman microspectroscopy and PLS data processing. In that purpose, semiquantitative analyses of skin characteristics were realized on volunteers with normal nondiseased skin. Lipid classes’ contents: cholesterol, ceramides, fatty acids; hydration level; and TEWL and pH were monitored and directly correlated to the Raman signal of the five outermost micrometers of the skin. The use of the different fitting coefficients in the validation set enabled us to obtain all different parameters directly from the unique Raman signature. Moreover, in addition to the information obtained from the PLS models, in-depth Raman analyses enabled us to evaluate the variation in water and protein structures in deeper layers. The combinations of all these information led to a multiparametric investigation, which better characterizes the skin status. Raman signal can thus be used as a skin quick response code (skin QR code), because the information in a Raman spectrum can be decoded quickly for predicting different skin characteristics. 2.Materials and MethodsThe in vivo experiments were performed on 11 healthy Caucasian women volunteers aged between 55 and 65 years. Measurements were undertaken at four sampling locations: the volar and outer forearm as well as the inside and outside calf. After a rest period of 20 min in an environmental-controlled room, the different physiological parameters were measured on the same side of the skin. 2.1.In Vivo Raman Microprobe AnalysisIn vivo Raman investigations were performed using an in vivo confocal Raman optical microprobe (Horiba Jobin Yvon, Villeneuve d’Asc, France). The probe is coupled to 5-μm-diameter fiber optic probe (InPhotonics, Norwood, Massachusetts) with a coaxial two-fiber probe, one for excitation and the other for collection. A band-pass filter removes the unwanted signals and transmits the pure laser light. A double-pumped Nd:YLF laser source at 660 nm (Toptica Photonics, Munich, Germany) with 12-mW power on the sample was used. The 660-nm excitation wavelength was chosen because it gives a weak background in the fingerprint region41 and a high Raman Stokes signal in the high-wavenumbers region. A long-focal microscope objective MPlan FLN WD 4.7 (Leica, Mannheim, Germany) (3-μm in-depth resolution) was coupled to a piezoelectric system, allowing “z” movement of 100 μm with adjustable increment. After the lens, an independent device with an aperture of 1 or 2 mm, for adjusting the distance between the skin and the lens, was added to the system so as to be positioned at the optimum working distance. An ultrafast autofocus system allows focusing of the laser on the surface of the skin in near real time. A display system for viewing the surface of the sample is also incorporated to the probe. Collected scattered light was analyzed with Micro-HR Raman spectrometer with a compact rugged geometry () and no internal moving parts. The raw signal was filtered through an edge filter and then dispersed using a holographic grating and a 100-μm slit. The Raman Stokes signal was recorded with a high-sensitivity CCD detector cooled to by Peltier effect. The dispersion of the signal provides a total coverage from 400 to and spectral resolution of . The used system is equipped by a confocal microprobe attached to a movable arm, allowing easy positioning of the probe on skin surface. To monitor the intraindividual variability of the skin physiological status, each location of each volunteer was analyzed on seven different points. For each analyzed point, Z-profiles are made by moving the laser focus point along the optical axis from 0 to 20 μm depths with a 2-μm step. This permits us to access in vivo depth information of the SC. All spectra were subjected to the same automated preprocessing protocol. All spectra were smoothed using a Savitsky–Golay algorithm on 11 points.42 In order to avoid the interference of the fiber background in the analysis, spectra were corrected by baseline subtraction using an automatically generated polynomial function which individually fits to each spectrum of the dataset.37 The exact position of the skin surface was determined using the method described by Tfayli et al.43 For comparison, the absolute intensity variations of spectra were corrected by vector normalization. 2.2.Biometric MeasurementsTrans-epidermal water loss (TEWL) was measured using Tewameter TM210, pH values were measured using Skin pH meter 905 and skin hydration was obtained with Corneometer CM820 all from (Courage & Khazaka electronic GmbH, Köln, Germany). To minimize the intra-individual variation, the presented TEWL, pH and skin hydration values are the mean of 3 measurements. 2.3.In Vivo SC Lipid ExtractionThe in vivo SC lipid extraction was performed using a previously described method.44–46 The sampling area of the skin was wiped (without rubbing) with a filter paper moistened with ether. Then, a surface of was drawn. For lipid extraction, a cotton swab presoaked in a mixture of ethyl acetate/methanol () was used to skip the skin area 10 times in the same direction. The two sides in cotton were removed from cotton swab using fine forceps and placed in a glass flask with polyethylene stopper (PTFE) stopper. The last step was repeated three more times, and each time a new cotton swab was used in a different rubbing direction of the rectangle. The flask containing eight halves of four cotton swabs was surrounded with Parafilm® M at the bottle and cap closure, and then the entire bottle was wrapped with aluminum foil. The extracts were kept at . The contents of the vials were thawed for analysis at room temperature. A 6-mL mixture of chloroform/methanol () was added in the bottle and vortexed for 2 min. The solvent mixture was collected and put in a glass test tube before evaporation to dryness under a stream of nitrogen with gentle heating (50°C). The extraction is repeated with 6 mL of solvent mixture and insert after stirring the dry residue formed previously. The obtained mixture is evaporated once again in the previous described conditions. Therefore, the dry residue is dissolved in 200-μl solvent mixture of heptane/(chloroform:methanol 2:1) () before high-performance liquid chromatography (HPLC) analysis. 2.4.HPLC InstrumentationHPLC was performed using a normal phase separation.44,47 A silica-grafted polyvinyl alcohol (PVA)-Sil column (PVA-bonded column; 5-μm particle size, purchased from YMC (Kyoto, Japan) and thermostated at 35°C in an ultimate oven 3000 RS was used for separation. The solvents were degassed prior to use, and the mobile phase was continuously degassed in a RSLC Ultimate 3000 connected to a Dionex® Ultimate 3000 RSLC pump. Normal-phase liquid chromatography was performed using a binary-gradient solvent system of heptane/chloroform () (solvent A) and acetone (solvent B) using a flow rate of , and the injected volume was 5 μL. The HPLC system was coupled to Corona® CAD (ESA Biosciences, Chelmsford, Massachusetts). The analysis was performed using Chromeleon software. Solvents [Heptane (99.7% purity), chloroform (99.3% purity), and acetone (99.7% purity)] were purchased from VWR (Fontenay-sous-bois, France). 2.5.Chemometric AnalysisMultivariate data analysis was performed on Simca P-11 (Umetrics, Sweden) software. The PLSs48–50 method was applied for the identification of Raman features correlated to the different studied parameters. PLS is a multilinear calibration method that can be used for prediction of events involving multiple variables. The process calculates the maximum covariance between two matrixes and . Thus, the main aim of PLS is to predict the -variables from the -variables. Applied on Raman spectra (-variables), the aim is to obtain an estimation of the multiparametric skin characteristics (-variables) from the spectral dataset. The matrix of the PLS models contained smoothed, baseline-corrected, and scaled spectral data using univector method. The and matrices were centered and autoscaled: unit variance (UV) scaling which gives all variables equal weight. The matrix contained the relative amount of ceramides, fatty acids, cholesterol, hydration level, TEWL, pH, and different depths of the analyzed site of the skin as well. Orthogonal signal correction (OSC)51 was performed prior to PLS regression. 2.5.1.PLS fitting modelFor a clear illustration of how the PLS coefficients are used for the prediction of the present skin characteristics, it is necessary to explain briefly how the linear PLS model is obtained.48–50 First, principal component analysis is performed for variables and it finds new orthogonal variables that are rotated to fit with . They are called -scores. They are estimated as linear combinations of the original variables with the weights . For the model calibration, we determine the appropriate number of latent variables by cross-validation technique with seven rounds and a maximum of 200 iterations. The approach leaves out data in turn for latent variable calculation and stops when predictive residual sum of squares is not significantly improved. The number of latent variables was limited to four to avoid model overfitting. The -scores model and are predictors of expresses the weights. The -residual matrix, represents the deviations between the observed and modeled responses. Thus, the regression model can be written in the following way: The PLS regression coefficient “B” can be summarized as As illustrated by Eq. (4), having and , we can predict . As the and data used for coefficient calculation were UV-scaled, the new spectral data “” that will be used for prediction should be equally transformed. For that, the means () and the standard deviations () of and , respectively, from the model are needed. Thus, new prediction could be calculated as follows: where is UV-scaled , and is UV-scaledThus, the proposed fitting model contains a matrix composed by all PLS coefficients (B) calculated for each observation: amount of ceramides, fatty acids, cholesterol, pH, TEWL, and hydration level (Fig. 1). The fitting model’s structure should also contain information about the mean spectrum () and as well as the and of each observation. 3.Results and Discussion3.1.Prediction of Skin Characteristics Using SC Raman Signal and PLSThe first part of this work deals with the potential of Raman spectroscopy to indirectly quantify the SC lipid classes, pH, TEWL, and hydration of different volunteers. Raman spectra collected from the five outermost micrometers of the skin surface were coupled to PLS regression to monitor the different skin parameters and to try to develop a predicting model. The outermost five micrometers of the skin were chosen for PLS fitting model because the independent molecular and biometric measurements were recorded from the skin surface. 3.1.1.Raman analysis can quantify indirectly ceramides, fatty acids, cholesterol content, pH, TEWL, and hydration levelIn vivo Raman measurements revealed a correlation between the Raman signal and other studied parameters of the skin. Raman spectra are characteristic of the chemical structure of the studied sample. For each skin parameter (relative amount of ceramides, fatty acids, cholesterol, pH, TEWL, and hydration level), the obtained PLS model presented correlation coefficients higher than , reflecting a good predictive ability of the models (Figs. 2 and 3). Fig. 2The PLS regression after orthogonal signal correction (OSC): amount of lipids quantified by high-performance liquid chromatography (HPLC) versus predicted amount of lipids using Raman spectra and PLS data processing. The Y observation is: (a) ceramides; (b) fatty acids; and (c) cholesterol. The number of latent variables is in brackets on -axis. 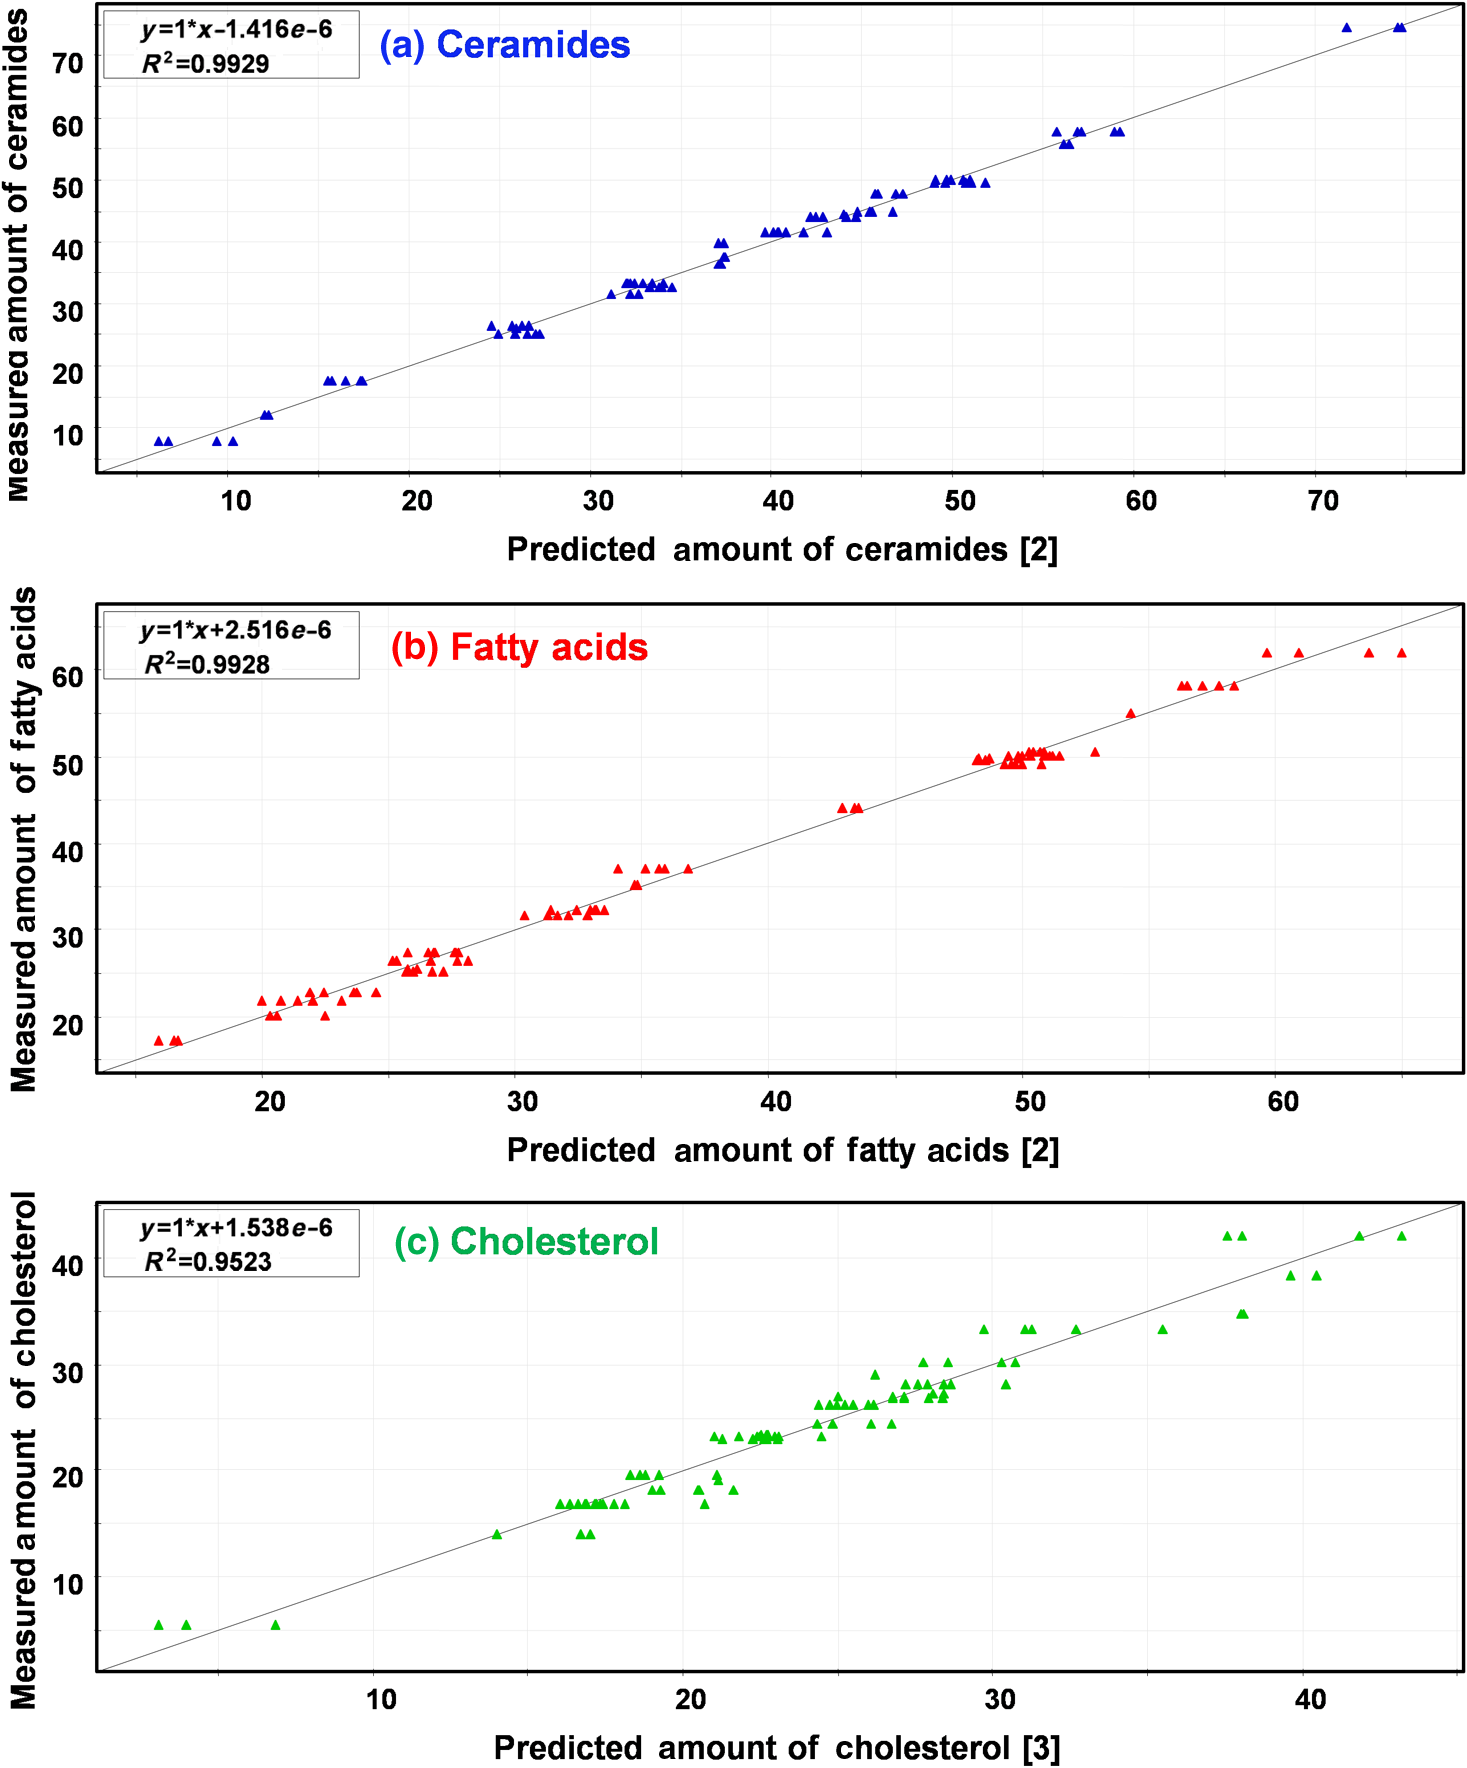 Fig. 3PLS regression after OSC: amount of lipids quantified by HPLC versus predicted amount of lipids using Raman spectra and PLS data processing. The Y observation is: (a) pH; (b) TEWL; and (c) corneometry. The number of latent variables is in brackets on -axis.  In order to obtain an estimate of the predictive ability of the present PLS regression model, a cross-validation52,53 was used. Some characteristics of the PLS model are illustrated in Table 1. Table 1Characteristics of the partial least square (PLS) goodness of fits.
Note: R2X(cum): predictive+orthogonal variations in X that is explained by the model; R2X: the amount of variation in X that is correlated to Y; R2VY: the cumulative percent of the variation of the response explained by the model after the last component. R2 is a measure of fit, i.e., how well the model fits the data; R2VYAdj: the cumulative percent of the variation of the response, adjusted for degrees of freedom, explained by the model after the last component; Q2VY: the cumulative percent of the variation of the response predicted by the model, after the last component, according to cross-validation. Q2 tells how well the model predicts the new data. A useful model should have a large Q2; RSD(Y): residual standard deviation of Y, in original units, after the last component; RSD(Y)WS: residual standard deviation of Y, as scaled in the workset, after the last component. The difference between the predicted parameters and true value was very small. Root mean square error of estimation and root mean square error of prediction were found to be less than 0.5% and 0.7%, respectively. The mean confidence interval for the test set was between 0.1 and 0.2, demonstrating a good precision and accuracy for those models. Thus, we showed that we can indirectly quantify the different parameters of the skin using only its Raman spectra (Figs. 2 and 3). In addition to that, the PLS coefficient “” [Eq. (4)] showed that Raman features are sensitive to a specific analyzed parameter. The model enables the detection of those characteristic Raman modifications which were related to each studied criterion of the analyzed site. As an example, Figs. 4 and 5 illustrate, respectively, the evolution of the Raman signal related to each class of SC lipids, i.e., ceramides, fatty acids, cholesterol, and biometric measurements. Taking the present PLS processing, as mentioned above, it is possible to set up a “data structure” that contains the PLS calibration factors and uses them for prediction of newly acquired spectra [Fig. 1; Eq. (7)]. Fig. 4Coefficient plot of PLS regression after OSC. These coefficients correspond to the regression vectors in matrix of Eq. (4). The Y observation is: (a) ceramides; (b) fatty acids; and (c) cholesterol. The number of latent variables is in brackets on -axis.  Fig. 5Coefficient plot of PLS regression after OSC. These coefficients correspond to the regression vectors in matrix of Eq. (4). The Y observation is: (a) pH; (b) TEWL; and (c) corneometry. The number of latent variables is in brackets on -axis.  Like every instrumental measurement, a calibration procedure is needed for the present method. The presently found coefficients should work on data acquired with the similar Raman microprobe and be using exactly the same data preprocessing and processing. It is known that the noise and the spectral resolution depend on the performances of a system used in Raman spectroscopy measurements. The preprocessing methods used as the fluorescence removal algorithm highly affect the spectral features shape.54 Therefore, for a different operating environment, a new model should be developed. Thus, to facilitate clinical use, integrated real-time Raman spectroscopy systems55 for skin evaluation and characterization, which combines real-time data acquisition and processing, should be encouraged. The present processing showed that there is a lot of information hidden in a Raman spectrum. Since the developed predicting model is based on standard independent measurements, an accurate quantification of real content of ceramides, fatty acids, cholesterol, pH, TEWL, and corneometry could be obtained from the unique Raman signature. Each of these skin characteristics is important to evaluate the skin’s health. The advantage of the proposed method lies in the rapidity, noninvasiveness, label-free and reagent-free analysis, and molecular characteristics of Raman measurements. Indeed, indirect quantification of lipid content could be done in less than 1 min instead of many hours and solvent consuming that is required by the HPLC method. This means that the cost of analyses is dramatically reduced. Instead of using many apparatus which, in addition, requires specialists of all the above-mentioned analytical methods, only the Raman microspectrometer is needed to quantify fully and automatically all these skin parameters. 3.2.Relationship Between Skin CharacteristicsIn addition to the accessibility to different characteristics of skin by combining different approaches, it is of highest interest to evaluate how different skin characteristics are interrelated. Thus, the internal balance between different classes of lipids was monitored. Moreover, the measured biometric values were compared with each other in order to highlight the link involved between SC hydration level, barrier function, acidity, and its lipid composition. 3.2.1.SC lipid compositionThe lipid composition of the epidermis governs the skin barrier, mechanics, and appearance. The method commonly used to determine lipid profiles is HPLC.44,47,56 The used polar stationary phase allows separation of the lipids according to the nature or the polar head. The presently used method refers to the work of Merle et al.44 Control solutions of cholesterol, palmitic acid, cholesteryl palmitate, glyceryl trioleate, and ceramides (cer2, Cer IIIB, Cer 6) were injected to determine the elution order and retention time. All the lipid classes are eluted between 2 and 26 min with the elution order as follows: cholesterol ester is eluted within 2 min, fatty acids between 3.5 and 6 min, cholesterol about 5 min, and followed by ceramides. Within the ceramides class, the elution order is essentially conditioned by the number of OH content in the polar head of ceramides. Thus, we observe the first elution of dihydrosphingosine bases and sphingosine bases that would be followed by phytosphingosine bases and 6-hydroxy sphingosine bases. There is a partial overlapping area between the elution characteristics of each base depending on the alkyl chain lengths and number of unsaturations. Similar elution was described by Van Smeden et al.47 on normal phase with a column of PVA. As an example, Fig. 6 represents a chromatogram obtained from one sample. Fig. 6Chromatogram of in vivo stratum corneum (SC) lipids extracts obtained using HPLC/Corona system (see text): (A) cholesterol esters; (B) fatty acids; (C) cholesterol; and (D) ceramides.  Relative quantification was performed by lipid classes after deducting interfering compounds present in the cotton swab areas. The results of lipid class amounts are presented as a percentage of the total chromatogram area. Figure 7 illustrates that fatty acids evolved in the opposite way from ceramides, whereas the cholesterol varies slightly. Variations in skin composition and supramolecular structure may impact on biometric measurement and/or Raman spectra. It is worthy to notice that Raman features from Fig. 4 evolve in the same way for fatty acid and cholesterol, whereas ceramides features evolve inversely. The same phenomenon is observed in Fig. 7 using HPLC quantification. Once more, this observation illustrates that the PLS coefficients of the model can be used to calculate the different skin parameters based on a Raman spectrum. 3.2.2.Lipid content impact on hydration level and TEWLWe have seen that fatty acids are inversely related to ceramides with small variations of cholesterol amount. It must be interesting to investigate how the balance between those two types of lipids affects other skin characteristics. Free fatty acids are thought to play an important role in SC acidification and its role not only for barrier homeostasis, but also for the dual functions of SC integrity and cohesion.19 Here, no such effect on pH was demonstrated (data not shown). Furthermore, we did not observe obvious direct correlation between fatty acids, TEWL, and hydration. However, it appeared that maximum hydration and minimum TEWL are observed when fatty acid amount is around 40% of total lipids (Fig. 8). Fig. 8Comparison between fatty acid content of the SC, hydration level, and TEWL. Each patient was analyzed on two anatomical areas. The curves are based on data fitting using polynomial function and serve to guide the eye.  It is demonstrated that the present studied characteristics are interrelated in the skin.57 For example, the pH modifications affect the conformation of some molecules like urocanic acid and thus modify the spectrum of the SC samples.58 Moreover, the influence of the lipid composition and the barrier function was highlighted based on the study of the conformational order and the compactness of the lipid matrix.35,59,60 Therefore, since the proposed skin QR code could provide the values of different skin characteristics including the content of SC lipids, we could characterize the relationship existing between all different parameters for specific skin status such as physiological status, pathological phenomena, and population specificity. This multiparametric investigation leads to a better understanding of the studied phenomena. 3.2.3.Skin surface pH impacts on epidermal barrier functionFrom Fig. 9, we observed a trend relating TEWL and pH of the investigated skin site. Our results suggest that a decrease of the pH level increases the epidermal barrier function (lowering TEWL). This is in accordance with previous studies. It has been established that the acidic status of the skin surface plays a central role for the epidermal permeability barrier homeostasis11 and the restoration of the disrupted barrier. The recovery of the perturbed barrier is delayed at a neutral pH, due to the disturbance in extracellular processing of the SC lipids.18 Therefore, acidification of the skin is advised in diseases with skin barrier.17 Fig. 9Comparison of TEWL, hydration level, and pH values of the epidermis: the curves are based on data fitting using linear function and serve to guide the eye.  Meanwhile, the hydration from corneometer measurements seemed to vary randomly (Fig. 9). Even though there is a slight trend, contrary to previous studies,61 no correlation between SC hydration and TEWL values was observed in the present study. However, it is known that the water content of the SC affects its physical properties such as barrier status as well as the regulation of physiological functions. The lack of SC water content generally induces dryness and impairs epidermal barrier function.62 Thus, it is increasingly evident that methods like corneometry are less useful in the assessment of skin dryness. Indeed, depending on the frequency used, this technique penetrates around 40 μm under the skin surface, which is deeper in the SC layer (thickness . It has been shown recently that the only correlation between capacitance measurements and confocal Raman spectroscopy data is the water content in the lower layers of the epidermis.63 Moreover, this technique is not able to detect small changes in SC hydration and is subjected to interference from other substances.64 The observations appear to be supported by near-infrared analysis, which indicates that impedance measurements and capacitance are relatively insensitive to small water content changes.65 Then, confocal Raman microspectroscopy appears to be an alternative and more resolute technique to record with precision the SC hydration level and water structure in the SC. 3.3.In Vivo SC Depth AnalysesIn addition to the multiparametric characterization of the skin by combining PLS models to Raman spectra, and the interrelation between the different parameters, Raman data are directly informative on the water structure (tightly bound, partially bound, and unbound water) and protein folding within the skin. In this optic, in-depth analyses were performed in order to assess the evolution of water and protein structures (Fig. 10). Fig. 10Mean Raman spectra acquired at different skin depths: from surface (0 μm) down to 20 μm. The spectra are smoothed, baseline-corrected, and normalized.  3.3.1.Skin hydration profileThe electrical methods give an integrated value of the SC hydration, rather than the actual water distribution of the superficial epidermal layer. The efficiency of the Raman measurement to evaluate the hydration profile of SC was determined through the correlation with high-frequency electrical conductance of tape-stripped human skin in vivo.66 The results obtained in the present study on water profile using Raman microspectroscopy revealed that global water content rises gradually from the skin surface to the lower parts of SC (Fig. 10). This is in accordance with previously recorded data using in vivo confocal Raman microspectroscopy.20,28 In addition to that, Raman microscopy can provide information on different structures of water.23,67–70 Interestingly, as observed on PLS coefficient plot [Fig. 11, Eq. (4)], the fraction of spectral features between 3245 and (zone A on Fig. 11) related to partially bound water content decreased with depth [Fig. 12(a)], whereas the fraction of spectral features between 3420 and (zone B on Fig. 11) from unbound water increased with depth [Fig. 12(b)]. In parallel, a recent in vitro study has revealed that at over 60% of relative humidity, the SC partially bound water content decreases in favor of unbound water.23 Fig. 11Coefficient plot of PLS regression after OSC. The Y observation is in depth under skin surface down to 20 μm.  Fig. 12Water profile of volar forearm SC obtained with in vivo confocal Raman microspectroscopy down to 20 μm depth of different volunteers 1, 2, 3, 4, and 5. The band areas were calculated directly on the experimental spectra: (a) partially bound water fraction; and (b) unbound water fraction.  The observed phenomenon must be due to the equilibrium between those two types of water. The increase of unbound water weakens the forces of intermolecular bonds between water and SC components, which results in a decrease of the partially bound water features around . The same behavior was observed for forearm as well as for calf. The unique and direct quantification of partially bound and unbound water contents provided by in vivo confocal Raman microspectroscopy offers a whole new perspective for fundamental skin moisturization. This is an additional application of the present technique that has proved the ability to assess detailed in vivo concentration profiles of water and of NMF for the SC.20,25–28,71 3.3.2.Protein folding profileThe modification of water content is accompanied by protein structural changes. The shift of toward high wavenumbers testifies to the unfolded status of the keratin, so favored due to the interaction between the side chains of its amino acids and water molecules.67,68 For all analyzed sites, the increase of depth and consequently the increase of water were followed by an unfolding process of the protein, i.e., shift of toward higher wavenumbers (Fig. 13). This is in conjunction with ex vivo observations.23 4.ConclusionThe methodology used in the present study combines chemometrics and analytical measurements. This processing greatly advances our capabilities for research by dealing with large volumes of information that involve computer-based resources such as algorithms and multivariate statistical methods. A key task in this processing is to facilitate the representation of information hidden in data for a better understanding of the underlying biological complexities. The present in vivo noninvasive Raman analysis of the skin enables a very quick evaluation of a big amount of SC characteristics (quantifies ceramides, fatty acids, cholesterol, pH, TEWL, bound-water profile, unbound-water profile, and protein folding profile). The presently developed approach offers a big advantage in terms of prediction and data compression, leading in saving time and materials. This simplifies skin investigation and thereby other techniques will consider only what is not predicted by Raman measurements. The combinations of all this obtained information led to a multiparametric investigation, which better characterizes the skin status. Raman signal could thus be used as a “skin QR code” for predicting different skin characteristics and for determining their link with different physiological and pathological phenomena. Thus, in the dermocosmetic field, this promising and suitable method will undoubtedly offer new opportunities of skin health test evaluation. ReferencesS. E. Friberget al.,
“Water permeation of reaggregated stratum corneum with model lipids,”
J. Invest. Dermatol., 94
(3), 377
–380
(1990). http://dx.doi.org/10.1111/jid.1990.94.issue-3 JIDEAE 0022-202X Google Scholar
P. M. Elias,
“Epidermal barrier function: intercellular lamellar lipid structures, origin, composition and metabolism,”
J. Controlled Release, 15
(3), 199
–208
(1991). http://dx.doi.org/10.1016/0168-3659(91)90111-P JCREEC 0168-3659 Google Scholar
V. Schreineret al.,
“Barrier characteristics of different human skin types investigated with X-ray diffraction, lipid analysis, and electron microscopy imaging,”
J. Invest. Dermatol., 114
(4), 654
–660
(2000). http://dx.doi.org/10.1046/j.1523-1747.2000.00941.x JIDEAE 0022-202X Google Scholar
G. M. Goldenet al.,
“Stratum corneum lipid phase transitions and water barrier properties,”
Biochemistry, 26
(8), 2382
–2388
(1987). http://dx.doi.org/10.1021/bi00382a045 MIRBD9 0144-0578 Google Scholar
P. M. EliasD. S. Friend,
“The permeability barrier in mammalian epidermis,”
J. Cell Biol., 65
(1), 180
–191
(1975). http://dx.doi.org/10.1083/jcb.65.1.180 JCLBA3 0021-9525 Google Scholar
M. Dendaet al.,
“Exposure to a dry environment enhances epidermal permeability barrier function,”
J. Invest. Dermatol., 111
(5), 858
–863
(1998). http://dx.doi.org/10.1046/j.1523-1747.1998.00333.x JIDEAE 0022-202X Google Scholar
A. Sandilandset al.,
“Filaggrin in the frontline: role in skin barrier function and disease,”
J. Cell Sci., 122
(9), 1285
–1294
(2009). http://dx.doi.org/10.1242/jcs.033969 JNCSAI 0021-9533 Google Scholar
G. Imokawaet al.,
“Decreased level of ceramides in stratum corneum of atopic dermatitis: an etiologic factor in atopic dry skin?,”
J. Invest. Dermatol., 96
(4), 523
–526
(1991). http://dx.doi.org/10.1111/jid.1991.96.issue-4 JIDEAE 0022-202X Google Scholar
K. Akimotoet al.,
“Quantitative analysis of stratum corneum lipids in xerosis and asteatotic eczema,”
J. Dermatol., 20
(1), 1
–6
(1993). JDMYAG 0385-2407 Google Scholar
J. A. Bouwstraet al.,
“The lipid organisation in the skin barrier,”
Acta Derm. Venereol. Suppl. (Stockh.), 208 23
–30
(2000). Google Scholar
J. P. Hachemet al.,
“pH directly regulates epidermal permeability barrier homeostasis, and stratum corneum integrity/cohesion,”
J. Invest. Dermatol., 121
(2), 345
–353
(2003). http://dx.doi.org/10.1046/j.1523-1747.2003.12365.x JIDEAE 0022-202X Google Scholar
A. Alonsoet al.,
“Water increases the fluidity of intercellular membranes of stratum corneum: correlation with water permeability, elastic, and electrical resistance properties,”
J. Invest. Dermatol., 106
(5), 1058
–1063
(1996). http://dx.doi.org/10.1111/jid.1996.106.issue-5 JIDEAE 0022-202X Google Scholar
J. Satoet al.,
“Abrupt decreases in environmental humidity induce abnormalities in permeability barrier homeostasis,”
J. Invet. Dermatol., 119
(4), 900
–904
(2002). http://dx.doi.org/10.1046/j.1523-1747.2002.00589.x Google Scholar
Detection of Skin Irritation Potential of Cosmetics by Non-Invasive Measurements, Karger, Basel, Suisse
(2000). Google Scholar
J. D. Plessiset al.,
“International guidelines for the in vivo assessment of skin properties in non-clinical settings: part 2. Transepidermal water loss and skin hydration,”
Skin Res. Technol., 19
(3), 265
–278
(2013). http://dx.doi.org/10.1111/srt.12037 0909-752X Google Scholar
J. S. Fergusonet al.,
“Assessment of skin barrier function in podoconiosis: measurement of stratum corneum hydration and transepidermal water loss,”
Br. J. Dermatol., 168
(3), 550
–554
(2013). http://dx.doi.org/10.1111/bjd.2013.168.issue-3 BJDEAZ 1365-2133 Google Scholar
R. Darlenskiet al.,
“Non-invasive in vivo methods for investigation of the skin barrier physical properties,”
Eur. J. Pharm. Biopharm., 72
(2), 295
–303
(2009). http://dx.doi.org/10.1016/j.ejpb.2008.11.013 EJPBEL 0939-6411 Google Scholar
K. M. Hansonet al.,
“Two-photon fluorescence lifetime imaging of the skin stratum corneum pH gradient,”
Biophys. J., 83
(3), 1682
–1690
(2002). http://dx.doi.org/10.1016/S0006-3495(02)73936-2 BIOJAU 0006-3495 Google Scholar
J. W. Fluhret al.,
“Generation of free fatty acids from phospholipids regulates stratum corneum acidification and integrity,”
J. Invet. Dermatol., 117
(1), 44
–51
(2001). Google Scholar
M. EgawaT. HiraoM. Takahashi,
“In vivo estimation of stratum corneum thickness from water concentration profiles obtained with Raman spectroscopy,”
Acta Derm. Venereol., 87
(1), 4
–8
(2007). http://dx.doi.org/10.2340/00015555-0183 ADVEA4 0001-5555 Google Scholar
P. J. Casperset al.,
“In vivo confocal Raman microspectroscopy of the skin: noninvasive determination of molecular concentration profiles,”
J. Invest. Dermatol., 116
(3), 434
–442
(2001). http://dx.doi.org/10.1046/j.1523-1747.2001.01258.x JIDEAE 0022-202X Google Scholar
P. J. Casperset al.,
“In vitro and in vivo Raman spectroscopy of human skin,”
Biospectroscopy, 4
(S5), S31
–S39
(1998). http://dx.doi.org/10.1002/(ISSN)1520-6343 BIOSFS 1075-4261 Google Scholar
R. Vyumvuhoreet al.,
“Effects of atmospheric relative humidity on stratum corneum structure at the molecular level: ex vivo Raman spectroscopy analysis,”
Analyst, 138
(14), 4103
–4111
(2013). http://dx.doi.org/10.1039/c3an00716b ANLYAG 0365-4885 Google Scholar
A. J. Byrne,
“Bioengineering and subjective approaches to the clinical evaluation of dry skin,”
Int. J. Cosmet. Sci., 32
(6), 410
–420
(2010). http://dx.doi.org/10.1111/j.1468-2494.2010.00584.x IJCMDW 0142-5463 Google Scholar
P. J. CaspersG. W. LucassenG. J. Puppels,
“Combined in vivo confocal Raman spectroscopy and confocal microscopy of human skin,”
Biophys. J., 85
(1), 572
–580
(2003). http://dx.doi.org/10.1016/S0006-3495(03)74501-9 BIOJAU 0006-3495 Google Scholar
L. Chritet al.,
“An in vivo randomized study of human skin moisturization by a new confocal Raman fiber-optic microprobe: assessment of a glycerol-based hydration cream,”
Skin Pharmacol. Physiol., 19
(4), 207
–215
(2006). http://dx.doi.org/10.1159/000093116 SPPKE6 1660-5527 Google Scholar
E. Ciampiet al.,
“Dynamic in vivo mapping of model moisturiser ingress into human skin by GARfield MRI,”
NMR Biomed., 24
(2), 135
–144
(2011). http://dx.doi.org/10.1002/nbm.v24.2 NMRBEF 0952-3480 Google Scholar
M. EgawaH. Tagami,
“Comparison of the depth profiles of water and water-binding substances in the stratum corneum determined in vivo by Raman spectroscopy between the cheek and volar forearm skin: effects of age, seasonal changes and artificial forced hydration,”
Br. J. Dermatol., 158
(2), 251
–260
(2008). http://dx.doi.org/10.1111/(ISSN)1365-2133 BJDEAZ 1365-2133 Google Scholar
M. Försteret al.,
“Confocal Raman microspectroscopy for evaluating the stratum corneum removal by 3 standard methods,”
Skin Pharmacol. Physiol., 24
(2), 103
–112
(2011). http://dx.doi.org/10.1159/000322306 SPPKE6 1660-5527 Google Scholar
N. NakagawaM. MatsumotoS. Sakai,
“In vivo measurement of the water content in the dermis by confocal Raman spectroscopy,”
Skin Res. Technol., 16
(2), 137
–141
(2010). http://dx.doi.org/10.1111/srt.2010.16.issue-2 0909-752X Google Scholar
R. Mateuset al.,
“A new paradigm in dermatopharmacokinetics—confocal Raman spectroscopy,”
Int. J. Pharm., 444
(1–2), 106
–108
(2013). http://dx.doi.org/10.1016/j.ijpharm.2013.01.036 IJPHDE 0378-5173 Google Scholar
S. J. Jianget al.,
“Biophysical and morphological changes in the stratum corneum lipids induced by UVB irradiation,”
J. Dermatol. Sci., 44
(1), 29
–36
(2006). http://dx.doi.org/10.1016/j.jdermsci.2006.05.012 JDSCEI 0923-1811 Google Scholar
J. Chaikenet al.,
“Instrument for near infrared emission spectroscopic probing of human fingertips in vivo,”
Rev. Sci. Instrum., 81
(3), 034301
(2010). http://dx.doi.org/10.1063/1.3314290 RSINAK 0034-6748 Google Scholar
A. Tfayliet al.,
“In vivo analysis of tissue by Raman microprobe: examination of human skin lesions and esophagus Barrett’s mucosa on an animal model,”
Proc. SPIE, 6093 259
–268
(2006). http://dx.doi.org/10.1117/12.645874 Google Scholar
A. Tfayliet al.,
“Raman spectroscopy: feasibility of in vivo survey of stratum corneum lipids, effect of natural aging,”
Eur. J. Dermatol., 22
(1), 36
–41
(2012). EJDEE4 1167-1122 Google Scholar
T. Bhattacharjeeet al.,
“Swiss bare mice: a suitable model for transcutaneous in vivo Raman spectroscopic studies of breast cancer,”
Lasers Med. Sci., 29
(1), 325
–333
(2014). http://dx.doi.org/10.1007/s10103-013-1347-9 Google Scholar
J. Zhaoet al.,
“Automated autofluorescence background subtraction algorithm for biomedical Raman spectroscopy,”
Appl. Spectrosc., 61
(11), 1225
–1232
(2007). http://dx.doi.org/10.1366/000370207782597003 APSPA4 0003-7028 Google Scholar
P. A. Philipsenet al.,
“Diagnosis of malignant melanoma and basal cell carcinoma by in vivo NIR-FT Raman spectroscopy is independent of skin pigmentation,”
Photochem. Photobiol. Sci., 12
(5), 770
–776
(2013). http://dx.doi.org/10.1039/c3pp25344a PPSHCB 1474-905X Google Scholar
J. M. Amigoet al.,
“A comparison of a common approach to partial least squares-discriminant analysis and classical least squares in hyperspectral imaging,”
Int. J. Pharm., 373
(1–2), 179
–182
(2009). http://dx.doi.org/10.1016/j.ijpharm.2009.02.014 IJPHDE 0378-5173 Google Scholar
M. Pudlaset al.,
“Raman spectroscopy: a noninvasive analysis tool for the discrimination of human skin cells,”
Tissue Eng. C Methods, 17
(10), 1027
–1040
(2011). http://dx.doi.org/10.1089/ten.tec.2011.0082 1937-3384 Google Scholar
S. Tfailiet al.,
“Confocal Raman microspectroscopy for skin characterization: a comparative study between human skin and pig skin,”
Analyst, 137
(16), 3673
–3682
(2012). http://dx.doi.org/10.1039/c2an16292j ANLYAG 0365-4885 Google Scholar
A. SavitzkyM. J. E. Golay,
“Smoothing and differentiation of data by simplified least squares procedures,”
Anal. Chem., 36
(8), 1627
–1639
(1964). http://dx.doi.org/10.1021/ac60214a047 ANCHAM 0003-2700 Google Scholar
A. TfayliO. PiotM. Manfait,
“Confocal Raman microspectroscopy on excised human skin: uncertainties in depth profiling and mathematical correction applied to dermatological drug permeation,”
J. Biophotonics, 1
(2), 140
–153
(2008). http://dx.doi.org/10.1002/(ISSN)1864-0648 JBOIBX 1864-063X Google Scholar
C. Merleet al.,
“Quantitative study of the stratum corneum lipid classes by normal phase liquid chromatography: comparison between two universal detectors,”
J. Liq. Chromatogr. Relat. Technol., 33
(5), 629
–644
(2010). http://dx.doi.org/10.1080/10826071003608520 JLCTFC 1082-6076 Google Scholar
“Topologie de lipides cutanes: correlation avec le photo-vieillissement cutane et la penetration percutanee,”
Analytical Chemistry, 80
–96 Chatenay-Malabry
(2009). Google Scholar
A. P. M. Lavrijsenet al.,
“Validation of an in vivo extraction method for human stratum corneum ceramides,”
Arch. Dermatol. Res., 286
(8), 495
–503
(1994). http://dx.doi.org/10.1007/BF00371579 ADREDL 0340-3696 Google Scholar
J. Van Smedenet al.,
“LC/MS analysis of stratum corneum lipids: ceramide profiling and discovery,”
J. Lipid Res., 52
(6), 1211
–1221
(2011). http://dx.doi.org/10.1194/jlr.M014456 JLPRAW 0022-2275 Google Scholar
R. Bro,
“Multiway calibration. Multilinear PLS,”
J. Chemom., 10
(1), 47
–61
(1996). http://dx.doi.org/10.1002/(ISSN)1099-128X JOCHEU 0886-9383 Google Scholar
S. WoldM. SjostromL. Eriksson,
“PLS-regression: a basic tool of chemometrics,”
Chemom. Intell. Lab. Syst., 58
(2), 109
–130
(2001). http://dx.doi.org/10.1016/S0169-7439(01)00155-1 CILSEN 0169-7439 Google Scholar
I. Barmanet al.,
“Development of robust calibration models using support vector machines for spectroscopic monitoring of blood glucose,”
Anal. Chem., 82
(23), 9719
–9726
(2010). http://dx.doi.org/10.1021/ac101754n ANCHAM 0003-2700 Google Scholar
S. Woldet al.,
“Orthogonal signal correction of near-infrared spectra,”
Chemom. Intell. Lab. Syst., 44
(1–2), 175
–185
(1998). http://dx.doi.org/10.1016/S0169-7439(98)00109-9 CILSEN 0169-7439 Google Scholar
H. T. EastmentW. J. Krzanowski,
“Cross-validatory choice of the number of components from a principal component analysis,”
Technometrics, 24
(1), 73
–77
(1982). http://dx.doi.org/10.1080/00401706.1982.10487712 TCMTA2 0040-1706 Google Scholar
G. DianaC. Tommasi,
“Cross-validation methods in principal component analysis: a comparison,”
Stat. Methods Appl., 11
(1), 71
–82
(2002). http://dx.doi.org/10.1007/BF02511446 1618-2510 Google Scholar
M. G. Ramirez-EliasJ. AldaF. J. Gonzalez,
“Noise and artifact characterization of in vivo Raman spectroscopy skin measurements,”
Appl. Spectrosc., 66
(6), 650
–655
(2012). http://dx.doi.org/10.1366/11-06495 APSPA4 0003-7028 Google Scholar
J. Zhaoet al.,
“Integrated real-time Raman system for clinical in vivo skin analysis,”
Skin Res. Technol., 14
(4), 484
–492
(2008). http://dx.doi.org/10.1111/srt.2008.14.issue-4 0909-752X Google Scholar
M. Ponecet al.,
“Characterization of reconstructed skin models,”
Skin Pharmacol. Appl. Skin Physiol., 15
(Suppl 1), 4
–17
(2002). http://dx.doi.org/10.1159/000066682 SPAPFF 1422-2868 Google Scholar
Y. Jokuraet al.,
“Molecular analysis of elastic properties of the stratum corneum by solid-state 13C-nuclear magnetic resonance spectroscopy,”
J. Invest. Dermatol., 104
(5), 806
–812
(1995). http://dx.doi.org/10.1111/jid.1995.104.issue-5 JIDEAE 0022-202X Google Scholar
P. J. CaspersG. W. LucassenE. A. Carter,
“In vivo confocal raman microspectroscopy of the skin: noninvasive determination of molecular concentration profiles,”
J. Invest. Dermatol., 116
(3), 434
–442
(2001). http://dx.doi.org/10.1046/j.1523-1747.2001.01258.x JIDEAE 0022-202X Google Scholar
E. Guillardet al.,
“Thermal dependence of Raman descriptors of ceramides. Part II: effect of chains lengths and head group structures,”
Anal. Bioanal. Chem., 399
(3), 1201
–1213
(2011). http://dx.doi.org/10.1007/s00216-010-4389-x ABCNBP 1618-2642 Google Scholar
A. Tfayliet al.,
“Thermal dependence of Raman descriptors of ceramides. Part I: effect of double bonds in hydrocarbon chains,”
Anal. Bioanal. Chem., 397
(3), 1281
–1296
(2010). http://dx.doi.org/10.1007/s00216-010-3614-y ABCNBP 1618-2642 Google Scholar
J. W. Fluhret al.,
“Testing for irritation with a multifactorial approach: comparison of eight non-invasive measuring techniques on five different irritation types,”
Br. J. Dermatol., 145
(5), 696
–703
(2001). http://dx.doi.org/10.1046/j.1365-2133.2001.04431.x BJDEAZ 1365-2133 Google Scholar
S. Verdier-SevrainF. Bonte,
“Skin hydration: a review on its molecular mechanisms,”
J. Cosmet. Dermatol., 6
(2), 75
–82
(2007). http://dx.doi.org/10.1111/jcd.2007.6.issue-2 1473-2130 Google Scholar
S. Bielfeldtet al.,
“Assessment of human stratum corneum thickness and its barrier properties by in-vivo confocal Raman spectroscopy,”
Int. J. Cosmet. Sci., 31
(6), 479
–480
(2009). http://dx.doi.org/10.1111/ics.2009.31.issue-6 IJCMDW 0142-5463 Google Scholar
L. Norlenet al.,
“Inter- and intra-individual differences in human stratum corneum lipid content related to physical parameters of skin barrier function in vivo,”
J. Invest. Dermatol., 112
(1), 72
–77
(1999). http://dx.doi.org/10.1046/j.1523-1747.1999.00481.x JIDEAE 0022-202X Google Scholar
S. L. ZhangP. J. CaspersG. J. Puppels,
“In vivo confocal Raman microspectroscopy of the skin: effect of skin care products on molecular concentration depth-profiles,”
Microsc. Microanal., 11
(Suppl S02), 790
–791
(2005). http://dx.doi.org/10.1017/S1431927605504550 MIMIF7 1431-9276 Google Scholar
M. Bonchevaet al.,
“Depth profiling of stratum corneum hydration in vivo: a comparison between conductance and confocal Raman spectroscopic measurements,”
Exp. Dermatol., 18
(10), 870
–876
(2009). http://dx.doi.org/10.1111/exd.2009.18.issue-10 EXDEEY 0906-6705 Google Scholar
M. Gniadeckaet al.,
“Structure of water, proteins, and lipids in intact human skin, hair, and nail,”
J. Invest. Dermatol., 110
(4), 393
–398
(1998). http://dx.doi.org/10.1046/j.1523-1747.1998.00146.x JIDEAE 0022-202X Google Scholar
M. Gniadeckaet al.,
“Water and protein structure in photoaged and chronically aged skin,”
J. Invest. Dermatol., 111
(6), 1129
–1133
(1998). http://dx.doi.org/10.1046/j.1523-1747.1998.00430.x JIDEAE 0022-202X Google Scholar
G. E. WalrafenY. C. Chu,
“Linearity between structural correlation length and correlated-proton Raman intensity from amorphous ice and supercooled water up to dense supercritical steam,”
J. Phys. Chem., 99
(28), 11225
–11229
(1995). http://dx.doi.org/10.1021/j100028a025 JPCHAX 0022-3654 Google Scholar
P. Learyet al.,
“Hydration studies of pharmaceuticals using IR and Raman spectroscopy,”
Microsc. Microanal., 13
(Suppl S02), 1694
–1695
(2007). http://dx.doi.org/10.1017/S1431927607075198 MIMIF7 1431-9276 Google Scholar
J. WuT. G. Polefka,
“Confocal Raman microspectroscopy of stratum corneum: a pre-clinical validation study,”
Int. J. Cosmet. Sci., 30
(1), 47
–56
(2008). http://dx.doi.org/10.1111/j.1468-2494.2008.00428.x IJCMDW 0142-5463 Google Scholar
BiographyRaoul Vyumvuhore graduated with his pharmacist degree from the Saint-Petersburg Chemo-Pharmaceutical Academy, Russia, and the PhD degree in analytical chemistry from University Paris-Sud, France. His research focused on skin barrier function, hydration, and mechanical properties. He has developed methodologies based on Raman and infrared spectroscopies for a better understanding of the skin structure and function. Ali Tfayli is an assistant professor at the Department of Analytical Chemistry at University Paris-Sud. His research is focused on skin structure characterization using IR and Raman microspectroscopies. His studies on skin lipid structures and hydration have highlighted the underlying processes in lipid barrier functions. He is the initiator and coordinator of several scientific projects for young talent researchers including ANR JCJC 2013 CARE. He has published 22 original research papers and 7 proceedings in international journals and books. Olivier Piot has been working as in the “MéDIAN Unit” Biophotonics and Technologies for Health,” CNRS FRE3481 MEDyC of the Reims Champagne Ardenne University, since 2004. His teaching activities include physics, mathematics, and statistics. His scientific interests are intracellular dynamics of drugs, spectral imaging at the cellular and tissular levels, and new approaches in Raman instrumentation (cellular investigation and in vivo development) and data analysis. He has published over 40 research papers in international journals. Maud Le Guillou received her R&D engineering degree in biology. She previously worked in development of nutritional supplements at Yves Ponroy Laboratories, and she is currently the head of in vivo tests unit at Silab Company. Nathalie Guichard received her degree in applied biology. She worked for the agro-industry in a quality control domain, and she is currently realizing in vivo studies at Silab Company. Michel Manfait is a professor of the Reims Champagne Ardenne University, France, and a head of the “MéDIAN-Biophotonics and Technologies for Health,” CNRS FRE3481 MEDyC. He is responsible for teaching physics, mathematics, and statistics at the Faculty of Pharmacy. He coordinates research projects in biophysics. The main activities are the study of intracellular dynamics of anti-tumor drugs, their cellular targets, and their impact on structural and functional organizations of the nucleus. Arlette Baillet-Guffroy is a professor and associate chair of the Group of Analytical Chemistry of Paris-Sud University. She had additional appointments as member of the 10A working group of the European Pharmacopeia, and she was an expert within ANSM working groups in cosmetology. Her research team works widely on skin lipids: analytical tools for lipidomic purpose and skin aging, analysis of interactions, alterations, and biotransformations. She has published over 100 scientific articles in international reviews and books. |


