|
|
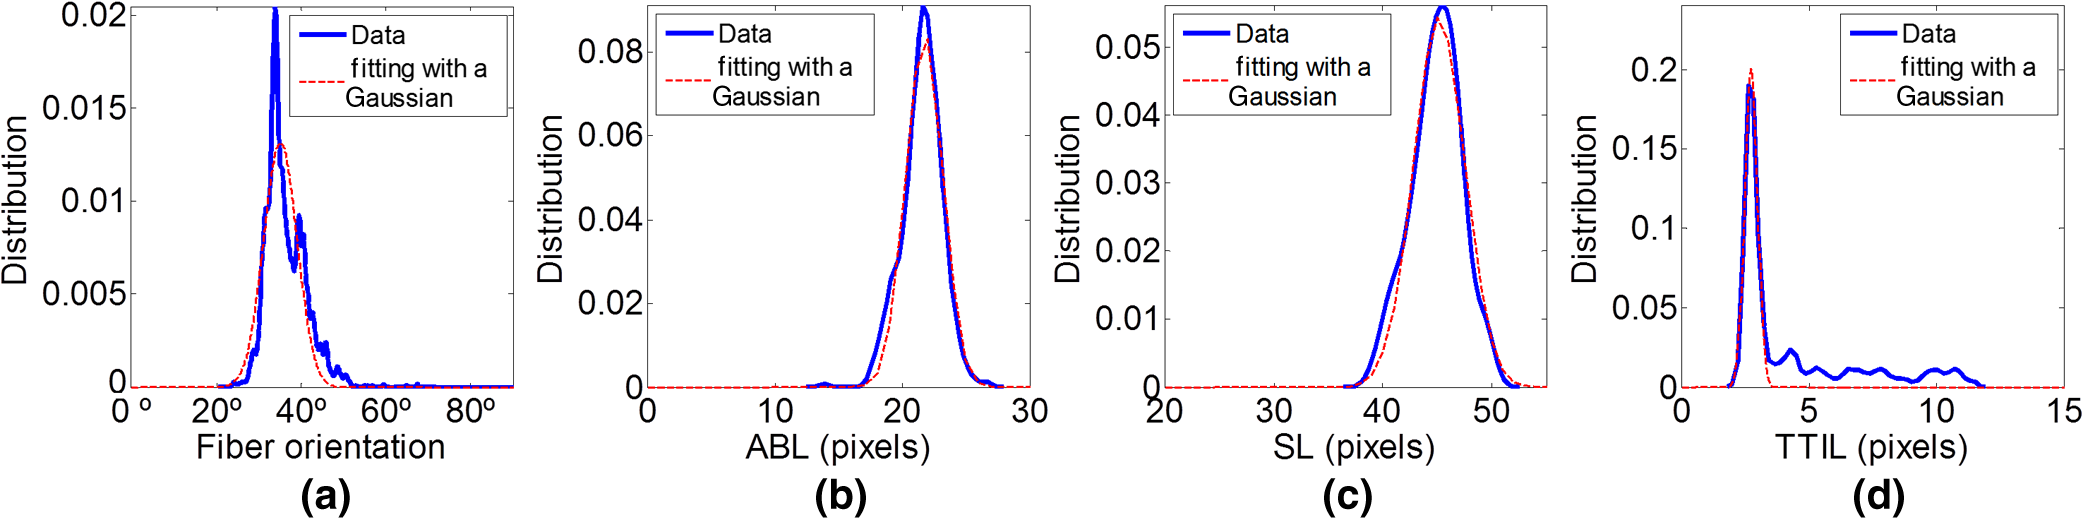
1.IntroductionSarcomeres are the elementary contractile units in cardiac and skeletal muscles and are composed of three basic structural elements as shown in Fig. 1. Two transverse structures: the -discs, anchoring the (actin) thin filaments and the -band that crosslinks the (myosin) thick filaments in the center. The elastic titin filaments connect both structures in the longitudinal plane. The interaction of sarcomere thin and thick filaments generates the force necessary for contractile function. The expression of sarcomeric proteins is well documented to respond to physiological activity or disease, making the sarcomere a prime candidate for a visible indicator of myofiber integrity.1–3 The study of sarcomere morphometry provides information about the sarcomere’s structure and function and thus about cardiac contractility.4 For this, end-diastolic sarcomere length (SL) has been widely used as a feature of sarcomere morphometry;5,6 however, reliable and automated techniques for measuring these sarcomeric features in living intact tissue are limited. Fig. 1(a) Schematic representation of the elementary parts of the sarcomere, (b) transmission electron microscopy image from a sarcomere acquired from a young adult rabbit heart using a JEM-1010 electron microscope (Jeol, Japan) equipped with a CCD camera Megaview III and the Analysis software (Soft Imaging System GmbH, 1998), at magnification, (c) ideal SHG signal intensity profile along a sarcomere, (d) SHG image of a muscle fiber, and (e) SHG intensity profile along the muscle fiber. Sarcomere length (SL) is indicated by a red arrow, intrasarcomeric A-band length (ABL) by a blue arrow and thick–thin interaction length (TTIL) by a green arrow, calculated as the full width at half maximum (FWHM) of the Gaussian and defined as , where is the width of the Gaussian.  The second harmonic generation (SHG) microscopy has shown an enormous potential for providing information with high resolution and contrast of certain unstained structures, such as collagen, myosin, microtubulin, starch, and cellulose, which are of interest for many biomedical applications.7–13 This unique contrast mechanism combined with recent technological advances in multiphoton microendoscopes/fibers14–16 and ultrashort pulse laser sources17 suggests that SHG might find clinical applications as an optical biopsy tool.9 SHG has been studied in many applications related with collagen,10,18,19 as it is a highly efficient frequency doubling biomaterial that can be detected by standard multiphoton microscopes. Myosin, a molecule present in all types of muscle, shows a smaller harmonic signal9,10,20 and has been studied less. The SHG signal along a muscle fiber presents a biperiodical pattern5,13 as shown in Figs. 1(d) and 1(e); the two periods are associated with characteristic sarcomeric lengths that provide information of the ultrastructure of the cardiac tissue.5,21,22 Particularly, the shortest period corresponds to the A-band length (ABL) and the longest period to SL (distance between -discs). Recently, the Fourier transform (FT) has been used to compute the periodicity and the preferred orientation from SHG in biological tissues,18,19 and it was demonstrated that image-processing techniques can extract quantitative information from this imaging modality. However, the generalization of this approach is limited, and there is a need to develop more automated and accurate methodologies. Recent papers have shown that the pattern analysis of striated muscle correlates with physiological functions, and this might be useful for developing tools that assist diagnosis and possibly to monitor chronic diseases.23–25 However, the pioneering work of Plotnikov et al. was related to abstract image features, providing no supportive information to clinicians and biomedical researchers. More recently, these image features have evolved toward describing more comprehensive concepts of biology that allow a multidisciplinary exchange of ideas among experts. Our prior research reported that the automated quantification of the average fiber orientation (FO), SL, and ABL in cardiac tissue was more reliably computed by means of a method based on the analysis of the autocorrelation rather than a Fourier approach.24 Another recent paper, focused on skeletal muscle tissue, developed a technique to quantify local disruption of the regular sarcomere lattice (verniers) that was associated with diseased muscle.23 These papers show that the SHG is, indeed, a promising stain-free image modality for assessing muscle and cardiac tissues because it is highly specific for myosin thick filaments and targets one of the major factors of the contractile machinery. Under some circumstances, SHG from collagen can also be found (i.e., in fibrotic or adult hearts) but this can be filtered out by different means, like postprocessing in combination with optical methods10,26 by taking advantage of the differences from the SHG generated by these two structures. Apart from that, there are no other major interference effects when detecting SHG signals from myosin in most tissues. This paper extends the prior study of our model to understand the use and the limitations of the proposed algorithm and set some of the imaging conditions required to achieve a given level of accuracy. Our goal is to evaluate the robustness of our algorithm for measuring morphometric features of cardiac tissue in SHG images. For this, we first performed numerical simulations to evaluate the performance of our methodology in one- and two-dimensional computer-generated muscle fibers, by adding different artifacts that can influence the measurements, such as noise, depth of modulation, and fiber bending and twisting. Second, automatic measurements of sarcomere ultrastructure and fiber orientation of cardiac tissue samples were compared with manual measurements. Finally, we applied our algorithm to analyze the morphometric features of cardiac tissue in a set of SHG images from fetal and adult rabbit hearts, acquired at different signal-to-noise ratios (SNRs) to evaluate the practical applications of our study in biomedical research. 2.Materials and Methods2.1.Image ProcessingThe proposed image processing algorithm is explained elsewhere in detail.24 In summary, it consists of: (1) estimation of local fiber orientation, (2) tracking of muscle fibers, (3) muscle fiber profiling, (4) correlation of muscle fibers SHG signal, and (5) model fitting and parameter extraction. Briefly, local fiber orientation is estimated by computing the local autocorrelation of small blocks of pixels, followed by direct binarization of the autocorrelation and principal component analysis. The major axis orientation of the muscle fiber is computed as the first principal component. Once the local fiber angle is estimated, the muscle fiber tracking is performed. After obtaining the intensity profile for every tracked muscle fiber, the autocorrelation is calculated and fitted with a parametric model. After the model fitting, the mean of the ultrastructure sarcomere measurements within a muscle fiber is obtained for each fiber in the image. Therefore, distributions of FO, SL, ABL, and thick–thin interaction length (TTIL) for a SHG image of cardiac tissue were the quantitative descriptors obtained as output parameters of our algorithm. Finally, the (SD) of the four features were calculated from the distributions, rejecting all the values outside the , since they were considered as outliers. 2.2.Simulation of Computer-Generated Muscle FibersThe SHG intensity signal from a sarcomere can be modeled by two Gaussian functions.5,24 In this manner, the whole cardiac muscle fiber can be defined as where corresponds to the ABL, to the SL, and to the TTIL. accounts for the illumination variation when imaging the ’th sarcomere [see Fig. 1(c)]. denotes the number of sarcomeres in the muscle fiber.Fig. 2(a) 1-D straight muscle fiber at signal-to-noise ratio (SNR) of 20 dB, (b) 2-D straight noisy fiber at SNR of 10 dB, with the and axes aligned to the long and short axes of the fiber, (c) modulating image () with a depth of modulation (DOM) of 80% (), (d) modulated image () with DOM of 80% of a 2-D straight fiber, and (e) 2-D wavy noisy fiber at SNR of 10 dB with a DOM of 80%.  Artificial cardiac muscle fibers were numerically generated, according to Eq. (1), varying the different ultrastructural morphometric features: (1) TTIL, (2) ABL, and (3) SL, in one dimension (1-D). However, this calculation skips many steps of our methodology that add error. For this, we included the two-dimensional (2-D) generation of muscle fibers, as shown in Fig. 2(b). Similarly to 1-D, the 2-D SHG signal from a sarcomere can be modeled by two 2-D Gaussians. Therefore, the whole 2-D muscle fiber can be defined as where the and axes are aligned to the long and short axes of the muscle fiber, respectively [see Fig. 2(b)]. corresponds to the TTIL and to the thickness of the muscle fiber, assumed to be , according to the estimated fiber thickness measured manually in a SHG image from cardiac tissue Fig 5(a).Also, we considered the addition of white Gaussian noise (WGN) in both 1-D and 2-D computer-generated muscle fibers, as shown in Figs. 2(a) and 2(b). Besides noise, many illumination changes occur during acquisition as a consequence of many factors like nonuniform illumination and tissue bending in and out of the focal plane. This has been modeled as a slowly varying image that modulates the image, as shown in Figs. 2(c) and 2(d). The proposed methodology is finally challenged by simulating the natural fiber bending within the 2-D plane (or fiber twisting) as shown in Fig. 2(e). Therefore, the artifacts that were modeled are: (1) addition of WGN of zero mean and a variance in 1-D and 2-D muscle fibers, (2) amplitude modulation of the SHG signal: illumination artifacts and 3-D fiber bending for 2-D data, and (3) fiber twisting: in plane fiber bending for 2-D data. The WGN power was varied to obtain an estimated SNR ranging from 0 to 50 dB. Amplitude modulation was simulated by generating a modulating image () composed of two different cosines of unitary frequency ( and ) and two cosines of frequencies and , with random amplitude and phase. With this combination of cosines, a random slow intensity variation modulating image, with a longitudinal component in the same direction as the muscle fibers, was generated. An example of a modulating image is displayed in Fig. 2(c). The modulated image () was obtained as where denotes the depth of the modulation factor, which varies from 0 to 1. Fiber twisting was modeled by varying the local orientation of each sarcomere within the muscle fiber randomly, but limiting this angular change to a maximum of 15 deg. The maximum angular change within a fiber was chosen after estimating the maximum local angle variation in SHG images from cardiac tissue [see Figs. 5(a) and 5(b)]. Muscle fibers of five sarcomeres were considered in all the simulations. The different simulated scenarios were: (1) 1-D and WGN with SNR from 0 to 50 dB; (2) 2-D and WGN with SNR from 0 to 50 dB; (3) 2-D, WGN with SNR from 0 to 50 dB, and depth of modulation with , 0.4, 0.6, and 0.8; (4) 2-D, WGN with SNR from 0 to 50 dB, fiber twisting and depth of modulation with , 0.4, 0.6, and 0.8. In total, 100 computer-generated muscle fibers with different morphometric dimensions (, , and ) were generated for each simulated scenario. The performance of the method was evaluated by computing the success rate, calculated as the ratio between the number of computer-generated fibers measured successfully, the total number of computer-generated muscle fibers, and the relationship between the experimentally estimated SNR of the signal and the ground truth using the root-mean-square error (RMSE) of the , , and values from the model of muscle fiber based on Eqs. (1) and (2). The SNR was estimated as where corresponds to the Wiener filtered image, with a window’s size of five pixels, and corresponds to the noisy image (). 2.3.Analysis of Biological SamplesFetal and adult hearts from New Zealand white rabbits were analyzed to illustrate the practical implications of our study in biomedical research. Animals were provided by a certified breeder. Animal handling and all procedures were performed in accordance to applicable regulations and guidelines and with the approval of the Animal Experimental Ethics Committee of the University of Barcelona. Hearts from these animals were obtained one day prior to birth (fetal) and seventy postnatal days (adult) following previously reported protocols.27,28 Briefly, hearts were fixed by immersion in 4% paraformaldehyde in phosphate buffered saline, for 24 h at 4°C. The tissue was then dehydrated and embedded in paraffin, and 30-μm thick transversal heart sections were cut in a microtome. Finally, sections were mounted onto silane (Sigma-Aldrich) coated thin slides. Tissue sections were deparaffinized with xylene and decreasing concentrations of ethanol (100°/96°/70°) and finally covered with Mowiol 4–88 mounting medium (Sigma-Aldrich). A Leica TCS-SP5 laser scanning spectral confocal multiphoton microscope (Leica Microsystems Heidelberg GmbH, Manheim, Germany) equipped with a near-infrared laser (Mai Tai Broad Band 710–990 nm, 120 femptosecond pulse) and a DMI6000 inverted microscope from the Advanced Optical Microscopy Unit from Scientific and Technological Centres from the University of Barcelona was used to acquire SHG images from unlabeled heart tissues. A water immersion objective (HCX IR APO L), with a numerical aperture (NA) of 0.95 and an oil immersion condenser (NA 1.40 OilS1), both from Leica Microsystems were used to acquire the SHG images. The images were sampled at a pixel size of 40 nm. Samples were identified to contain mostly cardiomyocytes and no collagen. Cardiac longitudinal fibers were oriented at 45° to maximize SNR of SHG from muscle fibers. The image size was . First, manual measurements of sarcomere morphometry and local muscle fiber orientations were performed in 30 different regions within the SHG image of cardiac tissue acquired at high SNR. Moreover, the automatic measurement of the muscle fiber morphometry was performed in the same image, and both manual and automatic measurements were compared by calculating the . Finally, we evaluated the automatic measurement of muscle fiber morphometric features (SL, ABL, TTIL, and FO) in cardiac tissue, in two sets of 10 images each, acquired at two different SNRs by calculating for each image the of each of the four features. 3.Results3.1.Robustness Analysis with Numerical SimulationsThe computed success rate in retrieving measurements from computer-generated 1-D muscle fibers is above 90% at 15 dB and RMSE of SL, ABL, and TTIL is below one pixel for all three measurements at SNR of 7 dB [see Figs. 3(a) and 3(b)]. In the case of computer-generated 2-D muscle fibers, the computed success rate is above 90% also at 15 dB. Additionally, the computed RMSE of SL, ABL, and TTIL is below one pixel for all three measurements at a SNR of 15 dB [see Figs. 3(c) and 3(d)]. Fig. 3(a) Success rate and (b) root-mean-square error (RMSE) of thick–thin interaction length (TTIL), A-band length (ABL) and sarcomere length (SL) at different SNRs for 1-D straight muscle fiber; (c) success rate and (d) RMSE of TTIL, ABL, and SL at different SNRs for 2-D straight muscle fiber; (e) success rate and (f) RMSE of TTIL, ABL, and SL at different SNRs for 2-D straight muscle fibers with a depth of modulation (DOM) of 40% and (g) success rate and (h) RMSE of TTIL, ABL, and SL at different SNRs for 2-D twisted muscle fibers with a DOM of 40%.  Results with a depth of modulation of 40% show already an effect at SNR below 15 dBs, and in this context the RMSE is almost doubled [see Figs. 3(e) and 3(f)]. However, at a SNR of 15 dBs the RMSE is still below 1 pixel. Higher depth of modulation shows increased errors but beyond 17 dB the RMSE is always maintained below 1 pixel and the success rate is above 90%. The results of the natural fiber bending within the 2-D plane simulation in combination with all the prior artifacts show that, with a depth of modulation of 40%, a SNR of 20 dB should produce an error below one pixel [see Figs. 3(g) and 3(h)]. Finally, in order to illustrate the effect of WGN together with the other artifacts on the average and variability of the measurements, real SLs were plotted against the corresponding estimated value in Fig. 4, at three different SNRs: 12, 17, and 20 dB and for each of the four simulated scenarios: 1-D, 2-D, 2-D with a depth of modulation of 40% and 2-D with twisted fibers and a depth of modulation of 40%. Fig. 4Real values of the SL of the simulated computer-generated muscle fibers plotted against the corresponding estimated values, and for the four different simulated scenarios and at three different SNRs; (a)–(c): 1-D at (a) , (b) 17 dB and (c) 20 dB; (d)–(f): 2-D at (d) , (e) 17 dB and (f) 20 dB; (g)–(i) 2-D + depth of modulation (DOM) of 40% at (g) , (h) 17 dB and (i) 20 dB; and (j)–(l): 2-D + fiber twisting + DOM of 40% at (j) , (k) 17 dB and (l) 20 dB. CI denotes confidence interval. The blue line corresponds to the linear fitting with the function .  3.2.Manual Versus Automatic Quantification of Muscle FibersThe automatic measurement of sarcomere ultrastructure shows excellent agreement with 30 manual delineations in different regions of the image shown in Fig. 5(a), and it offers a similar uncertainty as shown in Table 1. The absolute difference between manual and automated measurements was less than one pixel for two of the morphometric features (ABL and SL). TTIL was not measurable manually. The measurement of local fiber orientation also shows excellent agreement with the manual delineations of different image regions as shown in Table 1. An example of a local fiber orientation estimation is shown in Figs. 5(b), 5(c) and 5(d), which also illustrates the good performance of the algorithm in computing the local fiber angle. Finally, the distributions of FO, SL, ABL, and TTIL for the same SHG cardiac tissue sample shown in Fig. 5(a) are plotted in Fig. 6 to illustrate the output of our algorithm. Fig. 5(a) Original standard SHG image acquired with a resolution of and a SNR of 25.66 dB, (b) local fiber orientation estimation. Color wheel represents angles between 0 and 180 deg, (c) zoom in of postprocessed image. Manual delineation of local fiber angle is plot in a red line, (d) distribution of angles within the delineated red line. 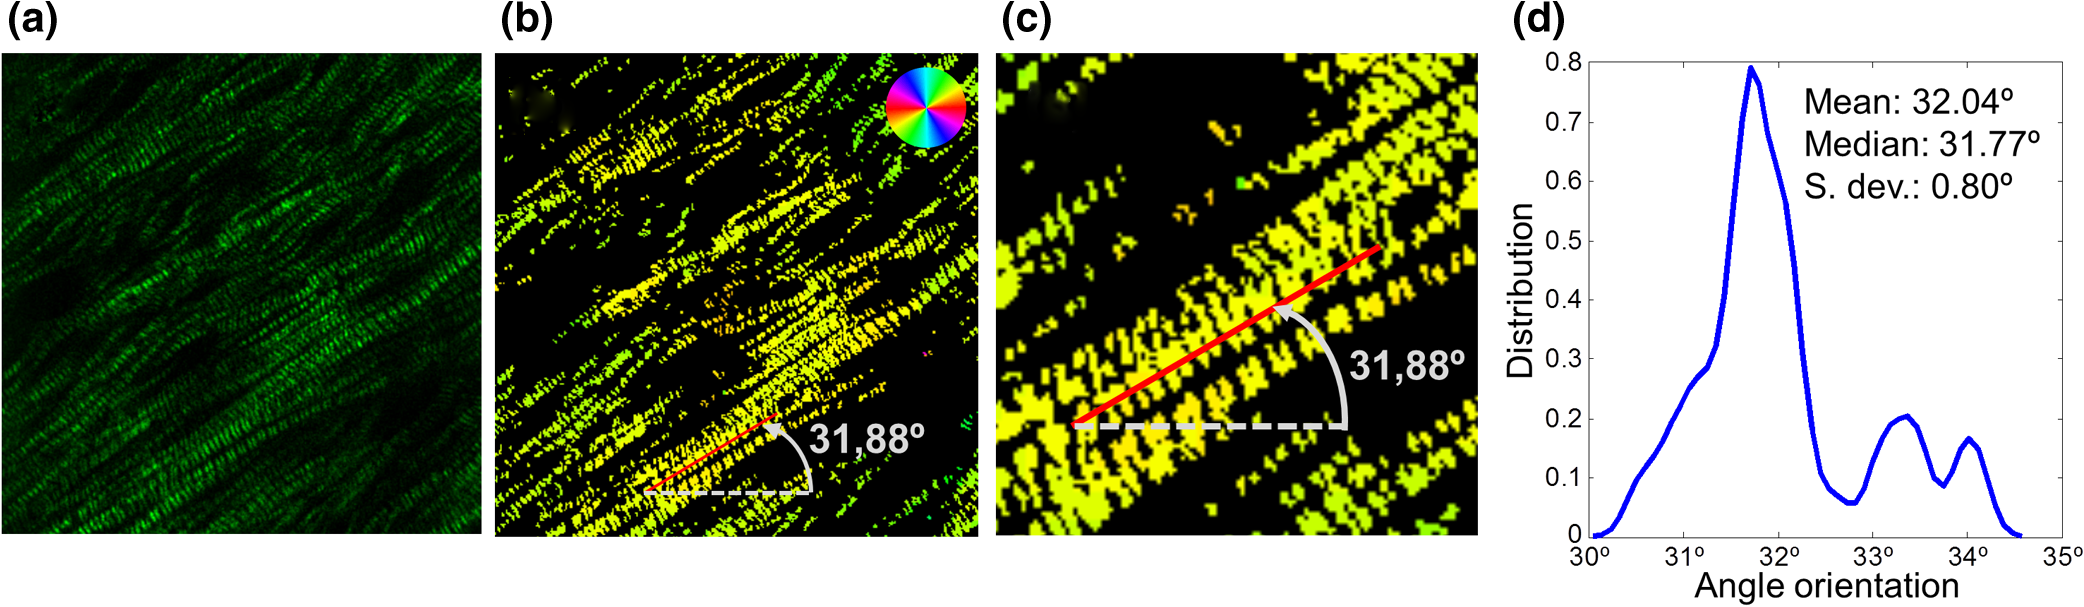 Table 1Comparison of muscle fibers morphometric measurements (mean±standard deviation) calculated with our algorithm against manual measurements in thirty different regions within the same image.
3.3.Quantification of Sarcomeres at Different Signal-to-Noise Ratios and StatusWe show, in this section, the results comparing images from an animal model at two different SNRs. SNR was estimated after the image acquisition. The estimated SNR of the first set of images corresponding to young adult rabbit cardiac tissue was . The estimated SNR of the second set of images corresponding to fetal rabbit cardiac tissue was . The mean and SD of the four morphometric features measured automatically are shown in Table 2. The estimated depth of modulation for the set of images from fetal rabbit hearts was 0.88 and 0.59 for the set of images from young adult rabbit hearts. Two representative images from both sets of SHG images are displayed in Fig. 7. It can be appreciated that the fetal cardiac muscle fibers are more twisted compared to the young adults. Also, it can be observed the higher depth of modulation in the image corresponding to fetal cardiac tissue. The higher influence of both artifacts and also the lower SNR in the set of fetal cardiac tissue images account for the higher variability obtained in the measurements of the muscle fibers morphometry. Table 2Results of the automatic measurement of muscle fibers morphometry in two sets of ten images acquired at different SNRs. For each image, the mean±standard deviation (SD) of the four morphometric features and of the SNR was computed, and it is reported here the average of the mean and of the SD for all the images.
4.DiscussionIn the present paper, we have shown the good performance of our methodology to assess morphometric features of cardiac fibers in SHG images of cardiac tissue. Many times, sample preparation, storage, microscope alignment, maintenance, and other issues related to image acquisition limit the quality of the tissue and the delivered images for the analysis. For this reason, we analyzed the performance of our method by including numerical simulations in 1-D and 2-D computer-generated muscle fibers. We modeled different artifacts that are present during the image acquisition process, including noise, depth of modulation, fiber bending, or twisting. The best performance of the system is found at 20 dB as it obtains a high success rate (above 90%) and high accuracy (RMSE below one pixel of 40 nm). The manual validation performed on a subset of images enables us to ensure the good performance of our method at high SNR values (above 20 dB). In this context, we propose our methodology to extract quantitative image features from SHG microscopy to characterize cardiac tissue in the form of distributions of FO, SL, ABL, and TTIL as shown in Fig. 6. These features are highly reproducible because they are related to ultrastructural morphology of the tissue and are not purely based on local signal ratios. The average value of FO is certainly arbitrary, but its distribution or standard deviation is related to fiber disruption, and this is related to muscle atrophy.23 End-diastolic SL is widely used as a feature of sarcomere morphometry,5,6 however, reliable and automated techniques for measuring these sarcomeric distances in living intact tissue are limited. Similarly, ABL and TTIL should also provide valuable information about the cardiac status, but they are submicron structures, which are highly difficult and tedious measurements to be performed manually, and thus there are no studies using them. Systematic analysis with our methodology provides an objective manner to quantify numerous unstained histological sections of cardiac tissue (or muscle tissue) that is not available by other means. The representation of the cardiac tissue in the form of four distributions offers a way to compare many samples and look for statistical differences within large datasets. Furthermore, statistical means can be used to reject spurious results that might occur at the tails of the distributions. The condition of a minimum SNR of 20 dB is very strict and is recommended when studying small groups of subjects to obtain reliable conclusions. Automated analysis of real images of animals at different SNRs provided evidence that for a particular experiment, with similar conditions, concerns on the SNR can be reduced, as the averaging among many samples will converge to the right measurement. Also, the variability obtained in the automated analysis of both sets of real images is consistent with the expected variability obtained in the numerical simulations of computer-generated fibers. For example, according to the simulation results, the 95% confidence interval (CI) for the SL measurement in twisted fibers with a depth of modulation of 60% and with a SNR of 20 dB is (data not shown), and the SD for the SL measurements in real SHG images from young adult cardiac tissue was . On the other hand, the 95% CI for the SL measurement in twisted fibers with a depth of modulation of 80% and with a SNR of 17 dB is (data not shown), and the SD for the SL measurements in real images from fetal rabbit cardiac tissue was , which means a 95% CI of . These results reflect the good performance of our algorithm in measuring the morphometry of cardiac muscle fibers in SHG images and also how the numerical simulations can help us to improve the design of our experiments and also the posterior analysis by addressing some types of corrections like image exclusion, bias correction, or image re-acquisition when possible. Developments in this direction aim to bring together recent advances in biophotonics to clinical applications as this makes it possible to reproduce experiments objectively, many times and in different locations, as well as setting the new advances to develop robust image processing tools that extract relevant information for biomedical researchers and clinically driven applications. Additionally, our methodology was used to evaluate sarcomere ultrastructural differences in a control/case study of human fetuses, and reporting shorter cardiac sarcomere length in fetuses with intrauterine growth restriction.28 To conclude, our approach based on automated autocorrelation analysis shows similar results to manual delineations and is a robust technique providing a sufficient SNR in the images. We have evaluated the impact of noise, amplitude modulation, and fiber twisting, and minimal errors are found for images beyond 20 dB, which is a realistic amount for automated histology analysis. We further supported our numerical results of computer-generated data with real experiments based on two different acquisition conditions. Finally, the results showed that our technique for measuring the sarcomere distances is accurate and allows us to reproduce changes previously described, concerning changes in the SL under pathological conditions.29–31 AcknowledgmentsThe authors acknowledge the cvRemod project under the CENIT 20092012 program of the Industrial and Technological Development Center (CDTI). This study was partially supported by grants from Instituto de Salud Carlos III and Ministerio de Economia y Competitividad (Ref. PI11/00051, PI11/01709, PI12/00801, and SAF2012-37196), Fondo Europeo de Desarrollo Regional de la Unión Europea “Una manera de hacer Europa,” Spain; Obra Social ‘La Caixa,’ Spain; the Fundación Mutua Madrileña; Fundació Agrupació Mutua; Cerebra Foundation for the Brain Injured Child (Carmarthen, Wales, UK); and the Seventh Framework Programme (FP7/2007-2013) under Grant No. 611823. P.G.C. was supported by the Programa de Ayudas Predoctorales de Formación en investigación en Salud (FI12/00362) from the Instituto Carlos III, and A.G.T. was supported by IDIBAPS Predoctoral Programme. We thank Anna Bosch and Dr. Maria Calvo from the Advanced Optical Microscopy Unit from Scientific and Technological Centres from University of Barcelona for their support and advice with second harmonic generation techniques. ReferencesC. G. BonnemannN. G. Laing,
“Myopathies resulting from mutations in sarcomeric proteins,”
Curr. Opin. Neurol., 17
(5), 529
–537
(2004). http://dx.doi.org/10.1097/00019052-200410000-00003 CONEEX 1350-7540 Google Scholar
Y. Chenget al.,
“Impaired contractile function due to decreased cardiac myosin binding protein C content in the sarcomere,”
Am. J. Physiol. Heart Circ. Physiol., 305
(1), H52
–H65
(2013). http://dx.doi.org/10.1152/ajpheart.00929.2012 0363-6135 Google Scholar
J. R. Patelet al.,
“Magnitude of length-dependent changes in contractile properties varies with titin isoform in rat ventricles,”
Am. J. Physiol. Heart Circ. Physiol., 302
(3), H697
–H708
(2012). http://dx.doi.org/10.1152/ajpheart.00800.2011 0363-6135 Google Scholar
N. Fukudaet al.,
“Length dependence of tension generation in rat skinned cardiac muscle: role of titin in the Frank-Starling mechanism of the heart,”
Circulation, 104
(14), 1639
–1645
(2001). http://dx.doi.org/10.1161/hc3901.095898 CIRCAZ 0009-7322 Google Scholar
T. Boulesteixet al.,
“Second-harmonic microscopy of unstained living cardiac myocytes: measurements of sarcomere length with 20-nm accuracy,”
Opt. Lett., 29
(17), 2031
–2033
(2004). http://dx.doi.org/10.1364/OL.29.002031 OPLEDP 0146-9592 Google Scholar
G. Bubet al.,
“Measurement and analysis of sarcomere length in rat cardiomyocytes in situ and in vitro,”
Am. J. Physiol. Heart Circ. Physiol., 298
(5), H1616
–H1625
(2010). http://dx.doi.org/10.1152/ajpheart.00481.2009 0363-6135 Google Scholar
P. Campagnola,
“Second harmonic generation imaging microscopy: applications to diseases diagnostics,”
Anal. Chem., 83
(9), 3224
–3231
(2011). http://dx.doi.org/10.1021/ac1032325 ANCHAM 0003-2700 Google Scholar
P. J. Campagnolaet al.,
“Second-harmonic imaging microscopy of living cells,”
J. Biomed. Opt., 6
(3), 277
–286
(2001). http://dx.doi.org/10.1117/1.1383294 JBOPFO 1083-3668 Google Scholar
P. J. Campagnolaet al.,
“Three-dimensional high-resolution second-harmonic generation imaging of endogenous structural proteins in biological tissues,”
Biophy. J., 82
(1 Pt 1), 493
–508
(2002). http://dx.doi.org/10.1016/S0006-3495(02)75414-3 BIOJAU 0006-3495 Google Scholar
C. Odinet al.,
“Collagen and myosin characterization by orientation field second harmonic microscopy,”
Opt. Express, 16
(20), 16151
–16165
(2008). http://dx.doi.org/10.1364/OE.16.016151 OPEXFF 1094-4087 Google Scholar
S. J. Wallaceet al.,
“Second-harmonic generation and two-photon-excited autofluorescence microscopy of cardiomyocytes: quantification of cell volume and myosin filaments,”
J. Biomed. Opt., 13
(6), 064018
(2008). http://dx.doi.org/10.1117/1.3027970 JBOPFO 1083-3668 Google Scholar
M. Bothet al.,
“Second harmonic imaging of intrinsic signals in muscle fibers in situ,”
J. Biomed. Opt., 9
(5), 882
–892
(2004). http://dx.doi.org/10.1117/1.1783354 JBOPFO 1083-3668 Google Scholar
S. V. Plotnikovet al.,
“Characterization of the myosin-based source for second-harmonic generation from muscle sarcomeres,”
Biophys. J., 90
(2), 693
–703
(2006). http://dx.doi.org/10.1529/biophysj.105.071555 BIOJAU 0006-3495 Google Scholar
H. Baoet al.,
“Second harmonic generation imaging via nonlinear endomicroscopy,”
Opt. Express, 18
(2), 1255
–1260
(2010). http://dx.doi.org/10.1364/OE.18.001255 OPEXFF 1094-4087 Google Scholar
L. FuM. Gu,
“Polarization anisotropy in fiber-optic second harmonic generation microscopy,”
Opt. Express, 16
(7), 5000
–5006
(2008). http://dx.doi.org/10.1364/OE.16.005000 OPEXFF 1094-4087 Google Scholar
M. E. Llewellynet al.,
“Minimally invasive high-speed imaging of sarcomere contractile dynamics in mice and humans,”
Nature, 454
(7205), 784
–788
(2008). NATUAS 0028-0836 Google Scholar
E. U. RafailovM. A. CatalunaW. Sibbett,
“Mode-locked quantum-dot lasers,”
Nat. Photon., 1
(7), 395
–401
(2007). http://dx.doi.org/10.1038/nphoton.2007.120 1749-4885 Google Scholar
R. A. RaoM. R. MehtaK. C. Toussaint Jr.,
“Fourier transform-second-harmonic generation imaging of biological tissues,”
Opt. Express, 17
(17), 14534
–14542
(2009). http://dx.doi.org/10.1364/OE.17.014534 OPEXFF 1094-4087 Google Scholar
M. Sivaguruet al.,
“Quantitative analysis of collagen fiber organization in injured tendons using Fourier transform-second harmonic generation imaging,”
Opt. Express, 18
(24), 24983
–24993
(2010). http://dx.doi.org/10.1364/OE.18.024983 OPEXFF 1094-4087 Google Scholar
V. Nucciottiet al.,
“Probing myosin structural conformation in vivo by second-harmonic generation microscopy,”
PNAS, 107
(17), 7763
–7768
(2010). http://dx.doi.org/10.1073/pnas.0914782107 Google Scholar
H. Liuet al.,
“Myosin filament assembly onto myofibrils in live neonatal cardiomyocytes observed by TPEF-SHG microscopy,”
Cardiovas. Res., 97
(2), 262
–270
(2013). http://dx.doi.org/10.1093/cvr/cvs328 CVREAU 0008-6363 Google Scholar
G. Recheret al.,
“Three distinct sarcomeric patterns of skeletal muscle revealed by SHG and TPEF microscopy,”
Opt. Express, 17
(22), 19763
–19777
(2009). http://dx.doi.org/10.1364/OE.17.019763 OPEXFF 1094-4087 Google Scholar
C. S. Garbeet al.,
“Automated multiscale morphometry of muscle disease from second harmonic generation microscopy using tensor-based image processing,”
IEEE Trans. Biomed. Eng., 59
(1), 39
–44
(2012). http://dx.doi.org/10.1109/TBME.2011.2167325 IEBEAX 0018-9294 Google Scholar
P. Garcia-Canadillaet al.,
“Automated morphometric characterization of cardiac fibers by second harmonic microsocopy imaging,”
in Proc. 8th IEEE International Symposium on Biomedical Imaging: from Nano to Macro,
1379
–1382
(2011). Google Scholar
S. V. Plotnikovet al.,
“Measurement of muscle disease by quantitative second-harmonic generation imaging,”
J. Biomed. Opt., 13
(4), 044018
(2008). http://dx.doi.org/10.1117/1.2967536 JBOPFO 1083-3668 Google Scholar
S. Psilodimitrakopouloset al.,
“Quantitative discrimination between endogenous SHG sources in mammalian tissue, based on their polarization response,”
Opt. Express, 17
(12), 10168
–10176
(2009). http://dx.doi.org/10.1364/OE.17.010168 OPEXFF 1094-4087 Google Scholar
A. Gonzalez-Tenderoet al.,
“Intrauterine growth restriction is associated with cardiac ultrastructural and gene expression changes related to the energetic metabolism in a rabbit model,”
Am. Journal. Physiol. Heart Circ. Physiol., 305
(12), H1752
–H1760
(2013). http://dx.doi.org/10.1152/ajpheart.00514.2013 0363-6135 Google Scholar
J. I. Iruretagoyenaet al.,
“Cardiac dysfunction is associated with altered sarcomere ultrastructure in intrauterine growth restriction,”
Am. J. Obstet. Gynecol.,
(2014). http://dx.doi.org/10.1016/j.ajog.2014.01.023 AJOGAH 0002-9378 Google Scholar
P. G. AndersonS. P. BishopS. B. Digerness,
“Transmural progression of morphologic changes during ischemic contracture and reperfusion in the normal and hypertrophied rat heart,”
Am. J. Pathol., 129
(1), 152
–167
(1987). AJPAA4 0002-9440 Google Scholar
J. F. Chenet al.,
“Targeted deletion of Dicer in the heart leads to dilated cardiomyopathy and heart failure,”
PNAS, 105
(6), 2111
–2116
(2008). http://dx.doi.org/10.1073/pnas.0710228105 Google Scholar
M. H. Radkeet al.,
“Targeted deletion of titin N2B region leads to diastolic dysfunction and cardiac atrophy,”
PNAS, 104
(9), 3444
–3449
(2007). http://dx.doi.org/10.1073/pnas.0608543104 Google Scholar
|
||||||||||||||||||||||||||||||||||||||||||||||||||