|
|
1.IntroductionTobacco abuse is the leading cause of premature death worldwide. As per World Health Organization reports, about 4.9 million deaths were estimated due to tobacco-related illness in 2000, and by 2020 it is predicted to rise to 10 million deaths per year. Harmful effects of tobacco can be attributed to a variety of cancers, including those of the lung, oral cavity, nasal cavity, larynx, oropharynx, hypopharynx, oesophagus, stomach, liver, pancreas, bladder, ureter, kidney, and cervix. Tobacco carcinogenicity is more than evident, and about 50% of oral cancer cases are attributable to chewing and smoking of tobacco.1,2 Exposure of oral cavity tissues to the carcinogens such as polynuclear aromatic hydrocarbons present in tobacco, during smoking, and tobacco-specific nitrosamines during chewing results in malignant changes. Tobacco abuse, either smoking or chewing with alcoholism or areca nut chewing, further increases the risk of oral cancer. Acetaldehyde production due to ethanol oxidization and reactive oxygen species generation due to auto-oxidation of polyphenols in areca nut also increase the chances of malignancy.1–4 In South and Southeast Asia, especially countries such as India, Pakistan, and Sri Lanka where one-fifth of the world population exists, incidence of oral cancer is devastating. Abuse of tobacco in the form of both chewing and smoking is termed as the prime reason for higher incidence in these areas. Lack of awareness and cultural traditions are the main causatives. Moreover, people who are in the lower socio-economic background are the main prey of this disease. Unavailability of extensive diagnosis facilities makes this disease more severe.5,6 Histopathology followed by scalpel or punch biopsy is the gold standard for oral cancer screening.7 But this technique based on the changes in tissue pathology most often fails to provide the exact diagnosis.8 Moreover, by the time the patient reaches the clinic, the disease would have progressed to a stage that can be visibly identified by the clinician. There is no medical demand in diagnosing such a lesion that is easily visible by the naked eye. In order to avoid this delay in diagnosis and also for an effective early diagnosis, bedside optical diagnosis techniques are in more demand. Moreover, these techniques are capable of detecting early-stage biochemical alterations within the tissue in a minimally invasive or noninvasive way.9–18 Fluorescence, infrared, Raman, and diffuse reflectance spectroscopy are the emerging in vivo optical diagnosis tools in medical oncology.10–18 Among these, in vivo fluorescence spectroscopy is widely used for oral cancer diagnosis because of its simplicity to use, less time consumed, and improved patient comfort level.13–15 In this study, we present variation in autofluorescence spectra from the oral mucosa of habitual tobacco users with that of a group of volunteers without any habits in a clinical setup. We have also considered a group of patients with leukoplakia. This group is included to demonstrate the harmful effects of tobacco in the oral mucosa among the habitual tobacco users. Leukoplakia is a potentially malignant disease with potentiality greater than 30%. This disease is six times more common among habitual tobacco users than nonusers.19 In the Indian subcontinent, incidence of oral leukoplakia is three times higher than in the Western population. Smoking and chewing of areca nut with tobacco cause this high incidence.20 To strengthen the spectral observations in assessing the variation caused by habits associated with tobacco, quantification of hemoglobin concentration and porphyrin levels was performed. Feasibility of using a single system to analyze the changes in fluorophores and chromophores within the tissue was done using the spectral filtering modulation (SFM) effect on the fluorescence spectra due to hemoglobin absorption.18,21 Principal component analysis followed by linear discriminant analysis (PCA-LDA) is used for the exact differentiation of spectra among the groups and to obtain the performance level of the clinical trial. 2.Materials and Methods2.1.Study Population and ProtocolsThe study subjects included 30 volunteers without any habits (nonhabitués), 30 volunteers with habits (habitués), and 18 clinically diagnosed leukoplakia patients. The patient selection was done by an experienced oral oncologist based on the clinical manifestation of leukoplakia in this group. The other two groups had no history of oral cavity diseases and none of them was taking any medications. The subjects who had any tobacco-based habits were excluded from the nonhabitués group. The procedure was explained and informed consent was obtained from all patients and volunteers who participated in this study. Age, sex, and details of oral habits of habitués and leukoplakia patients were recorded. The details of leukoplakia patients such as age, gender, duration, and frequency of tobacco chewing, smoking and alcoholism, and pathological grading are given in Table 1. Age of nonhabitués ranged from 20 to 52 years (16 men and 14 women) and that of habitués ranged from 23 to 67 years (18 men and 12 women). Habitués and leukoplakia patients involved in this study had prolonged tobacco chewing habits with smoking or alcoholism or both together. They were using either betel quid with tobacco or khaini (powdered form of tobacco) available in packets for chewing. Healthy volunteers involved in this study were free from such habits and maintained good oral health and hygiene. Before spectral acquisition, all volunteers and patients were asked to clean their mouth using 1.5% saline solution for 2 to 3 min in order to reduce the effects of recently consumed food. Table 1Clinical report of leukoplakia patients involved in this study.
Note: N, nil; O, occasionally; MD, mild dysplasia; EH, epithelial hyperplasia. In the case of nonhabitués and habitués, spectral measurements were obtained from different anatomical sites of the oral cavity such as right and left buccal mucosa, palate, and floor of the mouth. Spectra from a total of 22 sites with suspicious lesions were acquired from 18 leukoplakia patients. An experienced clinical oral oncologist identified suspicious lesions in each leukoplakia patient for spectral studies. Since there are reports highlighting the distortion of autofluorescence emission of porphyrin due to bacterial colonization in the tongue, we have excluded spectra of the tongue from this study. 2.2.Fluorescence Spectroscopic StudyThe optical spectroscopic measurements were carried out using the spectroflurometer (Fluorolog-III; Jobin Yvon Inc., Edison, New Jersey). The instrument consists of a 450-W Xenon arc lamp, a double excitation monochromator, a double emission monochromator, and a photomultiplier tube. A bifuricated Y type fiber-optic probe is coupled to the sample compartment to enable in vivo measurements. This multimode fiber-optic probe consists of illumination fibers and collection fibers. All fibers have a numerical aperture of 0.22. One arm of the Y type fiber-optic probe was connected to the source. The desired excitation wavelength was selected and the light transmitted to the tissue site through this arm. The received fluorescence signal was directed back to the spectrometer through the other arm. A transparent test tube (Borosil) was used to cover the distal end of the Y type fiber-optic probe in order to avoid contamination. To compensate for the changes made by the test tube, a correction factor was uniformly applied to all spectra. The test tube was cleaned and disinfected with 2% glutaraldehyde solution after each spectral acquisition. The experimental setup is illustrated in Fig. 1. The excitation wavelength of 410 nm is selected using Datamax™ software (Datamax, Round Rock, Texas). The emission spectrum was recorded in the range of 455 to 750 nm in 1-nm increments. During spectral acquisition, care has been taken to maintain a uniform pressure applied at the tip of the probe for all the cases. 2.3.Data Processing and Analysis2.3.1.Processing of spectraAll spectra were baseline corrected and the data values extracted using Datamax™. Spectra were normalized with respect to the maximum intensity of the peak at . From the normalized data, the peak intensity at the wavelengths of 500, 560, 570, and 635 nm was extracted. 2.3.2.Estimation of total hemoglobin concentrationThe ratio of fluorescence intensity at 500 and 570 nm was used to estimate the concentration of total hemoglobin as per the method of Liu and Vo-Dinh.21 These specific emission intensities were chosen because the extinction coefficients of oxygenated and deoxygenated hemoglobin at these two wavelengths are equal. Hence, it is theoretically and experimentally proved that the ratio between fluorescence intensity at these two wavelengths will give the total hemoglobin concentration within the tissue. Total hemoglobin concentration of brain tissues has been reported earlier by the same method.18 2.3.3.Multivariate statistical analysisPCA-LDA is a dimension reduction way of classification. In this study, we have used PCA to reduce the high dimension of fluorescence spectral data (455 to 750 nm with a set of 295 intensities) which may cause computational complexity in the optimization and implementation of LDA.16 PCA on the normalized spectra of each category was performed using SPSS-17 (SPSS Inc., Chicago, Illinois). The objective of dimension reduction in PCA was to achieve more compact representation of the original data that capture the information essential for higher-level decision making. In PCA, dimension reduction is performed by processing the number of competitiveness indicators into a small number of independent indicators through transforming the internal structure of correlation matrix into a specified number in the original indicator variables.22 In order to reduce the dimension of the spectral data, we have used PCA to extract a set of orthogonal PCs comprising loadings and scores that account for the maximum variance in spectral datasets.23 These loadings and scores of the PCA model provide a reduced dataset which is a compact replica of the spectroscopic data. These significant PC scores () were selected as input for the LDA model for oral cavity tissue classification. LDA determines the discriminant function that maximizes the variances in the dataset between groups while minimizing the variances between members of the same group. The performance of the diagnostic algorithms based on LDA models to predict the tissue groups was estimated by leave-one-tissue-site-out, cross-validation method. This method of cross-validation produces a confusion matrix that compares predicted versus actual group membership.16 Diagnostic sensitivity and specificity of autofluroscence spectroscopy technique for oral tissue differentiation were assessed using these classification results based on PCA-LDA models. 3.Results3.1.Fluorescence Spectral FeaturesAveraged fluorescence spectra from different sites of nonhabitués, habitués, and suspected sites of leukoplakia patients are given in Fig. 2. The spectra show the major peaks around 500, 560, 635, and 690 nm. One-way analysis of variance (ANOVA) on peak intensity at 560 and 635 nm obtained for different sites of nonhabitués, habitués, and suspected sites of leukoplakia patients are given in Table 2. Fig. 2Average fluorescence emission spectra from different anatomical sites of nonhabitués, habitués, and suspected sites of leukoplakia patients: (a) floor of the mouth, (b) left buccal mucosa, (c) right buccal mucosa, and (d) palate.  Table 2One-way analysis of variance values on peak intensities and total hemoglobin concentration (p<0.05 is given in bold letters).
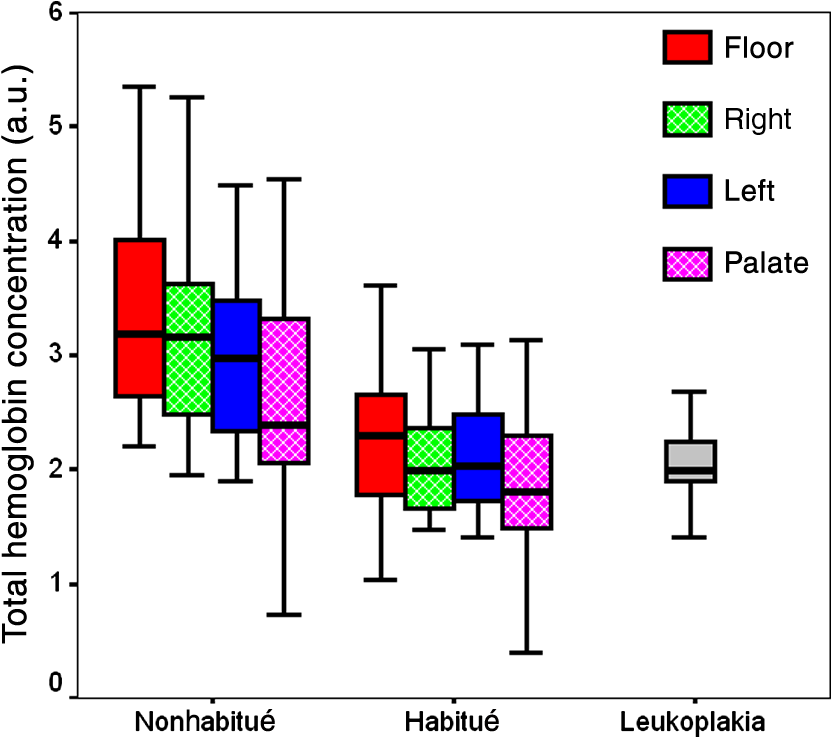
When the spectra of nonhabitués to habitués to leukoplakia are considered, a clear and gradual increase in intensity but decrease in spectral resolution of 560-nm peak is observed. The peak intensity varied significantly () for nonhabitué versus habitués and nonhabitués versus leukoplakia for all the sites. But for habitués versus leukoplakia, there is no significant difference in the peak intensity for any of the sites. The 635-nm peak is more prominent in habitués and leukoplakia than nonhabitués. Significant difference () in peak intensity is observed for left and right buccal mucosa when nonhabitués versus habitués and nonhabitués versus leukoplakia are considered. For habitués and leukoplakia, the peak intensity is found to be nearly the same with no significant change. The peak around 690 nm has nearly the same intensity for all groups considered irrespective of the site. 3.2.Estimation of Total Hemoglobin ConcentrationTotal hemoglobin concentration observed for nonhabitués, habitués, and leukoplakia patients are given in a box plot (Fig. 3). Considerable decrease in the total hemoglobin concentration is observed for habitués and leukoplakia patients from that of nonhabitués. Total hemoglobin concentrations observed for habitués and leukoplakia patients are found to be nearly equal. One-way ANOVA on total hemoglobin concentration obtained for different sites of nonhabitués, habitués, and suspected sites of leukoplakia patients are given in Table 2. A statistically significant difference () in the total hemoglobin concentration was observed between nonhabitués and habitués and nonhabitués and leukoplakia irrespective of the sites. But the difference between habitués and leukoplakia was found to be insignificant. 3.3.Multivariate AnalysisTo strengthen the accuracy of spectral measurement-based tissue classification, multivariate analysis, PCA-LDA was employed. PCA was first performed on spectra acquired from each site of all groups for understanding the critical spectral features of autofluorescence spectra as well as for looking at the group behavior of the oral cavity tissue. Figure 4 shows the PC score plot of autofluroscence spectral analysis of the four different sites of oral cavity of nonhabitués, habitués, and leukoplakia. The first three PCs are plotted along -, -, and -axes. Apart from that of palate, the PC scores of other sites tend to cluster and at the same time remain fairly separated from other classes. Among these, leukoplakia appears to be the easiest to distinguish based on the distance from the nonhabitués and habitués. This provides a new outlook to the tissue–tissue intraclass variations. Even though PCA is a valuable tool for characterizing similarities between tissue types, due to its unsupervised nature, it does not automatically provide class memberships. To assign class membership to these site-specific spectra, we have adopted the method of LDA. Fig. 4PC score plot of the first three principal components for the spectral dataset acquired from different anatomical sites of nonhabitués, habitués, and suspected sites of leukoplakia patients: (a) floor of the mouth, (b) left buccal mucosa, (c) right buccal mucosa, and (d) palate.  A discriminant function scatter plot for the sites floor of the mouth, left and right buccal mucosa, and palate is given in Fig. 5. The first two discriminant functions are plotted along - and -axes. Group averages are represented by centroids. The distances between these centroids are found to be nearly equal for all the sites. Classification based on the variation in this Mahalanobis distance is a multivariate measure of separation between groups. The sample is classified into the group from which it has shorter Mahalanobis distance. Figure 6 shows the pairwise discriminant score for all the sites considered in this study. Discrimination line drawn at 0 gives a good separation. Positive and negative predictive values were obtained using this position of pairwise discriminant score. These values are used for binary calculations in order to obtain the performance level of PCA-LDA, and the results are given in Table 3. Fig. 5Linear discriminant analysis (LDA) score plots of the fluorescence dataset. (a) Floor of the mouth, (b) left buccal mucosa, (c) right buccal mucosa, and (d) palate.  Fig. 6Pairwise discriminant score plot based on discriminant function for the pairs nonhabitué versus habitué, nonhabitué versus leukoplakia, and habitué versus leukoplakia for anatomical sites: (a) floor of the mouth, (b) left buccal mucosa, (c) right buccal mucosa, and (d) palate.  Table 3Overall diagnostic accuracies obtained for the discrimination of nonhabitués, habitués, and leukoplakia using PCA-LDA.
Note: Sensitivity (Se)=true positive/(true positive+false negative). Specificity (Sp)=true negative/(true negative+false positive). 4.DiscussionThe extent and nature of structural and biochemical changes that take place during the transformation from normal to precancerous state due to lifestyle oral habits are poorly understood. These changes can lead to cancer in the oral cavity. Although there are many reports on the use of fluorescence spectroscopy in differentiating normal from cancerous oral mucosa, early tissue transformation stages due to tobacco-associated habits has not been investigated in detail. In this study, we have attempted the in vivo analysis of biochemical changes caused by lifestyle oral habits, which can lead to oral cancer, using fluorescence spectroscopic technique. In order to compare the harmful effects of habits, a group of habitués who had potentially malignant lesions of clinically confirmed leukoplakia cases were also included in the study. Variation in the concentration of endogenous fluorophores such as flavin adenine dinucleotide (FAD), porphyrin, and chromophore hemoglobin was specifically evaluated in achieving this goal. To obtain better efficiency in classification, preprocessing methods such as baseline correction and normalization with respect to a specific autofluorescence peak were also done.14,18 Normalized datasets can provide a comparative quantification of a specific flurophores and better classification efficiency. Therefore, we have used normalized spectra throughout this study. The excitation wavelength around 410 nm is ideal for observing the emissions from endogenous fluorophores FAD and porphyrin. FAD gives emission around 500 nm and porphyrin around 630 and 690 nm.13,21,24 This excitation also gives peak around 560 nm due to SFM effect of hemoglobin absorption on fluorescence spectra.18,21 A considerable increase in the intensity of porphyrin peak is observed for habitués from that of nonhabitués except for the palate site. An elevated level of porphyrin is also observed for leukoplakia patients compared to that of nonhabitués. The porphyrin level is found to be nearly equal for habitué and leukoplakia, indicating the transformation of tissue from its normal pathology due to the effect of oral habits. Variation in porphyrin is an important marker in differentiating oral cavity disorders. Using laser-induced fluorescence spectroscopy on oral cavity cancer, Jayanthi et al. have reported that the level of porphyrin increases with the increase in pathological grading.13 In this study, habitués who had no clinically observable lesions also showed increased levels of porphyrin. This increase in porphyrin level can be considered as an indication of the transformation of tissue from normal to diseased conditions in habitués. Out of the different forms of porphyrin, only protoporphyrin IX is synthesized naturally. protoporphyrin IX is a precursor of heme in its synthesis pathway. It has been reported that excess protoporphyrin IX occurs naturally in cancers and their metastases in organs such as oral cavity and colon.9,25 The exact mechanism behind this is still unknown. Increases or decreases in enzymes such as ferrochelates, ALA dehydratase, coproporphyrinogen oxidase, and uroporphyrinogen are termed as the stimulators which cause excess synthesis of protoporphyrin in diseased conditions.26 Moreover, porphyrin is reported to possess multiple antioxidant properties against benzo[a]pyrene and tobacco-specific N-nitrosamines in cigarette smoke, which induce inflammation and damage in the epithelial tissue. Excess production of porphyrin in the sites that is chronically exposed to tobacco-specific toxicants may be due to either the overexpression of porphyrin in diseased conditions or the autoimmune response by the body to resist harmful effects of tobacco.27,28 Consumption of tobacco and alcohol together may also promote excess porphyrin synthesis in oral cavity tissues. Alcohol is reported as a drug that affects porphyrin synthesis in various ways.26 Excess consumption of alcohol tends to alter activity of various types of enzymes that influence heme synthesis. Alcohol is reported as a promoter of -aminolevulinic acid synthase and porphobilinogen deaminase activity and inhibitor of -aminolevulinic acid dehydratase, uroporphyrinogen decarboxylase, and ferrochelatase activity, which results in transient decreases in intracellular heme that stimulates porphyrin synthesis.26 Inconsistency in the spectra from palate is observed for both nonhabitués and habitués. Emission peaks of hemoglobin and porphyrin are found to be distorted. This can be due to reasons including the position of the fiber probe, which is explained more in detail in our earlier report.14 Total hemoglobin concentration is an index of angiogenesis.29 Angiogenesis is the growth of new blood vessels from pre-existing ones. It is a complex phenomenon that is required for the continued growth and survival of solid tumors.30 Studies based on diffuse reflectance spectroscopy have shown an increase in total hemoglobin concentration in oral cancer compared to normal.10 But to date, there are no reports on the evaluation of hemoglobin concentration of oral cavity disorders using fluorescence spectroscopy. Using SFM effect on the fluorescence spectra due to hemoglobin absorption, we have observed a significant decrease in total hemoglobin concentration for nonhabitué versus habitué and nonhabitué versus leukoplakia, irrespective of the site. This finding suggests that due to increased smoking habits, there is decrease in the blood circulation, which is reflected by the reduction in total hemoglobin concentration in oral cavity tissues. Another finding is that habitués and leukoplakia patients show nearly equal concentration of hemoglobin in all the sites. This may be due to the decrease in interleukin-1 (IL-1) enzyme in the leukoplakic condition.31 IL-1 is the specific enzyme that promotes tumor angiogenesis.32 Therefore, the decrease in this enzyme may lead to destruction of blood vessels, which results in a decrease in total hemoglobin concentration. Results of this study imply that blood vessels within the oral cavity get disrupted initially due to distortion of epithelium and connective tissue as a result of various habits. This result in a decrease in total hemoglobin concentration in habitués compared to nonhabitués. Contents in smokeless tobacco, such as tobacco-specific nitrosamines and N-acetyl-l-cysteine, results in increased intracellular ROS levels that cause DNA fragmentation and lipid peroxidation, and decrease in collagen contractability and tissue damage.33–35 Using smokeless tobacco extracts on human oral fibroblasts, Coppe et al. have shown that tobacco-exposed fibroblasts disrupt epithelial cell–cell interactions and stimulate epithelial migration and proliferation. Tobacco also alters epithelial tissue integrity by reducing the expression and membrane localization of critical cell junction proteins E-cadherin and ZO-1.36 Continuous exposure of high-temperature smoke due to cigarette smoking can also be one of the reasons for disruption of epithelium and connective tissue.37 A combination of tobacco associated habits along with alcoholism and areca nut chewing further increases the chances of disruption of epithelium and connective tissue. Alcoholism also produces lipid peroxidation within the cells, which may also result in oral cavity tissue disruption. This is due to the increase in oxidative stress in cells due to ROS production by the oxidation of ethanol to acetaldehyde.38,39 Rough surfaces of areca nut and the variation in pH and temperature caused by slaked lime through continuous pan or ghutka chewing further increase damages to the oral epithelium.14,40 Sensitivity and specificity of discrimination using pairwise correlation of PCA-LDA score were determined using the cutoff values given in Fig. 6. In this clinical trial, we obtained a sensitivity of 60% to 71%, 100%, and 80% to 96% and a corresponding specificity of 76% to 83%, 100%, and 93% to 96% respectively, for discriminating nonhabitués from habitués, nonhabitués from leukoplakia, and habitués from leukoplakia using PCA-LDA analysis. In our earlier study on differentiating nonhabitués, areca nut chewing habitués and oral submucous fibrosis patients using LDA, we have obtained overall sensitivity of 69% to 100% and specificity of 76% to 100%.14 van Staveren et al. obtained a sensitivity of 64% to 100% and specificity of 82% to 94% in distinguishing leukoplakic lesion from normal oral mucosa using artificial neural network analysis on autofluorescence spectral data.12 Venugopal et al. have obtained a sensitivity of 96% and a specificity of 100% using spectral intensity ratio analysis, and an overall sensitivity and specificity of 100% using PCA-LDA for the discrimination of leukoplakia and normal oral mucosa.41 Using LDA on differential path-length spectroscopy data, Amelink et al. showed that nondysplastic and dysplastic leukoplakias can be discriminated with a sensitivity and specificity of 91% and 80%.11 In this study, we have obtained a similar or better classification efficiency compared to that with the previously reported ones in differentiating nonhabitués, habitués, and leukoplakia. Moreover, we have considered the chromophore, hemoglobin, along with the endogenous fluorophores within the tissue in achieving this discrimination. 5.ConclusionsThis study has proven that autofluorescence spectroscopy along with LDA is an excellent tool for the earliest diagnosis of oral cavity disorders in clinical settings. The highlight of the study is the evaluation of total hemoglobin concentration of oral cavity disorders using fluorescence spectroscopy, which has not been reported so far. Elevated levels of porphyrin and reduced concentrations of total hemoglobin observed in habitués in comparison with nonhabitués can be considered as the sign of tissue damage due to habits. These subjects, who had no clinically identified lesions, have a high risk of development of severe oral cavity disorders as evidenced by the hemoglobin concentration and porphyrin levels equal to leukoplakia patients. Considering these findings as an early-stage diagnosis, preventive measures can be taken in the case of these habitués from further development of oral cancer. The results of this study also suggest that this method can be adopted as an early screening tool among habitués, especially in rural areas where such habits are alarmingly high, to rule out the tissue transformation, at very early stages. Data from a much bigger population with different duration of habits would give more specific and stepwise biochemical changes that occur in the oral cavity tissues during tissue transformation. AcknowledgmentsThe authors would like to thank all the patients and volunteers who participated in this study. The financial support received from the Board of Research in Nuclear Sciences, Department of Atomic Energy, Government of India, is sincerely acknowledged. Shaiju S. Nazeer acknowledges Council of Scientific and Industrial Research (CSIR), India, for the Senior Research Fellowship. Assistance received from Arun Anirudhan and Team, Device Testing Laboratory, SCTIMST, in the preparation of the figures is also acknowledged. ReferencesS. Petti,
“Lifestyle risk factors for oral cancer,”
Oral Oncol., 45
(4–5), 340
–350
(2009). http://dx.doi.org/10.1016/j.oraloncology.2008.05.018 EJCCER 1368-8375 Google Scholar
S. WarnakulasuriyaG. SutherlandC. Scully,
“Tobacco, oral cancer, and treatment of dependence,”
Oral Oncol., 41
(3), 244
–260
(2005). http://dx.doi.org/10.1016/j.oraloncology.2004.08.010 EJCCER 1368-8375 Google Scholar
U. NairH. BartschJ. Nair,
“Alert for an epidemic of oral cancer due to use of the betel quid substitutes gutkha and pan masala: a review of agents and causative mechanisms,”
Mutagenesis, 19
(4), 251
–262
(2004). http://dx.doi.org/10.1093/mutage/geh036 MUTAEX Google Scholar
R. Subapriyaet al.,
“Assessment of risk factors for oral squamous cell carcinoma in Chidambaram, Southern India: a case-control study,”
Eur. J. Cancer Prev., 16
(3), 251
–256
(2007). http://dx.doi.org/10.1097/01.cej.0000228402.53106.9e EJUPEK 0959-8278 Google Scholar
S. Warnakulasuriya,
“Global epidemiology of oral and oropharyngeal cancer,”
Oral Oncol., 45
(4–5), 309
–316
(2009). http://dx.doi.org/10.1016/j.oraloncology.2008.06.002 EJCCER 1368-8375 Google Scholar
D. M. Parkinet al.,
“Global cancer statistics, 2002,”
CA Cancer J. Clin., 55
(2), 74
–108
(2005). http://dx.doi.org/10.3322/canjclin.55.2.74 CAMCAM 0007-9235 Google Scholar
M. W. Lingenet al.,
“Critical evaluation of diagnostic aids for the detection of oral cancer,”
Oral Oncol., 44
(1), 10
–22
(2008). http://dx.doi.org/10.1016/j.oraloncology.2007.06.011 EJCCER 1368-8375 Google Scholar
D. C. Fernandezet al.,
“Infrared spectroscopic imaging for histopathologic recognition,”
Nat. Biotechnol., 23
(4), 469
–474
(2005). http://dx.doi.org/10.1038/nbt1080 NABIF9 1087-0156 Google Scholar
S. S. Nazeeret al.,
“Fluorescence spectroscopy to discriminate neoplastic human brain lesions: a study using the spectral intensity ratio and multivariate linear discriminant analysis,”
Laser Phys., 24 025602
(2014). http://dx.doi.org/10.1088/1054-660X/24/2/025602 LAPHEJ 1054-660X Google Scholar
A. Amelinket al.,
“Non-invasive measurement of the morphology and physiology of oral mucosa by use of optical spectroscopy,”
Oral Oncol., 44
(1), 65
–71
(2008). http://dx.doi.org/10.1016/j.oraloncology.2006.12.011 EJCCER 1368-8375 Google Scholar
A. Amelinket al.,
“Non-invasive measurement of the microvascular properties of non-dysplastic and dysplastic oral leukoplakias by use of optical spectroscopy,”
Oral Oncol., 47
(12), 1165
–1170
(2011). http://dx.doi.org/10.1016/j.oraloncology.2011.08.014 EJCCER 1368-8375 Google Scholar
H. J. van Staverenet al.,
“Classification of clinical autofluorescence spectra of oral leukoplakia using an artificial neural network: a pilot study,”
Oral Oncol., 36
(3), 286
–293
(2000). http://dx.doi.org/10.1016/S1368-8375(00)00004-X EJCCER 1368-8375 Google Scholar
J. L. Jayanthiet al.,
“Comparative evaluation of the diagnostic performance of autofluorescence and diffuse reflectance in oral cancer detection: a clinical study,”
J. Biophotonics, 4
(10), 696
–706
(2011). http://dx.doi.org/10.1002/jbio.v4.10 JBOIBX 1864-063X Google Scholar
S. Nazeer Shaijuet al.,
“Habits with killer instincts: in vivo analysis on the severity of oral mucosal alterations using autofluorescence spectroscopy,”
J. Biomed. Opt., 16
(8), 087006
(2011). http://dx.doi.org/10.1117/1.3608923 JBOPFO 1083-3668 Google Scholar
P. S. Hariset al.,
“Autofluorescence spectroscopy for the in vivo evaluation of oral submucous fibrosis,”
Photomed. Laser Surg., 27
(5), 757
–761
(2009). http://dx.doi.org/10.1089/pho.2008.2355 PLDHA8 1549-5418 Google Scholar
M. S. Bergholtet al.,
“Combining near-infrared-excited autofluorescence and Raman spectroscopy improves in vivo diagnosis of gastric cancer,”
Biosens. Bioelectron., 26
(10), 4104
–4110
(2011). http://dx.doi.org/10.1016/j.bios.2011.04.005 BBIOE4 0956-5663 Google Scholar
P. Venkatachalamet al.,
“Diagnosis of breast cancer based on FT-IR spectroscopy,”
Aip Conf. Proc., 1075 144
–148
(2008). http://dx.doi.org/10.1063/1.3046195 APCPCS 0094-243X Google Scholar
S. S. Nazeeret al.,
“Fluorescence spectroscopy as a highly potential single-entity tool to identify chromophores and fluorophores: study on neoplastic human brain lesions,”
J. Biomed. Opt., 18
(6), 067002
(2013). http://dx.doi.org/10.1117/1.JBO.18.6.067002 JBOPFO 1083-3668 Google Scholar
J. M. Baricet al.,
“Influence of cigarette, pipe, and cigar smoking, removable partial dentures, and age on oral leukoplakia,”
Oral Surg. Oral. Med. Oral Pathol., 54
(4), 424
–429
(1982). http://dx.doi.org/10.1016/0030-4220(82)90389-9 OSOMAE 0030-4220 Google Scholar
V. Viveket al.,
“Three-year follow-up of oral leukoplakia after neodymium:yttrium aluminum garnet (Nd:YAG) laser surgery,”
Lasers Med. Sci., 23
(4), 375
–379
(2008). http://dx.doi.org/10.1007/s10103-007-0500-8 LMSCEZ 0268-8921 Google Scholar
Q. LiuT. Vo-Dinh,
“Spectral filtering modulation method for estimation of hemoglobin concentration and oxygenation based on a single fluorescence emission spectrum in tissue phantoms,”
Med. Phys., 36
(10), 4819
–4829
(2009). http://dx.doi.org/10.1118/1.3218763 MPHYA6 0094-2405 Google Scholar
N. KambhatlaT. K. Leen,
“Dimension reduction by local principal component analysis,”
Neural Comput., 9
(7), 1493
–1516
(1997). http://dx.doi.org/10.1162/neco.1997.9.7.1493 Google Scholar
K. Y. Hoet al.,
“Diagnosis of gastric cancer using near-infrared Raman spectroscopy and classification and regression tree techniques,”
J. Biomed. Opt., 13
(3), 034013
(2008). http://dx.doi.org/10.1117/1.2939406 JBOPFO 1083-3668 Google Scholar
A. Saraswathyet al.,
“Optimum wavelength for the differentiation of brain tumor tissue using autofluorescence spectroscopy,”
Photomed. Laser Surg., 27
(3), 425
–433
(2009). http://dx.doi.org/10.1089/pho.2008.2316 PLDHA8 1549-5418 Google Scholar
C. Croceet al.,
“Naturally-occurring porphyrins in a spontaneous-tumour bearing mouse model,”
Photochem. Photobiol. Sci., 10
(7), 1189
–1195
(2011). http://dx.doi.org/10.1039/c0pp00375a PPSHCB 1474-905X Google Scholar
M. O. DossA. KuhnelU. Gross,
“Alcohol and porphyrin metabolism,”
Alcohol Alcohol., 35
(2), 109
–125
(2000). http://dx.doi.org/10.1093/alcalc/35.2.109 ALALDD 0735-0414 Google Scholar
C. Wanget al.,
“Addition of porphyrins to cigarette filters to reduce the levels of benzo[a]pyrene (B[a]P) and tobacco-specific N-nitrosamines (TSNAs) in mainstream cigarette smoke,”
J. Agric. Food Chem., 59
(13), 7172
–7177
(2011). http://dx.doi.org/10.1021/jf200966p JAFCAU 0021-8561 Google Scholar
K. R. Smithet al.,
“Inhibition of tobacco smoke-induced lung inflammation by a catalytic antioxidant,”
Free Radical Biol. Med., 33
(8), 1106
–1114
(2002). http://dx.doi.org/10.1016/S0891-5849(02)01003-1 FRBMEH 0891-5849 Google Scholar
Y. Huet al.,
“EFEMP1 suppresses malignant glioma growth and exerts its action within the tumor extracellular compartment,”
Mol. Cancer, 10 123
(2011). http://dx.doi.org/10.1186/1476-4598-10-123 MCOACG 1476-4598 Google Scholar
R. HasinaM. W. Lingen,
“Angiogenesis in oral cancer,”
J. Dent. Educ., 65
(11), 1282
–1290
(2001). 0022-0337 Google Scholar
M. Wenghoeferet al.,
“Gene expression of oncogenes, antimicrobial peptides, and cytokines in the development of oral leukoplakia,”
Oral Surg. Oral Med. Oral Pathol. Oral Radiol. Endod., 110
(3), 351
–356
(2010). http://dx.doi.org/10.1016/j.tripleo.2009.08.013 1079-2104 Google Scholar
E. Voronovet al.,
“IL-1 is required for tumor invasiveness and angiogenesis,”
Proc. Natl. Acad. Sci. U. S. A., 100
(5), 2645
–2650
(2003). http://dx.doi.org/10.1073/pnas.0437939100 PNASA6 0027-8424 Google Scholar
M. Bagchiet al.,
“Smokeless tobacco, oxidative stress, apoptosis, and antioxidants in human oral keratinocytes,”
Free Radical Biol. Med., 26
(7–8), 992
–1000
(1999). http://dx.doi.org/10.1016/S0891-5849(98)00286-X FRBMEH 0891-5849 Google Scholar
S. S. Hecht,
“Biochemistry, biology, and carcinogenicity of tobacco-specific N-nitrosamines,”
Chem. Res. Toxicol., 11
(6), 559
–603
(1998). http://dx.doi.org/10.1021/tx980005y CRTOEC 0893-228X Google Scholar
L. YinA. MoritaT. Tsuji,
“Alterations of extracellular matrix induced by tobacco smoke extract,”
Arch. Dermatol. Res., 292
(4), 188
–194
(2000). http://dx.doi.org/10.1007/s004030050476 ADREDL 0340-3696 Google Scholar
J. P. Coppeet al.,
“A role for fibroblasts in mediating the effects of tobacco-induced epithelial cell growth and invasion,”
Mol. Cancer Res., 6
(7), 1085
–1098
(2008). http://dx.doi.org/10.1158/1541-7786.MCR-08-0062 MCROC5 1541-7786 Google Scholar
P. ErmalaL. R. Holsti,
“On the burning temperatures of tobacco,”
Cancer Res., 16
(6), 490
–495
(1956). CNREA8 0008-5472 Google Scholar
S. Warnakulasuriyaet al.,
“Demonstration of ethanol-induced protein adducts in oral leukoplakia (pre-cancer) and cancer,”
J. Oral Pathol. Med., 37
(3), 157
–165
(2008). http://dx.doi.org/10.1111/j.1600-0714.2007.00605.x JPMEEA 0904-2512 Google Scholar
M. J. McCulloughC. S. Farah,
“The role of alcohol in oral carcinogenesis with particular reference to alcohol-containing mouthwashes,”
Aust. Dent. J., 53
(4), 302
–305
(2008). http://dx.doi.org/10.1111/adj.2008.53.issue-4 ADEJA2 0045-0421 Google Scholar
E. I. TiktopuloA. V. Kajava,
“Denaturation of type I collagen fibrils is an endothermic process accompanied by a noticeable change in the partial heat capacity†,”
Biochemistry, 37
(22), 8147
–8152
(1998). http://dx.doi.org/10.1021/bi980360n BICHAW 0006-2960 Google Scholar
C. Venugopalet al.,
“Autofluorescence spectroscopy augmented by multivariate analysis as a potential noninvasive tool for early diagnosis of oral cavity disorders,”
Photomed. Laser Surg., 31
(12), 605
–612
(2013). http://dx.doi.org/10.1089/pho.2013.3547 PLDHA8 1549-5418 Google Scholar
BiographyShaiju S. Nazeer received his MSc in physics in 2006 and MPhil in 2008 with spectroscopy as special subject from Annamalai University, India. Recently he has been awarded the Senior Research Fellowship of the Council for Scientific and Industrial Research (CSIR), Government of India. He is pursuing his doctoral thesis on areas like spectral mapping, spectroscopic diagnosis, and characterization of different types of tumors. His areas of research interest are biospectroscopy and nanobiophotonics. Rajasekharan Asish did his master’s degree (MDS) in oral medicine and radiology in 2008 from Kerala University. Currently he is working as assistant professor in Government Dental College, Trivandrum, Kerala, India. His area of interest is early detection of oral malignancies using optical diagnostic tools. Chandrashekharan Venugopal received his MDS from Kerala University and is now working as a dental surgeon in Kerala State Health Services. His master’s thesis focuses on autofluorescence spectroscopy of leukoplakia. His scientific interests include optical spectroscopy for the early detection of malignancy and he is committed to the early diagnosis and treatment of premalignant lesions of the general public. Balan Anita did her BDS in oral medicine and radiology and MDS in conservative dentistry in Government Dental College, Trivandrum under Kerala University. She has over 24 years of teaching experience. Currently she is the professor and head of the Department of Oral Medicine & Radiology at Government Dental College, Kozhikode. Arun Kumar Gupta is the professor and head of the Department of Neuro Imaging and Interventional Radiology, National Institute of Mental Health and Neuro Sciences, Bangalore, India. Formerly he was the head of the Department of Imaging Sciences and Interventional Radiology, SCTIMST, and has more than 30 years of experience in the field of neuroimaging and interventional radiology. His interest also extends to laser-based techniques in biomedical applications, bioimaging, and photodiagnosis. Ramapurath S. Jayasree heads the Biophotonics and Imaging Laboratory of SCTIMST at its BMT Wing. She gained her PG degree in physics from CUSAT and PhD in vibrational spectroscopic techniques from Kerala University. She has experience spanning to more than 15 years in the field of application lasers in medicine. Her research interests are biophotonics for diagnosis and therapy, development of molecular probes for biophotonics and imaging applications, optical and MR molecular imaging, vibrational, fluorescence and MR spectroscopy in biology and medicine. |
||||||||||||||||||||||||||||||||||||||||||||||||||||||||||||||||||||||||||||||||||||||||||||||||||||||||||||||||||||||||||||||||||||||||||||||||||||||||||||||||||||||||||||||||||||||||||||||||||||||||||||||||||||||||||||||||||||||||||||||||||||||||||||||||||||||||||||||||||