|
|
1.IntroductionBone is a biomaterial with a strict hierarchical structure.1 The interplay of its architecture down to the micrometer scale with a composite of organic matrix and mineral phases at the nanoscale results in unique material properties and favorable characteristics in resisting mechanical stress.2 To investigate the impact of pathological and drug-related changes on bone strength, both bone architecture and the quality of the mineralized bone matrix need to be taken into account in addition to routinely reported bone mineral density (BMD) as determined by dual-energy x-ray absorptiometry. To date, considerable effort has been dedicated to study the bone quality and to characterize the composition of the organic matrix–mineral composite. As a consequence, the application of Raman spectroscopy for analysis has increased dramatically over the last years3–6 and has become a useful tool for the investigation of bone material, offering simultaneous information on the properties of its organic matrix and mineral phase. The mineral/matrix ratio [i.e., mineral phase () normalized to organic matrix (amide)] is a frequently used parameter to describe the bone matrix mineralization, with several studies demonstrating that this ratio is altered due to disease or during treatment. For example Morris et al. observed changes in the mineral/matrix ratio in murine femora after mechanical stimulation.7 Lane et al. studied the glucocorticoid-treated mice and found changes in the mineral/matrix ratio as well as in the elastic modulus of lumbar vertebrae.8–10 Recent studies combining Raman microspectroscopy with fluorescence microscopy investigated the tissue parameters at defined tissues, thus independently of bone turnover.11–14 In addition to Raman spectroscopy, scanning electron microscopy using high-energy backscattered electrons (BEs) has also been proven to be a powerful tool for the examination of bone matrix mineralization. Quantitative backscattered electron imaging (qBEI) is a validated and established quantitative method for the determination of the local Ca content (weight percent Ca—wt. %Ca).15 Although Raman microspectroscopy provides information on several parameters based on the characteristic chemical bonds present in the mineral and the organic matrix bone components, qBEI offers the ability to determine the average atomic number of the analyzed material and consequently to quantify the weight fraction of Ca or percentage (wt. %Ca) in bone material. Both methods have a spatial resolution of about 1 μm and can be applied on bulk polymethylmethacrylate (PMMA) embedded samples with polished surfaces in a nondestructive way. In the past, qBEI and Raman spectroscopy were shown to be comprehensive methods to characterize the mineralized bone matrix. In several studies, Raman measurements as well as qBEI analysis were performed on the same samples, but while qBEI parameters usually refer to frequency distributions of mineral content within the large bone regions, the Raman parameters are obtained in microanatomical areas of specific tissue ages, usually located near the mineralization front.16 A head-to-head comparison of both methods with identical measurement regions describing bone matrix mineralization has not been performed to date. Thus, the aim of this study was to elucidate the relationship between the mineral/matrix ratio as assessed by Raman microspectroscopy and the mean calcium content as obtained by qBEI in healthy bone, undergoing the secondary mineralization phase. To interpret the mineral/matrix Raman intensity and qBEI outcomes together, a fundamental knowledge of the correlation between these parameters is required. How is the mineral/matrix ratio linked with the Ca content as measured by qBEI in these regions? Can the technical variation be separated from biological heterogeneity? What is the statistical power of each technique? Low-mineralized regions (below 17.5 wt. %Ca) were excluded in this study because of technical restrictions (accuracy of image matching). Biological features, such as increased microporosity (PMMA content14) or highly variable Ca/P ratio17 are reported to change rapidly in these regions with the distance to the mineralization front. Therefore, it must be noted that the outcome of this study does not necessarily extrapolate to freshly mineralized regions. The mineral/matrix ratio was calculated from the integrated area of the and the amide III peaks [Fig. 1(c)]. We chose the and the amide III bands as it was previously shown that they have minimal susceptibility to tissue organization/orientation effects.18–22 Fig. 1(a) Overview of a quantitative backscattered electron imaging (qBEI) image with overlaid light microscope images. Light microscope images (LM) were taken at the Raman device for the documentation of the measurement points (red dots). The blue boxes designate the regions of interest (ROI) for qBEI analysis. (b) qBEI analysis: Orientations and positions of the blue boxes were transferred from (a) to mark the exact positions of the ROIs that were considered for qBEI analysis. (c) Raman analysis: representative Raman spectrum of human bone; the and the amide III peaks (red) were used to derive the mineral/matrix ratio. (d) Comparison of Raman and qBEI results: Mineral/matrix assessed by Raman versus wt. %Ca measured by qBEI. Each circle represents the average value of one ROI [blue boxes in (a) and (b)]. 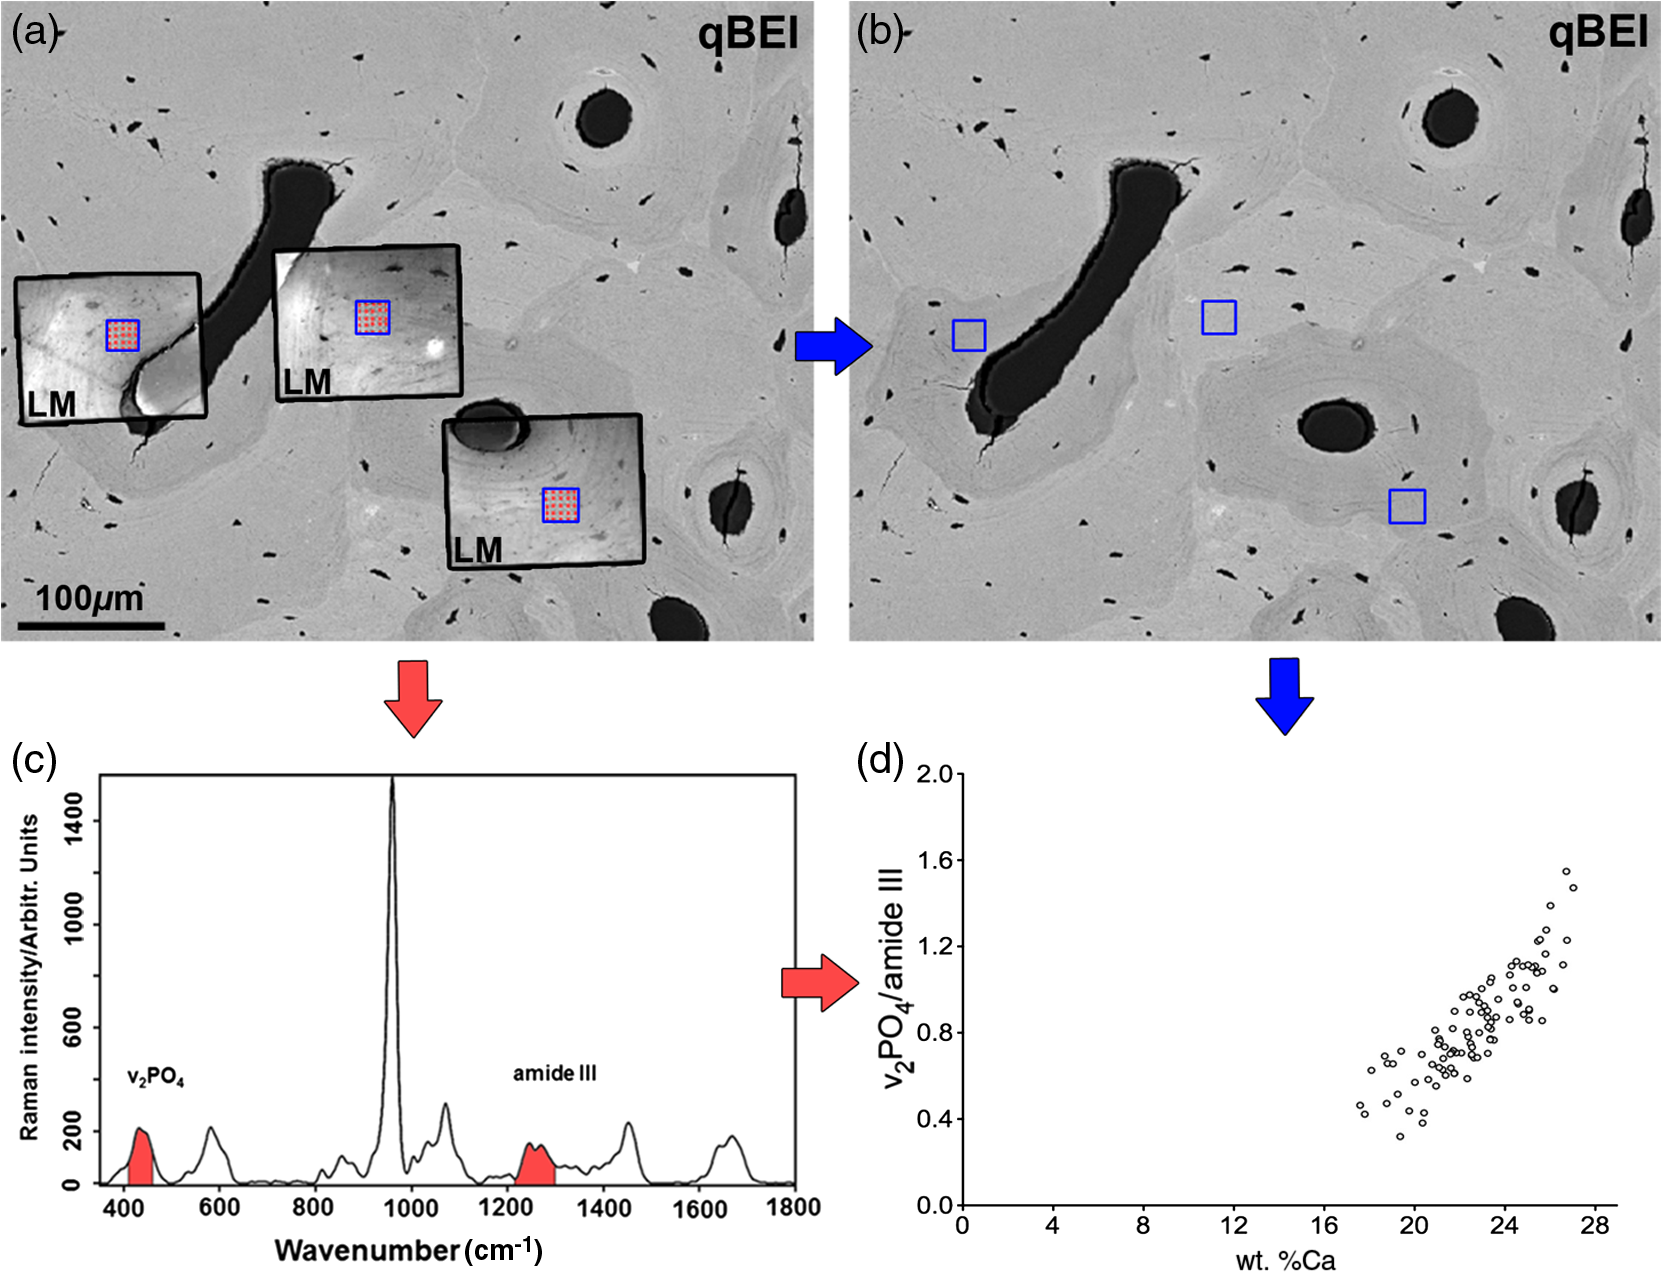 The Ca content (Ca mass fraction) was derived from BE signal intensities (gray levels in qBEI image) that reflect the local electron density of the bone material. For this purpose, the gray levels were standardized against reference materials (carbon and aluminum) with known electron densities (atomic numbers). The mineral/matrix ratios and the local Ca concentrations were measured in well-defined, identical osteonal areas of bone matrix selected exclusively in the secondary mineralization phase, for the reasons stated previously. Furthermore, only healthy human bone was considered for this study. Since in the selected bone regions, the overwhelming amount of Ca and is encountered within the poorly crystalline hydroxyapatite crystallites, the hypothesis tested was that the mineral/matrix ratio is strongly correlated with the Ca concentration. Complementing the instrumental measurements, theoretical estimations were also performed so as to model the type of the expected correlation between qBEI and Raman parameters. In addition to pure hydroxyapatite, curves for other types of calcium phosphates were calculated. Finally, the technical and biological variations of Raman and qBEI outcomes were investigated. 2.Materials and Methods2.1.Samples and PreparationWe analyzed the samples from the femoral midshaft of three women without any history of metabolic bone disease based on pathology records. (Sample 1: 29 years; Sample 2: 39 years; and Sample 3: 55 years). The samples were provided by the Department of Forensic Medicine of the Medical University Vienna. The undecalcified samples were fixed in 70% ethanol, dehydrated through a graded ethanol series, and embedded in PMMA. To ensure a minimal disturbance of the circular shape of the osteons, about 1-cm-thick discs were cut perpendicular to the bone axis of the femoral midshaft region using a low-speed diamond saw (Buehler Isomet, Lake Bluff, Illinois). The cross-section surfaces were grounded by sand paper and subsequently polished using diamond suspension (3 and 1 μm grain size) on a precision polishing device (PM5 Logitech, Glasgow, Scotland), and carbon-coated (Ager SEM Carbon Coater, Stansted, UK) prior to qBEI. The study was performed in accordance with the Institutional Ethical Review Board of the Department of Forensic Medicine of the Medical University of Vienna. 2.2.Measurement ProceduresRaman microspectroscopy and qBEI were performed on the identical sample surface in osteonal and interstitial bones. To achieve that, Raman measurements were performed prior to qBEI because the carbon coating, which is used for qBEI, interferes with the Raman signal (fluorescence). Before this, a preselection of the bone areas of interest was also done using qBEI with subsequent removal of the coating. The first run of qBEI acquisition was used to select 99 osteons and interstitial regions where the Raman measurements were eventually collected. The grinding and polishing procedure to remove the carbon coating resulted in a slight change of the section plane. Then, Raman microspectroscopy was performed in a grid of measurement points, defining square regions of interest (ROI, ). The ROIs were selected inside osteons or interstitial regions, without any overlap with cement lines [Fig. 1(a)]. Light microscope images with the indications of the measurement points were also acquired. Subsequently, the samples were carbon coated again and the second run of qBEI acquisition was performed on the identical bone surface plane as analyzed by Raman previously ( magnification, 0.9-μm pixel size). Using ImageJ for image processing and analysis (version 1.44f, National Institutes of Health, Bethesda, Maryland), it was possible to overlay the light microscope images taken through the Raman device and the qBEI images with an uncertainty of about 3 μm [Fig. 1(a)]. The positions of the regions of interest (ROIs) were transferred to the qBEI image [Fig. 1(b)]. For every ROI, an average wt. %Ca value was derived and associated with the corresponding average mineral/matrix value as assessed by Raman. Osteocyte lacunae were excluded from the measurements in both methods. 2.3.Raman AnalysisRaman spectra were obtained in an area of ROI in a grid (step size: ) [Fig. 1(a)] with a Senterra (Bruker Optics GmbH, Ettlingen, Germany, 785 nm, 100 mW laser) using a objective (NA 0.75). Confocality was achieved using a slit-type aperture of (spot size ). Once acquired, the Raman spectra were baseline corrected (rubber band,23 five iterations) to account for fluorescence, and the mineral/matrix ratio was calculated from the ratio of the integrated peak areas of the (410 to ) to the amide III (1215 to ) [Fig. 1(c)]. It has previously been shown that the mineral/matrix ratio assessed with these parameters is not orientation dependent.21 The calculated values were averaged, resulting in a single mineral/matrix value representative for the corresponding ROI. 2.4.qBEIqBEI microscopy is a validated and well-established method for the quantitative and spatially resolved assessment of the bone mineral content.15 In a scanning electron microscope, the intensity of BEs is proportional to the average atomic number () of the target material. As a consequence, the qBEI intensity [converted to gray values (GVs) in the images] can be either correlated with the weight percent bone mineral or calcium (wt. %Ca), if a constant Ca/P ratio inside the mineral is assumed. The method includes a calibration with standard reference materials, which is performed before every set of measurements. Using the 8 bit image of a reference sample, GVs of pure carbon (C, ) and pure aluminum (Al, ) are set to 25 and 225, respectively, by adjusting image brightness and contrast. The GVs of mineralized bone tissue were directly converted into wt. %Ca. According to the calibration procedure, nonmineralized bone matrix (osteoid, ) has 0 wt. %Ca and pure hydroxyapatite (), which has 39.86 wt. %Ca due to its composition. More details can be found in the literature.15,24,25 A comparison between qBEI and energy dispersive x-ray (EDX) analysis verified the linear dependency of the wt. %Ca (assessed by quantitative EDX) and the qBEI backscattered signal. As a result of the calibration and the comparison with EDX readings, a linear equation was derived describing the correlation between the GV and the Ca content in weight percent: .15 Therefore, one GV step corresponds to a change of about 0.17 wt. %Ca. Furthermore, within this study, the intra-assay and the inter-assay technical variance of this method were assessed when measuring the same region of trabecular bone from a human iliac crest biopsy at magnification for six and eight times, respectively (intra-assay variance: 0.27% of mean the Ca content and inter-assay variance: 0.30% of mean the Ca content). All measurements of the studies mentioned above and the current study were performed with a digital scanning electron microscope (DSM 962; Zeiss, Oberkochen, Germany) equipped with a four-quadrant semiconductor BE detector. Images of the current study were generated at magnification featuring a pixel size of 0.9 μm. Measurements were performed at an acceleration voltage of 20 kV with a probe current of 110 pA. The working distance was set to 15 mm. Based on previously published reports, the information depth at 20 kV is about 1.5 μm in a bone-like material.26 2.5.Determination of Technical and Biological Variations and Statistical AnalysisTechnical variations were calculated for both techniques. In the case of Raman analysis, one measurement point in a secondary mineralized osteon was measured 20 times with the same measurement parameters as used in this study. The technical variation was defined as sigma of the standard error of the mean. For qBEI, a area of human cortical bone was measured 20 times at magnification with the same measurement parameters as used in this study. Six ROIs of were selected inside different bone structural units and average Ca concentrations were evaluated for every ROI. Therefore, for each of the six ROI sets, the standard deviations (SDs) were calculated using the 20 calcium mean values of the ROIs. The calculations included a correction for a slight beam damage effect. The technical variation of the qBEI method was defined as sigma of the average SD. The 95% prediction bands in Fig. 2 represent the linear bandwidth that includes 95% of the data points. The actual slope lies within the confidence with a probability of 95%. For the comparison of the SDs, the coefficients of variation (COV) Mann-Whitney tests were performed, where was considered significant. Fig. 2Correlation of mineral/matrix () assessed by Raman and measured by qBEI: Each data point refers to an ROI. Additionally, the linear regression line (black dashed line), the 95% confidence bands of the slope (dark dashed line), and the 95% prediction bands (bright dashed line) are shown. As predicted by theoretical estimations, the plotted data are correlated linearly ().  Statistical analysis was performed with Graphpad (La Jolla, California) Prism 5.0d for MacOSX. 3.Results3.1.Mineral/Matrix Versus wt. %Ca ResultsEach point in Fig. 1(d) depicts the average value of one ROI [i.e., the mean value of 25 Raman measurements and qBEI pixels as shown in Fig. 1(a)]. The mineral/matrix integrated area ratio varied between 0.32 and 1.55 within a range from 17.6 to 27.0 wt. %Ca () as assessed by qBEI. In Fig. 1(d), a ratio (mineral/matrix) is plotted versus a fraction (wt. %Ca). For mathematical reasons, the relationship between these parameters is not expected to be directly proportional (linear, going through zero). This is in line with our results, where the regression line does not extrapolate to zero. In order to better understand this relationship, we investigated the theoretical correlation of our Raman and qBEI results. 3.2.Theoretical Correlation of the Raman and qBEI ResultsTo estimate the relationship between Ca content (wt. %Ca) and integrated area ratio (mineral/matrix), we consider bone tissue in a small volume of a resin-embedded bone section to consist of mineral (poorly crystalline carbonated hydroxyapatite), protein matrix (mainly collagen with minor contribution from noncollagenous proteins, lipids, proteoglycans, and water), and inclusions of PMMA. To obtain a simple analytical relation, several simplifications were made:
Assuming a known composition of apatite, weight percent mineral (wt. %Mineral) can be derived from the qBEI outcome. This is done using the mass of mineral per group () and the mass of organic matrix per amide vibrational unit (). These parameters are not directly accessible using qBEI but can be used to express wt. %Mineral as done in Eq. (1). and are the numbers of the corresponding vibrational units (per unit volume). As a result of these definitions, wt. %Mineral can be written as the mass of the mineral divided by the mass of the mineral phase plus the mass of the organic matrix This can be transformed to the wt. %Mineral ratio shown below When Ca/P is given, this can be correlated to the fraction of mineral present in the tissue. According to the approximation of pure hydroxyapatite (), wt. %Mineral equals .25 Therefore, the left side of Eq. (2) can be calculated from the qBEI results and is interpreted as the amount of mineral divided by the amount of nonmineral (organic) matrix (since the assumption is that in secondary mineralized packets, the PMMA contribution is negligible). The relationship between the intensity of Raman scattered light and the primary beam intensity was derived previously.28 According to this work, linear superposition becomes problematic in turbid media due to the absorption of Raman scattered light. These errors should be diminished due to the confocal setup minimizing the optical path through the medium. All constants and parameters linked to the vibration properties can be summarized by the molecule-dependent parameters and , respectively. These definitions allow simplifying the mineral/matrix ratio as shown in Eq. (3). is representative for the whole amide III signal, although it should be kept in mind that this spectral area encompasses numerous vibrations. Therefore, can be replaced by a sum over all contributing . Due to the confocal experimental setup, the measurement volume and can be treated as equal for each measurement spot where and [Eq. (2)] as well as and [Eq. (3)] are constants. As a result, a linear correlation is expected when inserting measurement points in a wt. %Mineral-ratio versus a mineral/matrix diagramThe theoretical slope of the linear regression leads to Quantitative calculations of this slope are complex due to the parameters and , which include unknown contributions from the optical parameters, Raman tensors, and measurement geometry. Also, the estimations for require detailed information on the composition of the organic matrix. Nevertheless, regarding the measurements of mineral/matrix and wt. %Ca in healthy secondary mineralized bone, resulting from these theoretical considerations two definite statements can be made:
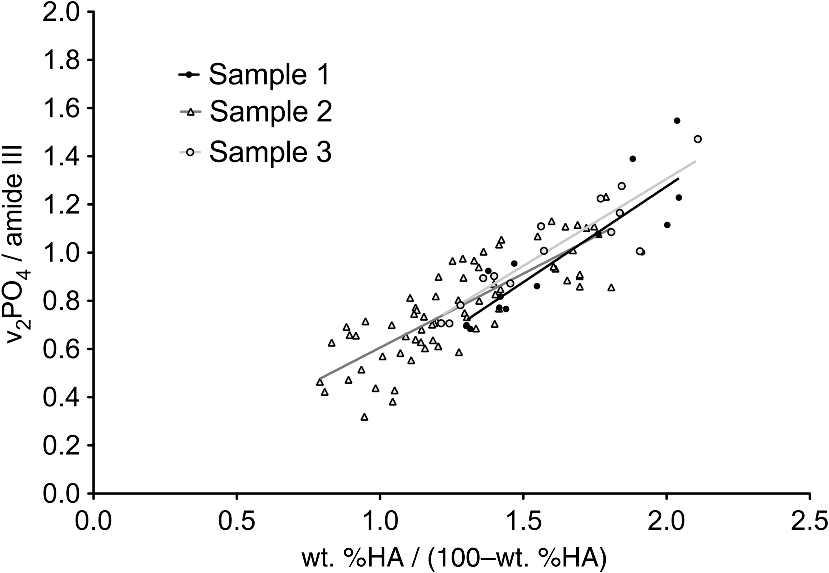
3.3.Mineral/Matrix Versus ResultsFigure 1(d) shows the mineral/matrix versus wt. %Ca measurements. The transformation of the -axis from wt. %Ca to as introduced in Eq. (2) (with the approximation of hydroxyapatite with ) increases linearity () (Fig. 2). Within the 95% confidence bands of the slope, we found a linear direct proportional behavior of these parameters, in excellent agreement with the theoretical considerations. 3.4.Calculations on the Influence of the Ca/P Ratio of Bone MineralFrom a theoretical point of view, it is possible to estimate changes in the mineral/matrix ratio in the case of a changed mineral composition (assuming relatively unaltered organic matrix) like the influence of other mineral phases or the degree of the apatitic crystal lattice ion substitutions. Extending Eq. (4), we now introduce a parameter , which depends on a hypothetical mineral composition and describes the relationship between wt. %Ca to wt. %Mineral. equals 2.51 for pure hydroxyapatite and changes due to the properties of the mineral25 The last term of Eq. (6) can be summarized to the factor Figure 3 illustrates the mineral/matrix ratio calculated from arbitrarily chosen wt. %Ca values for three different values of . was chosen to fit the results of our measurements. Resulting from the approximation that mineral consists of pure hydroxyapatite (), the range between the two dashed lines reflects the difference between a hypothetical mixture of hydroxyapatite and octacalciumphosphate () (, , ) and type B-carbonated hydroxyapatite with (), , ).29,30 Fig. 3Mineral/matrix () calculated from arbitrary wt. %Ca values with variations in . The -value includes unknown parameters like and and the exact composition of the collagen and the mineral matrix. was chosen to fit the measurements. Using the approximation that bone consists of pure hydroxyapatite, the bandwidth between the two dashed lines reflect the difference between a 1:1 mixture of octacalcium phosphate () and carbonated hydroxyapatite with . The gray region reflects the converted 95% prediction bands. The validity of these graphs for the low-mineralized regions remains unclear.  3.5.Technical Variations Versus Biological VariationsDespite the highly linear correlation, the question lingers whether the deviations from the regression line in Fig. 2 are due to technical variations of the measurement setup, or due to biological heterogeneities influencing Raman and qBEI signals in different manners. To determine the influence of these factors, in Fig. 4(a), the error bars are added to the data points representing 2 sigma (Raman: 0.0088 mineral/matrix, qBEI: 0.099 wt. %Ca) of the technical variation as described above. For both Raman and qBEI, the technical variability causes only minor uncertainties. Thus, we conclude that the technical variations are too low to substantially contribute to the deviation of the data points from the regression line. Fig. 4(a) Technical variability: mineral/matrix () versus wt. %Ca. The bars of the crosses are sigma of the technical variation. The technical variations were derived for both methods by obtaining the same region for approximately 20 times. (b) Intraindividual variability within a ROI: crosses symbolize the observed standard deviations (SDs) within each measurement field for Raman and qBEI. To improve legibility not all data points are shown with error bars.  In Fig. 4(b), the error bars illustrate the measured SD within each ROI. Therefore, error bars in the -direction represent the SD of the mineral/matrix ratio of the 25 measurement points of the corresponding region. To achieve comparable statistics between Raman and qBEI, within every ROI average GVs of all bins were used to calculate the SDs for qBEI. Hence, for Raman and for qBEI, 25 values per ROI are used to determine the biological variances, but nevertheless the statistical power is different. This is due to the fact that for qBEI, each value itself is the average over a field of . As a consequence, this procedure reduces the noise in the qBEI results causing reductions of the SDs and the COV. The comparison of these results with the technical variations [Fig. 4(a)] leads to the conclusion that the variations within a ROI are predominantly due to a biological variation rather than fluctuations caused by the measurement process. Furthermore, the magnitude of the SDs strongly suggests a dependency on the degree of mineralization (wt. %Ca) for both qBEI and Raman. Low-mineralized ROIs () have significantly higher SDs in both methods () compared to the ROIs with a Ca content between 21 and 26 wt. %. Interestingly, for highly mineralized ROIs (), the SD deviation in wt. %Ca remains unchanged (), while the SDs of the mineral/matrix values increase significantly compared to those with medium mineral content (). The results of this analysis are shown in Table 1. Table 1Median SDs and coefficients of variation (COV) within the regions of interest (ROI) for Raman and qBEI for three ranges of different mineralizations.
When the COVs are calculated, the significant differences of the variations between the low- and the medium-mineralized regions remain (), while the COVs of the medium and highly mineralized regions are equal for Raman () and qBEI () (Table 1). The significances for qBEI were also calculated with the same results for the wt. %Matrix-ratio as introduced in Eq. (2), so that changes due to the conversion to wt. %Ca can be excluded as confounding factors. 3.6.Interindividual Variations of the Regression SlopesThe statistical evaluation (linear regression analysis) of the interindividual differences showed that neither slope nor intercept with the -axis of the linear regressions were significantly different for all three samples (Fig. 5). 4.DiscussionIn agreement with the theoretical evaluation, a nondirect proportional relationship between wt. %Ca (measured by qBEI) and mineral/matrix (measured by Raman) was found (a mathematical extrapolation of the data does not go through zero). However, as expected linearity (and direct proportionality) exists between (derived from wt. %Ca) and mineral/matrix in bone regions undergoing secondary mineralization. All the presented data as well as the correlation refer to these regions and may not extrapolate to regions with low mineral content close to the mineralization front as discussed below. It is demonstrated that the deviations from the linear regressions line are predominately due to biological heterogeneity. Therefore, we now address the various sources of these uncertainties. 4.1.Variability between the ROIsOur study links the mineral/matrix ratio () measured by Raman with wt. %Ca as assessed by qBEI, in healthy human bone, exclusively in the secondary mineralization phase. The Ca content of the analyzed measurement fields ranges from 17.6 wt. %Ca up to 27 wt. %Ca covering most of the Ca-concentration range present in human bones [Fig. 1(d)]. The narrow regions of primary mineralized bone that occur next to active mineralization fronts were excluded from this study. A transformation of the -axis from wt. %Ca to (termed wt. %Mineral ratio) results in Fig. 2. The linear correlation and its intercept with the -axis close to origin (which lies in the 95% confidence band) are in agreement with a theoretical estimation when approximating the mineral phase using pure hydroxyapatite ) (Fig. 2). When comparing the technical and the observed variability for both methods, we found that the scattering of the data points in Fig. 2 is primarily related to the biological heterogeneity of bone material. Even within a ROI that was placed inside a single bone structural unit, the material appears heterogeneous, causing variations in the measurement parameters higher than the technical uncertainties (Fig. 4). As a consequence, the deviation from the regression line is caused by local changes in the material properties. Therefore the question remains: To what extent do changes in the sample composition influence the results? 4.2.Influence of the Ca/P of Bone MineralOften, the Ca/P ratio is used to characterize the mineral composition, but for human bone tissue Ca/P values vary between 1.6 and 1.7.31 Other studies using energy dispersive x-ray analysis (EDX) measured Ca/P weight percent ratios between 2.1 and 2.2, which corresponds to the Ca/P ratio range mentioned above.32,33 This variability is likely due to changes in the apatite composition due to type A and type B carbonate substitutions as well as Mg, Na, or K or even the presence of calcium ion lattice vacancies in the apatite crystal.34–38 Of course, alterations in the mineral composition or phase change both Raman and qBEI outcomes. The expected range of the measurements according to changes in the Ca/P ratio is estimated in Sec. 3.4 for a hypothetical mixture of hydroxyapatite and octacalcium phosphate (), as well as for type B-carbonated hydroxyapatite (). The Ca/P ratios of 1.5 and 1.9 in this model may reflect exaggerated deviations in the mineral composition from pure hydroxyapatite and likely do not relate to appreciable phases occurring in bone. Nevertheless, it reveals in which way changes in the mineral are altering the correlation between wt. %Ca and mineral/matrix. Since the gray shaded region in Fig. 3 corresponds to the 95% confidence interval from the measured scatter of mineral/matrix and wt. %Ca values in Fig. 2, it can be speculated that the variability between and within the ROIs originates from distinct local changes of the mineral composition. However, the origin of these changes remains unclear. Fluctuations in the degree of carbonate substitution, the presence of mineral phases other than hydroxyapatite, or Ca substitution with ions such as Mg, K, are plausible explanations. This is in agreement with the previous studies showing that the chemical composition of hydroxyapatite changes as a function of the location (thus tissue age) within an osteon.10,35 Of course, it cannot be excluded that changes in the organic matrix also contribute to the observed variability. For example, phosphorylated organic molecules potentially increase the local content, and protein-bound Ca may also contribute to our results. 4.3.Variability within an ROIWe observed a significant increase of the SDs in the lower mineralized ROIs for both methods (Table 1). These regions () were located in osteons with ongoing bone apposition (mineralizing surfaces), which were identified by a distinct gradient of mineral content down to the level of pure osteoid. In such young osteons the degree of mineralization increases as a function of distance to the Haversian channel. This causes a gradient of mineralization within the ROIs and therefore enhanced SDs for the outcome of both methods (Table 1). Also, the local biological variance might be increased in very young bone. The fact that these differences remain significant when normalizing the SDs for the mean value and calculating the COV supports these statements. The variability of the calcium content within the ROIs in the highly mineralized osteons or interstitial regions () remained unchanged. Interestingly, the variability of the mineral/matrix ratio increased in these regions significantly. In contrast to that, a statistical analysis of the COVs of these regions showed no significant differences between medium and highly mineralized ROIs. Therefore, it can be assumed that for Raman, the variability in the mineral/matrix ratio is a function of the degree of mineralization and tissue age, unlike qBEI. Regarding qBEI, it was previously reported that there are slight variations in the mineralization and also in the mechanical parameters between adjacent lamellae of osteonal bone, likely contributing to the observed heterogeneity within a ROI.39 4.4.Interpretation of the SlopesAs the curves in Fig. 3 correspond to straight lines with various slopes in the mineral/matrix ratio versus wt. %Mineral-ratio diagram in Fig. 2, distinct changes in the slope of the regression line would indicate fundamental changes in the tissue composition of the secondary mineralized regions. Therefore, this type of measurement may prove to be an extra tool for the investigation of bone quality in diseased bone as it is reflective of altered mineral composition and may also prove to be a key factor bridging altered bone quality as assessed by Raman spectroscopy with altered BMD distribution. In the future, together with the Raman evaluation of the ratio (a measurement for the degree of carbonate incorporation) and energy dispersive x-ray analysis (EDX) (quantification of the Ca/P ratio and the Na and K content), we expect to be able to check whether an altered slope is due to a different mineral composition or if abnormal composition of the organic matrix must be considered. In this study, the variations in the slopes between the individuals showed no significant differences (Fig. 5). However, due to the low sample number and the study design, slight changes in the slopes might not reach significance. The presented techniques can be used to obtain data from a larger healthy reference cohort to generate a more robust tool for clinical investigation. It must be noted that, in this case, the acquisition settings must be the same for the measurements on different samples assuring comparability of the gained data. Nevertheless, the comparison of measurements on diseased bone with the data shown in this study might help to understand changes in the mineralization process, if distinct deviations from the presented correlation are observed. Raman measurements are often performed close to the regions of new bone formation, between fluorescent labels, marking young regions with strictly defined tissue age11—a tissue type that is not covered in this study. The combination of Raman and qBEI as used in this study but closer to the mineralization front provides a promising topic for future investigation. Thus, the very early stages of bone formation can be analyzed. The base for such an analysis is an extremely precise matching of the points of measurements between both methods, which is still challenging (at least 1 μm accuracy). Superimposing optical and qBEI images can most likely not achieve this. Nevertheless, a correlation of the Raman parameters with the tissue age or Ca concentration is expected to yield significant insights into the evolution of bone mineralization in health and disease. The interpretation of the correlation between Raman and qBEI data close to the mineralization front is expected to become even more complicated because in these regions the chemical composition of the measurement volume changes systematically as a function of the location, and the makeup of the organic matrix is also rapidly changing. In these narrow bands the Ca content as measured by qBEI and also the mineral/matrix ratio increase drastically with the distance from the osteoid surface.11,13,24 How the regression curves [Fig. 1(d) and 2] behave in these interface regions remains unknown. Deviations from the linear regression are expected according to an increase of the PMMA content linked to the higher microporosity. Additionally parameters such as mineral crystallinity or relative lipids and proteoglycan content are reported to change at mineralization fronts as a function of distance from the Haversian canal.14 Once a technique for precise matching of Raman and qBEI measurements is developed, such studies can help to elucidate underlying mechanisms of tissue mineralization. 5.ConclusionThrough a combination of Raman microspectroscopy and quantitative backscattered electron microscopy, Raman intensities (mineral/matrix ratio) data were linked with Ca content (wt. %Ca) data. A linear correlation of mineral/matrix (Raman) with the transformed wt. %Mineral/wt. %(Organic Matrix) (qBEI) was observed in healthy human bone matrix being in secondary mineralization phase. This type of correlation is in agreement with theoretical considerations. The local variability of both parameters inside bone structural units is caused by biological heterogeneity and was found to depend on the degree of mineralization. The combination of Raman and qBEI provides a novel approach for the detection of changes in the composition of bone tissue that might help to understand the mineralization process in cases of diseased bone. AcknowledgmentsThe authors thank Sonja Lueger, Daniela Gabriel, and Petra Keplinger for excellent technical assistance and performing the qBEI measurements at the Ludwig Boltzmann Institute of Osteology, Vienna, Austria. This study was supported by the AUVA (research funds of the Austrian workers compensation board) and the WGKK (Viennese sickness insurance funds), Vienna, Austria. ReferencesP. Fratzl and R. Weinkamer,
“Nature’s hierarchical materials,”
Prog. Mater. Sci., 52
(8), 1263
–1334
(2007). http://dx.doi.org/10.1016/j.pmatsci.2007.06.001 PRMSAQ 0079-6425 Google Scholar
P. Fratzl et al.,
“Structure and mechanical quality of the collagen-mineral nano-composite in bone,”
J. Mater. Chem., 14 2115
–2123
(2004). http://dx.doi.org/10.1039/b402005g JMACEP 0959-9428 Google Scholar
M. Amer, Raman Spectroscopy for Soft Matter Applications, John Wiley & Sons, New Jersey
(2009). Google Scholar
F. Severcan and P. I. Haris, Vibrational Spectroscopy in Diagnosis and Screening, IOS Press, Amsterdam, Netherlands
(2012). Google Scholar
M. D. Morris and G. S. Mandair,
“Raman assessment of bone quality,”
Clin. Orthop. Relat. Res., 469
(8), 2160
–2169
(2011). http://dx.doi.org/10.1007/s11999-010-1692-y CORTBR 0009-921X Google Scholar
A. Carden and M. D. Morris,
“Application of vibrational spectroscopy to the study of mineralized tissues (review),”
J. Biomed. Opt., 5
(3), 259
–268
(2000). http://dx.doi.org/10.1117/1.429994 JBOPFO 1083-3668 Google Scholar
M. D. Morris et al.,
“Bone tissue ultrastructural response to elastic deformation probed by Raman spectroscopy,”
Faraday Discuss., 126 159
–168
(2004). http://dx.doi.org/10.1039/b304905a FDISE6 0301-7249 Google Scholar
N. E. Lane et al.,
“Glucocorticoid-treated mice have localized changes in trabecular bone material properties and osteocyte lacunar size that are not observed in placebo-treated or estrogen-deficient mice,”
J. Bone Miner. Res., 21
(3), 466
–476
(2006). http://dx.doi.org/10.1359/JBMR.051103 JBMREJ 0884-0431 Google Scholar
O. Akkus et al.,
“Aging of microstructural compartments in human compact bone,”
J. Bone Miner. Res., 18
(6), 1012
–1019
(2003). http://dx.doi.org/10.1359/jbmr.2003.18.6.1012 JBMREJ 0884-0431 Google Scholar
J. A. Timlin, A. Carden and M. D. Morris,
“Chemical microstructure of cortical bone probed by Raman transects,”
Appl. Spectrosc., 53
(11), 1429
–1435
(1999). http://dx.doi.org/10.1366/0003702991945786 APSPA4 0003-7028 Google Scholar
B. Hofstetter et al.,
“Effects of alendronate and risedronate on bone material properties in actively forming trabecular bone surfaces,”
J. Bone Miner. Res., 27
(5), 995
–1003
(2012). http://dx.doi.org/10.1002/jbmr.1572 JBMREJ 0884-0431 Google Scholar
S. Gamsjaeger et al.,
“Bone material properties in actively bone-forming trabeculae in postmenopausal women with osteoporosis after three years of treatment with once-yearly Zoledronic acid,”
J. Bone Miner. Res., 26
(1), 12
–18
(2011). http://dx.doi.org/10.1002/jbmr.180 JBMREJ 0884-0431 Google Scholar
S. Gamsjaeger et al.,
“Effects of 3 years treatment with once-yearly zoledronic acid on the kinetics of bone matrix maturation in osteoporotic patients,”
Osteoporos. Int., 24
(1), 339
–347
(2013). http://dx.doi.org/10.1007/s00198-012-2202-8 OSINEP 1433-2965 Google Scholar
S. Gamsjaeger et al.,
“Transmenopausal changes in trabecular bone quality,”
J. Bone Miner. Res., 29
(3), 608
–617
(2013). http://dx.doi.org/10.1002/jbmr.2073 JBMREJ 0884-0431 Google Scholar
P. Roschger et al.,
“Validation of quantitative backscattered electron imaging for the measurement of mineral density distribution in human bone biopsies,”
Bone, 23
(4), 319
–326
(1998). http://dx.doi.org/10.1016/S8756-3282(98)00112-4 8756-3282 Google Scholar
B. M. Misof et al.,
“Bone material properties in premenopausal women with idiopathic osteoporosis,”
J. Bone Miner. Res., 27
(12), 2551
–2561
(2012). http://dx.doi.org/10.1002/jbmr.1699 JBMREJ 0884-0431 Google Scholar
M. Grynpas,
“Age and disease-related changes in the mineral of bone,”
Calcif. Tissue Int., 53
(Suppl. 1), S57
–S64
(1993). http://dx.doi.org/10.1007/BF01673403 CTINDZ 0171-967X Google Scholar
L. Galvis et al.,
“Polarized Raman anisotropic response of collagen in tendon: towards 3D orientation mapping of collagen in tissues,”
PLoS One, 8
(5), e63518
(2013). http://dx.doi.org/10.1371/journal.pone.0063518 1932-6203 Google Scholar
M. Kazanci et al.,
“Raman imaging of two orthogonal planes within cortical bone,”
Bone, 41
(3), 456
–461
(2007). http://dx.doi.org/10.1016/j.bone.2007.04.200 8756-3282 Google Scholar
M. Kazanci et al.,
“Bone osteonal tissues by Raman spectral mapping: orientation-composition,”
J. Struct. Biol., 156
(3), 489
–496
(2006). http://dx.doi.org/10.1016/j.jsb.2006.06.011 JSBIEM 1047-8477 Google Scholar
S. Gamsjaeger et al.,
“Cortical bone composition and orientation as a function of animal and tissue age in mice by Raman spectroscopy,”
Bone, 47
(2), 392
–399
(2010). http://dx.doi.org/10.1016/j.bone.2010.04.608 8756-3282 Google Scholar
G. Falgayrac et al.,
“New method for Raman investigation of the orientation of collagen fibrils and crystallites in the Haversian system of bone,”
Appl. Spectrosc., 64
(7), 775
–780
(2010). http://dx.doi.org/10.1366/000370210791666255 APSPA4 0003-7028 Google Scholar
S. Wartewig, IR and Raman Spectroscopy: Fundamental Processing, Wiley-VCHWeinheim, Germany,2003). Google Scholar
P. Roschger et al.,
“Bone mineralization density distribution in health and disease,”
Bone, 42
(3), 456
–466
(2008). http://dx.doi.org/10.1016/j.bone.2007.10.021 8756-3282 Google Scholar
P. Roschger et al.,
“A new scanning electron microscopy approach to the quantification of bone mineral distribution: backscattered electron image grey-levels correlated to calcium K alpha-line intensities,”
Scanning Microsc., 9
(1), 75
–86
(1995). SCMIEU 0891-7035 Google Scholar
J. Goldstein et al., Scanning Electron Microscopy and X-ray Microanalysis, Springer, New York
(2003). Google Scholar
M. Kerschnitzki et al.,
“Architecture of the osteocyte network correlates with bone material quality,”
J. Bone Miner. Res., 28
(8), 1837
–1845
(2013). http://dx.doi.org/10.1002/jbmr.1927 JBMREJ 0884-0431 Google Scholar
M. Pelletier,
“Quantitative analysis using Raman spectrometry,”
Appl. Spectrosc., 57
(1), 20A
–42A
(2003). http://dx.doi.org/10.1366/000370203321165133 APSPA4 0003-7028 Google Scholar
E. Landi et al.,
“Carbonated hydroxyapatite as bone substitute,”
J. Eur. Ceram. Soc., 23
(15), 2931
–2937
(2003). http://dx.doi.org/10.1016/S0955-2219(03)00304-2 JECSER 0955-2219 Google Scholar
F. C. McLean and M. R. Urist, Bone: Fundamentals of the Physiology of Skeletal Tissue,
(1968). 8756-3282 Google Scholar
A. Ravaglioli et al.,
“Mineral evolution of bone,”
Biomaterials, 17
(6), 617
–622
(1996). http://dx.doi.org/10.1016/0142-9612(96)88712-6 BIMADU 0142-9612 Google Scholar
K. J. Obrant and R. Odselius,
“Electron microprobe investigation of calcium and phosphorus concentration in human bone trabeculae—both normal and in posttraumatic osteopenia,”
Calcif. Tissue Int., 37
(2), 117
–120
(1985). http://dx.doi.org/10.1007/BF02554829 CTINDZ 0171-967X Google Scholar
R. D. Bloebaum, J. L. Holmes and J. G. Skedros,
“Mineral content changes in bone associated with damage induced by the electron beam,”
Scanning, 27
(5), 240
–248
(2005). http://dx.doi.org/10.1002/sca.v27:5 SCNNDF 0161-0457 Google Scholar
W. H. Bergstrom and W. M. Wallace,
“Bone as a sodium and potassium reservoir,”
J. Clin. Invest., 33
(6), 867
–873
(1954). http://dx.doi.org/10.1172/JCI102959 JCINAO 0021-9738 Google Scholar
S. Gourion-Arsiquaud et al.,
“Spatial variation in osteonal bone properties relative to tissue and animal age,”
J. Bone Miner. Res., 24
(7), 1271
–1281
(2009). http://dx.doi.org/10.1359/jbmr.090201 JBMREJ 0884-0431 Google Scholar
R. Havaldar, S. Pilli and B. Putti,
“Effects of magnesium on mechanical properties of human bone,”
IOSR J. Pharm. Biol. Sci., 7
(3), 8
–14
(2013). IJPBM5 2319-7676 Google Scholar
B. Wopenka and J. D. Pasteris,
“A mineralogical perspective on the apatite in bone,”
Mater. Sci. Eng. C., 25
(2), 131
–143
(2005). http://dx.doi.org/10.1016/j.msec.2005.01.008 MSCEEE 0928-4931 Google Scholar
C. Meneghini et al.,
“Rietveld refinement on X-ray diffraction patterns of bioapatite in human fetal bones,”
Biophys. J., 84
(3), 2021
–2029
(2003). http://dx.doi.org/10.1016/S0006-3495(03)75010-3 BIOJAU 0006-3495 Google Scholar
H. Gupta et al.,
“Mechanical modulation at the lamellar level in osteonal bone,”
J. Mater. Res., 21
(08), 1913
–1921
(2006). http://dx.doi.org/10.1557/jmr.2006.0234 JMREEE 0884-2914 Google Scholar
BiographyAndreas Roschger received his MSc degree in technical physics 2011 at the Vienna University of Technology. He is a PhD student at the Humboldt Universität zu Berlin. He is employed by the Ludwig Boltzmann Institute of Osteology and is working in close cooperation with the Max Planck Institute of Colloids and Interfaces. His current research interest is the characterization of bone using a combination of quantitative backscattered electron imaging with spectroscopical and optical methods. Stéphane Blouin received his PhD in physiology and human physiopathology in 2006 from the University of Angers, France. Since 2007, he has worked as a postdoctoral at the Ludwig Boltzmann Institute of Osteology, Vienna, Austria. His research interests include local mechanical bone properties characterization, scanning acoustic microscopy, and quantitative backscattered electron imaging. |
||||||||||||||||||||||||