
|
|
1.IntroductionBreast cancer is the most common malignancy and second leading cause of cancer deaths among women in the United States.1 Additionally, prostate cancer is the most commonly diagnosed solid tumor in US men.2 Although the etiology of both diseases is not fully understood, hormones have been found to play a driving oncogenic role and prominent current therapeutic options involve targeting the estrogen (ER)/progesterone (PR) receptor and androgen receptor (AR) signaling axes, respectively. Consequently, much of the research into breast and prostate cancers has focused on genes that are involved in the estrogen/progesterone and androgen signaling pathways. Despite extensive research efforts, the precise molecular events leading to the initiation and progression of these diseases are still largely unknown. One of the most common striking effects of hormones on the both human breast and prostate cancer cell lines (T47D and LNCaP) is the synthesis and accumulation of lipids. Most of the cancer cells exhibit high rates of de novo lipid synthesis. The lipid synthesis plays an important role in membrane formation to allow for cell proliferation, cell cycle progression, and cytokinesis.3 Cancer cells require more energy than normal cells, being dependent on aerobic glycolysis and increased glutaminolysis.4 In addition to these mechanisms, cancer cells have very well defined pathways to facilitate fat metabolism. Fatty acids are obtained from endogenous de novo biosynthesis or from dietary sources and can be used for energy storage in the form of cytoplasmatic lipid droplets (LDs). These LDs contain neutral lipids, such as triacylglycerides (TAG) and steryl esters, and are surrounded by a monolayer of phospholipids and proteins.5–7 The fatty acid biosynthesis requires the activation of enzymes that lead to the production of a 16-carbon chain of saturated fatty acid (16:0, palmitate),4,8,9 which serves as a precursor for the generation of longer chain and unsaturated fatty acids such as oleic acid (). Hormones that bind steroid receptors in cancer cells (such as AR and PR) are known to induce the lipid synthesis program inside the cells.10,11 Palmitic and oleic acids are abundantly made by the cancer cells in response to hormone treatment, and pharmacological inhibition of their synthesis has been shown to decrease cancer cell viability and resistance to chemotherapy agents.12 Thus, accumulation of LDs inside cancer cells seems to be a hallmark of cancer metabolism and growth that can be exploited for biomarker discovery. Lipid content is usually analyzed by using gas chromatography/mass spectroscopy,12 but the cellular dynamics and the lipids distribution are lost during the homogenization process. Moreover, these techniques cannot be used in vivo or for live cell studies. With the development of the laser, Raman spectroscopy became a powerful tool for characterization of biological samples. The Raman spectrum provides a measure of the vibrational mode density of molecules that can be translated to biochemical content. In the spontaneous Raman process, Fig. 1(a), a narrow band laser illuminates the sample and a portion of the incident photons is scattered by interactions with molecular vibrations, resulting in a shift to higher (anti-Stokes) or lower frequency (Stokes) photons. The signal intensity is very weak because of the extremely low scattering cross section () The region between 300 and , called the fingerprint region, gives the vibrational modes associated with DNA, proteins, and lipids. The stretch occurs around and it is associated with lipid content. Raman spectroscopy can distinguish between healthy and unhealthy cells and cancerous and nonmalignant cells.13,14 Thus, Raman spectroscopy is a powerful technique for label-free identification and characterization with potential for translation to biomedical and clinical applications. Fig. 1Principle of Raman scattering mechanisms of (a) spontaneous Raman and (b) narrowband CARS shown by Jablonski diagram (energy level diagram). Arrows represent photons (longer length denotes higher photon energy), is the vibrational level, is the resonant vibrational frequency of a given vibrational mode. For CARS, the laser source consists of two time-locked pulse trains of different wavelengths (pump + stokes) such that the difference in photon energy corresponds to the vibrational mode to be imaged. The anti-Stokes photon is detected indicating the strength of the signal at a given vibrational mode.  In order to study the size distribution of intracellular LDs, we employed coherent anti-Stokes Raman scattering (CARS) microscopy. CARS is a nonlinear optical method that combines chemical and physical specificity with high-resolution three-dimensional imaging, without labeling of the biological sample.15 In the CARS process, two laser beams with different wavelengths (816 nm—pump/probe beams and 1064 nm—Stokes beam) coherently excite a particular vibrational mode, Fig. 1(b). In this case, the mode excited is the stretch vibrational mode at , predominately from lipids. Therefore, the signal intensity of CARS is a measurement of the lipid concentration and occurs for LDs and the cell membrane. CARS has been applied in biomedical microscopy to image live cells at video rates without extrinsic fluorescence dye labeling.16–19 With the capability to detect lipid-rich structures, CARS microscopy has been employed in numerous studies to measure lipid content in tissues and cells to study various disease models.20–23 The lipid amount, LD number and size, and lipid composition were determined by ex vivo and in vivo CARS imaging of mice intestine during dietary fat absorption.24 In this study, we investigated whether the synthetic female hormone medroxyprogesterone acetate (MPA) and the synthetic androgen R1881 affect the lipid content and composition in breast (T47D, MDA-MB-231) and prostate (LNCaP, PC3) cancer cells. We observed abundant lipid accumulation in hormone responsive breast and prostate cancers (T47D and LNCaP) treated with MPA or R1881, respectively. As controls, we used two cell lines (MDA-MB-231 and PC3) that lack hormone receptors and therefore do not accumulate much lipid in response to treatment. We characterized lipid composition using Raman spectroscopy. Analysis of the Raman spectra acquired from LDs provided the degree of unsaturation and relative concentrations of different fatty acid species. We characterized the increase in quantity and size of intracellular LDs in hormone responsive cells using CARS microscopy and image analysis. Differences in these metrics between hormone treated and untreated cells are presented and discussed. 2.Methods2.1.Cell PreparationBreast and prostate cancer cells were grown directly on coverslips (MatTek 35 mm glass bottom dishes no. 1, poly-d-lysine coated) until they were confluent. They were subsequently treated with MPA at (T47D cells and MDA-MB-231) or with R1881 hormone at 10 nM (LNCaP and PC3) or the vehicle (ethanol) as a control. After 4 days of treatment, the cells were fixed with 4% formaldehyde for 10 min and rinsed with phosphate buffered saline (PBS). For each cell sample, 28 to 32 individual cells were measured with 10 to 20 Raman spectra acquired per cell. Data were acquired with a custom built confocal Raman microscope equipped with an automated scanning stage to acquire point Raman spectra at different sample positions. The cancer cells were provided by the Tissue Culture Core Facility at the University of Colorado, Denver. 2.2.Experimental Setup2.2.1.Confocal Raman microscopeVibrational Raman spectra were acquired with a custom confocal Raman microscope. The system was built in back-scattering geometry using an Olympus IX70 inverted research microscope. The excitation source is a narrow linewidth, 785 nm diode laser (Innovative Photonic Solutions, Monmouth Junction, New Jersey) that delivers 45 mW maximum power onto the sample. The excitation laser beam is first expanded and collimated using a telescope (, ), reflected off of a dichroic mirror (Semrock, 785 nm RazorEdge) into the microscope to fill the back aperture of a water immersion IR objective (Olympus, Center Valley, Pennsylvania, UPlanSApo IR, ). The objective focuses the beam onto the sample with a focal spot measured to be . The scattered radiation is collected and collimated by the same objective lens and passes back through the dichroic. To further reject the inelastically scattered photons, the collimated beam is passed through a long-pass filter (Semrock, Rochester, New York, 785 nm Razor Edge Ultrastep) with a cutoff at 786.7 nm and a rejection OD of 6. The signal beam is then focused with a lens, , onto the center of a pinhole of diameter, , to achieve confocal confinement. The pinhole is imaged with a demagnifying telescope (, ) onto the entrance slit of a Czerny-Turner style imaging spectrograph (Acton SP2300 series, Princeton Instruments, Trenton, New Jersey). A grating spectrally disperses the signal onto the sensor plane of a back-illuminated, cooled CDD camera (Pixis 100, Princeton Instruments, Trenton, New Jersey). A flipper mirror is inserted before the long-pass filter in order to obtain a white light image of the sample on a CMOS camera for alignment. Multiple micro-Raman point measurements were acquired on intracellular LDs for each sample using a motorized scanning stage (ASI Inc. Eugene, Oregon, MS-2000) controlled by custom software written in C. Each point Raman spectra was obtained by averaging five acquisitions each with an integration time of 20 s. 2.2.2.CARS and two-photon microscopeCARS microscopy was performed on a laser scanning confocal microscope (Olympus FV-1000) optimized for CARS and two-photon autofluorescence (TPAF) imaging. In the CARS process, two time-locked pulsed laser beams with different wavelengths coherently excite a particular vibrational mode. The particular vibrational mode excited is given by the difference in photon energy. For imaging lipids, laser wavelengths of 816 and 1064 nm are used to excite the vibrational mode corresponding to the stretch vibration. The laser source used in our setup is a combined optical parametric oscillator pumped by a doubled pulsed 1064 nm laser (PicoEmerald, Berlin, Germany, HighQ Lasers) operating at an 80 MHz repetition rate with the pulse durations of for the 1064 nm output and to 6 ps for the output at 816 nm. The laser power at the sample is for the 816 nm laser beam and for the 1064 nm laser beam. Repeated scanning over the same region of the sample shows no change in the image, indicating that laser damage does not occur at these powers. The Olympus FV-1000 microscope is an inverted microscope with four external nondescanned photomultiplier detectors—two detectors in the epi-direction to detect back-scattered light and the other two detectors in the forward direction (detecting forward scattered light). Both the TPAF and CARS signals were measured in the epi-direction by collecting back-scattered photons through the objective. A dichroic mirror separates the TPAF signal from the CARS signal and these are detected by the two epi-detectors, respectively. Using an emission filter (hq470/100 m-2p, Chroma Technology, Bellows Falls, Vermont) in front of the first epi-detector, an autofluorescence signal between 420 and 520 nm is detected. The CARS signal is measured with the second epi-detector with a 40-nm wide emission filter centered at 660 nm (hq660/40 m-2p, Chroma Technology). The objective used is a 1.2 NA water objective (UPLSAPO IR W, Olympus). The typical pixel dwell time is 10 μs and the image pixel size is for all the acquired images. A Kalman average filter of five times was used during image acquisitions to improve the signal-to-noise ratio of the acquired images. 2.3.Raman Spectra ProcessingMicro-Raman data were processed in MATLAB using custom routines and the bioinformatics toolbox. The acquired Raman spectra contain not only the desired signal from the sample, but also a background signal containing cosmic rays and the signals from the glass coverslip and PBS solution. In order to remove the various background signals, we performed the following data processing steps: (1) cosmic rays removal,25 (2) data smoothing using a 5-point moving average filter, (3) background removal by subtracting an average of several point Raman spectra acquired off of the cell sample (glass and PBS only), (4) baseline correction using bioinformatics tool routines (msbackadj regression method with linear interpolation), (5) data normalization by the area under the curve, and (6) wavenumber calibration using polystyrene reference spectra. 2.4.Least-Squares FittingTo fit the Raman experimental data, we assume that each LD spectra can be described by a linear combination of the spectra of pure components. In this case, we wish to solve for the coefficients of the linear equation: where is the experimental LD spectrum, are coefficients, and are the pure substance spectra. To solve, we performed a least-squares fit of the data using built-in functions in MATLAB (Mathworks Inc., Natick, Massachusetts) in the Curve Fitting toolbox, constraining the coefficients to positive values. The standard deviation was calculated by fitting each individual Raman spectra acquired for a given sample, assuming a normal distribution in fit coefficients. Because the Raman signal is linearly dependent on concentration, the coefficients determine the relative concentrations of the pure species in the LDs. 2.5.Principal Component AnalysisDimensionality reduction methods such as principal component analysis (PCA) and linear discriminant analysis (LDA) have been widely applied for classification of Raman spectra.26 PCA itself is not optimal for data classification, partly because PCA builds biases that are uncorrelated. The class label does not exist in the PCA definition. The eigenvectors of the spectra covariance matrix are calculated and those that explain greater than 99% of the data variability are selected for further processing. The first principal component (PC1) accounts for the most variance among the data. We find we can elucidate differences between similar spectra if we graph different PCs against each other. When we think of a better algorithm to find discriminant directions, then a good example is the Fischer’s LDA.27 This model is based on finding the line that best separates the classes. The variance between groups is maximized and the variance within a group is minimized according to Fisher’s criterion. Therefore, a combination of PCA and LDA gives a better performance. The first features (eigenvectors) extracted from PCA are projected onto a lower dimensional space using LDA to form a spectral clustered representation. The overall test error is evaluated and the precision, sensitivity, and specificity are consequently calculated. 2.6.Lipid Size Distribution AnalysisTPAF and CARS images were processed in ImageJ for enumeration and size analysis of intracellular LDs. All images were taken under similar acquisition conditions; therefore, we used the same parameters for each image when performing image thresholding, filtering, edge detection, and counting. Using the three-dimensional object counter function in ImageJ [with a height of 0 for two-dimensional (2-D) images] we generated the statistics for LD counts and surface voxel number (size). We further imported the statistical data into MATLAB to generate plots of LD size distribution. 3.Results and Discussion3.1.Lipids Biomarkers by Micro-Raman SpectroscopyMean Raman spectra, Fig. 2, were obtained for low-wavenumber (850 to ) and high-wavenumber (2750 to ) regions for two breast cancer cell lines, T47D and MDA-MB-231, treated with MPA or ethanol (vehicle, V), and two prostate cancer cell lines, LNCaP and PC3, treated with R1881 or ethanol (vehicle, V) for 4 days. For each sample, 28 to 32 individual cells were measured with 10 to 20 spectra measured for each cell. Figure 2 shows that significant spectral differences between treated (MPA and R1881) and untreated (V) cells exist in both wavenumber ranges for the cell lines LNCaP and T47D. Differences were minimal for the cell lines MDA-MB-231 and PC3, which did not respond to the treatment. The specific Raman peaks responsible for the differences observed in the spectra are readily assigned to known lipid vibrational modes (Table 1), and are sensitive to differences in lipid composition within cytoplasmic LDs. The analysis of these spectral features is described below. Fig. 2Average Raman spectra of treated versus vehicle (control) cancer cells. Panels (a) and (b) are the low- and high-wavenumber regions, respectively, of spectra acquired from the breast cancer cell lines T47D and MDA-MB-231. Panels (c) and (d) are low and high wavenumber spectra, respectively, of prostate cancer cell lines LNCaP and PC3. Also displayed at the bottom of each plot are the difference spectra (mean subtraction). The most pronounced changes between spectra of treated and control cell samples occurred for T47D and LNCaP cell lines in the 1250 to region and the peak at (panels a and c) as well as the high-wavenumber region (panels b and d). Raman spectra of treated and control samples for MDA-MB-231 and PC3 cell lines did not show these pronounced differences indicating minimal response to hormone treatment.  Table 1Band assignments of cancer cell lipids.28,29
Note: ν and δ indicate stretching and deformation vibrations, respectively. 3.2.Lipid Composition AnalysisLDs in cells consist of a neutral lipid core (primarily TAGs and cholesteryl esters) enclosed by a phospholipid membrane. TAGs consist of a glycerol molecule joined by an ester bond to three fatty acid molecules. The Raman signal from cellular LDs occurs primarily from the chemical bonds, , , , and .28–33 Unsaturated fatty acids contain more bonds (represented by the band), while saturated fatty acids contain more groups and therefore have larger Raman peaks for those vibrational modes associated with . In order to identify significant Raman spectral features associated with intracellular lipid composition, we studied various Raman peak intensity ratios corresponding to particular lipid vibrational modes (Table 2). The degree of unsaturation and chain length of fatty acid methyl esters can be well determined by analysis of Raman spectra.31 Intracellular LDs have more complex spectra than pure fatty acids (FA); however, we can use similar analysis to infer relative changes in lipid composition in our cancer cell samples. The band intensity at varies linearly with the number of bonds and for pure FAs can determine a molar unsaturation value. Alternatively, the degree of unsaturation of a pure sample can be characterized by the ratio of bonds to groups. This ratio has been shown to have a near-linear relationship with the mass unsaturation, the number of bonds per gram. The mass unsaturation can be calculated by the ratio of the ( stretching band) and [ scissor], or [ twist]. Note that these ratios vary with both the degree of unsaturation and chain length. In our measurements on pure fatty acid samples (Table 3), the mass unsaturation value of oleic acid () is half that of linoleic acid () and is 88% that of palmitoleic acid (), as expected. Table 2Summary of Raman characteristics of intracellular lipid droplets.
Table 3Summary of Raman characteristics of pure unsaturated fatty acids.a
The ratio of total unsaturated fatty acids (, olefinic stretching) to the total amount of fatty acids (, symmetric stretch) termed TUFA/TFA34 has been reported and proposed as a molecular marker for normal and tumor cells. This ratio shows similar trends for pure fatty acid samples as an indicator of the number of to species. We observe that this ratio decreases upon treatment for T47D-MPA and LNCaP-R1881 cancer cells, indicating increased saturated lipid content. Indeed, the ratio values for mass unsaturation and TUFA/TFA all indicate that for the hormone responsive cancer cell lines (T47D and LNCaP), there is an increase in saturated lipid content after treatment while the cell lines that are not hormone responsive (MDA-MB-231 and PC3) show less relative change in these ratio values upon treatment. The ester carbonyl vibrational mode position has been shown to determine the length of a fatty acid chain.31 A shift to higher wavenumbers for longer chain length fatty acids has been well characterized for fatty acid methyl esters. In our results in cancer cells, the peak position was found to vary mainly between different cell lines, but with minimal variation upon hormone treatment of the cell lines. Another measure of chain length is the ratio of and the ratio. Again, we observe more differences between the different cell lines than changes associated with hormone treatment. 3.2.1.Least-squares fittingIn order to further quantify the composition of the LDs, we performed a least-squares fit utilizing the full experimental Raman spectrum as opposed to ratios of values at particular bands. The fit assumes the experimental spectra are a linear combination of spectra of pure fatty acid components, cholesterol, and cytoplasm. A cytoplasm component is included in the fit because some amount of cytoplasm signal will be recorded if the LD size is smaller than the detection volume of the Raman microscope. The Raman spectra of pure samples in the low- and high-wavenumber regions are shown (Fig. 3). Fig. 3Pure fatty acids, cholesterol, and measured cytoplasm Raman spectra, (a) and (b) are the low- and high-wavenumber regions. The pure substances are, from the bottom to the top, oleic acid (Sigma, GC), palmitoleic acid (Sigma, , GC liquid), linoleic acid (Sigma, ), palmitic acid (Sigma, ), stearic acid (Sigma, , Grade I, GC), and cholesterol (Sigma, ). The palmitic and stearic acids were melted at 70°C.35  We performed fits for low- and high-wavenumber regions for hormone responsive cells (T47D and LNCaP) to compare changes in intracellular lipid composition upon hormone treatment. Results for low wavenumber fits are shown in Figs. 4(a) and 4(b). The fit coefficients correspond to relative concentrations of the given pure substance in the LDs. The low wavenumber data resulted in fits with lower standard deviations. This is likely due to the fact that the low wavenumber spectra have more discrete peaks that can be better separated in the fitting routine. We performed fits with and without the cytoplasm and cholesterol spectra and did not observe any significant differences in the relative concentrations of the fatty acids. When including cholesterol spectra in our least squares fit, we observed a trend of reduced cholesterol concentration in the LDs of between 5% and 10%. We could not state accurately the relative concentrations of cholesterol compared to fatty acids because we were comparing Raman spectra in the solid state to estimate the contribution in the LDs, which may have different density values. It will take further investigation to determine if accurate cholesterol concentrations can be obtained from Raman spectra results. Fig. 4Relative concentrations of fatty acids from least squares fit of experimental Raman measurements of lipid droplets (LDs) for T47D (a) and LNCaP (b) cell lines with (MPA and R1881) and without (vehicle) hormone treatment. Standard deviations are shown. (Abbreviations: OA, oleic acid; POA, palmitoleic acid; LOA, linoleic acid; Palm, palmitic acid; and Stear, stearic acid).  As an additional metric, we looked at the relative concentrations between the saturated fatty acids (palmitic and stearic) and unsaturated fatty acids (oleic, palmitoleic, and linoleic). This can be represented as a percent saturation (namely saturated FA concentration divided by total FA concentration). For T47D, the percent saturation was for vehicle (control) and for MPA treated. For the LNCaP cell line, the percent saturation was for vehicle (control) and for R1881 treated cells. Results for T47D indicate an increase in the relative amount of saturated fatty acids (palmitic and stearic) to unsaturated in the LDs of MPA-treated cells. These results are in agreement with our previous report,12 where treatment with MPA leads to increased palmitate accumulation in triglycerides analyzed by chromatography methods. We observed a similar trend for the prostate cancer cell line LNCaP treated with R1881. The decrease in cholesterol content with MPA or R1881 treatment was unexpected but may suggest that excess palmitic and oleic acids are preferentially shunted to triglycerides instead of cholesteryl esters, a concept already proposed in other models of LD accumulation.36 The meaning of this change in cholesterol distribution in cancer cells treated with hormones is currently unknown, but can open up interesting avenues for further investigations into the role of cholesterol in cancer malignancy. 3.3.Cancer Cell Line ClassificationMultivariate statistical analysis is usually employed for Raman spectra classification of different types of tissue samples for diagnostic sensitivity and specificity assessment. We combined PCA and LDA to obtain a performance of the cancer cells’ discrimination as a function of various lipid signatures. PCA reduces the dimensionality of the data set and builds up the variables necessary for the LDA for a better explanation of the differences among various classes. Fischer’s linear discriminant algorithm is used for determining the parameters of LDA. The Fischer algorithm uses a linear function to project the -dimensional data onto a line and to maximize the ratio of the variances between each of the two classes to the variance within each class.27 We performed PCA analysis for low and high wavenumbers to obtain the eigenvectors with the largest eigenvalues for the greatest variations. We used half of the sample sets specified in Table 4 as the actual group and the other half for the predicted group. For the T47D breast cancer cell line, we chose the first 8 to 10 eigenvectors and for the LNCaP prostate cancer cell line, we used the first 8 to 12 eigenvectors. We imported the eigenvectors from PCA into the LDA classifier to form a cluster representation of the components. For the T47D treated versus untreated breast cancer cells, large differences in Raman spectra were observed in the low-wavenumber region giving a classifier accuracy, sensitivity, and specificity of 100% [Table 4(a)]. For the high-wavenumber region, the sensitivity was 100% and specificity 85.71%. The test error was 0.071. In the case of LNCaP treated and untreated groups, the overall accuracy for low-wavenumber region was 87.33% and the test error was 0.133. We calculated an accuracy of 96.88%, sensitivity of 100%, and specificity of 90.91% for the high-wavenumber region [Table 4(b)]. Both classifiers have . Table 4Confusion matrix (a) for breast cancer cell lines using LDA classifier in the 850 to 1800 cm−1 wavenumber region and (b) for prostate cancer cell lines using LDA classifier in the 2750 to 3030 cm−1 wavenumber region.
3.4.Label-Free Imaging of Lipid Dynamics Using CARS and TPAFWe recorded simultaneous TPAF and CARS images for each of the hormone responsive cancer cell lines, T47D (Fig. 5) and LNCaP (Fig. 6), with and without hormone treatments. The CARS signal in the epi-direction provides excellent contrast for the intracellular LDs while autofluorescence allows individual cells to be identified. The CARS images were postprocessed with custom routines developed in ImageJ to detect the centroid of each LD and calculate the diameter. We noticed from these images that T47D treated with MPA, Fig. 7(a), and LNCaP treated with R1881, Fig. 7(b), contain an increased number and size of LDs than the T47D and LNCaP treated with ethanol. Although we only used 2-D images for our analysis, we were able to well sample the intracellular LDs because cells were grown in a single layer on the coverslip. With 2-D analysis, we quantify the increase in number and size of LDs upon the treatment for both cell lines. We conclude that changes in LD size and quantity can be determined from CARS imaging and that this provides a noninvasive means to study lipogenesis in cancer cells. Fig. 5Autofluorescence and CARS images of treated versus vehicle control breast cancer cells. Panels (a) T47D-MPA autofluorescence image, (b) T47D-MPA CARS image, (c) T47D-V autofluorescence image, and (d) T47D-V CARS image, (scale bar 30 μm). 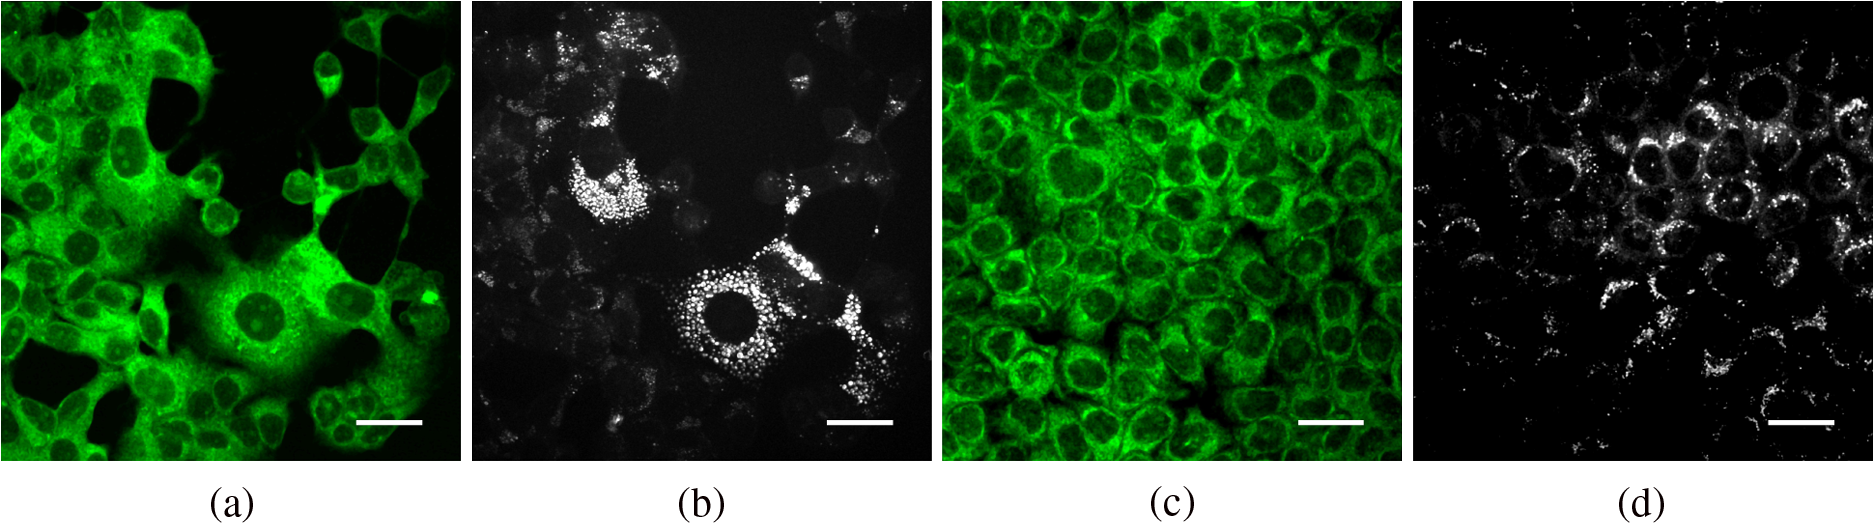 4.ConclusionsCARS microscopy and micro-Raman spectroscopy were utilized to investigate changes in intracellular lipids in breast (T47D, MDA-MB-231) and prostate (LNCaP, PC3) cancer cells upon exposure to the hormone MPA or the synthetic androgen R1881, respectively. For the hormone responsive cell lines T47D and LNCaP, differences were noted in the Raman spectral regions at 830 to 1800 and 2800 to due to hormone-mediated lipogenesis. Hormone treatment of these cell lines resulted in increases in the numbers and sizes of LDs and increases in the relative amount of saturated lipids. The increases in saturated lipid content were calculated by taking the ratios of Raman peaks associated with or vibrational modes. In addition, least-squares fitting of the Raman spectra of LDs using Raman spectra of pure fatty acids was performed in order to determine the relative concentrations of different fatty acids within LDs. The changes in fatty acid content and degree of saturation from Raman measurements are in agreement with the previously reported measurements by chromatography methods.12 Importantly, we were able to capture the differences in lipid composition inside the LDs using optical spectroscopy, which can be applied nondestructively to study live cells. PCA-LDA was performed on the Raman spectra of individual cells showing an ability to differentiate between hormone treated versus untreated T47D and LNCaP cancer cells with high accuracy, sensitivity, and specificity. The way hormones contribute to malignant growth is an area of intensive research and progestins and androgens are known to drive tumor growth development,37,38 partly through changes in lipid metabolism. However, at the molecular level, there is a lack of studies connecting the fat composition of LDs and the aggressiveness of the hormone-dependent cancer growth. Therefore, our Raman-based analysis is important since hormone receptor-positive cancers are most commonly diagnosed in the clinic and their malignant growth is associated with high saturated fat intake,39 but there is no data at the molecular level that associates tumor growth and fatty acid composition. Further studies will also allow us to investigate the role of cholesterol content in breast and prostate tumors. Cholesterol is a precursor to hormones such as progestins and androgens and allows cells to make their own hormones and perpetuate their hormone-dependent growth.40 A recent study using stimulated Raman scattering imaging of human tissue biopsy samples found an increase in cholesteryl esters for higher grade and malignant prostate cancer.41 Therefore, Raman-based methods can play an important role in determining how hormones and cholesterol content affect the growth potential of cancers. Noninvasive Raman techniques also hold promise to assist in clinical monitoring and research studies of breast and prostate cancer. AcknowledgmentsFunding support was provided by a seed grant from the American Cancer Society Institutional Research Grant #57-001-53 (EAG), Defense Advanced Research Projects Agency Grant N66001-10-1-4035 (EAG), and NIH National Cancer Institute Grant 1K01CA168934 (IRS). CARS imaging experiments were performed in the University of Colorado Denver, Anschutz Medical Campus Advance Light Microscopy Core supported in part by NIH/NCATS Colorado CTSI Grant No. UL1 TR001082. Cells were obtained from the Cancer Center Tissue Culture Shared Resources Core. ReferencesP. D. BaadeD. R. YouldenL. J. Krnjacki,
“International epidemiology of prostate cancer: geographical distribution and secular trends,”
Mol. Nutr. Food Res., 53
(2), 171
–184
(2009). http://dx.doi.org/10.1002/mnfr.v53:2 MNFRCV 1613-4125 Google Scholar
J. L. Stanfordet al.,
“Vasectomy and risk of prostate cancer,”
Cancer Epidemiol., Biomarkers Prev., 8
(10), 881
–886
(1999). CEBPE4 1055-9965 Google Scholar
K. NatterS. D. Kohlwein,
“Yeast and cancer cells—common principles in lipid metabolism,”
Biochim. Biophys. Acta, 1831
(2), 314
–326
(2013). http://dx.doi.org/10.1016/j.bbalip.2012.09.003 BBACAQ 0006-3002 Google Scholar
O. Warburg,
“On the origin of cancer cells,”
Science, 123
(3191), 309
–314
(1956). http://dx.doi.org/10.1126/science.123.3191.309 SCIEAS 0036-8075 Google Scholar
T. Fujimotoet al.,
“Lipid droplets: a classic organelle with new outfits,”
Histochem. Cell Biol., 130
(2), 263
–279
(2008). http://dx.doi.org/10.1007/s00418-008-0449-0 HCBIFP 0948-6143 Google Scholar
S. O. Olofssonet al.,
“Lipid droplets as dynamic organelles connecting storage and efflux of lipids,”
Biochim. Biophys. Acta, 1791
(6), 448
–458
(2009). http://dx.doi.org/10.1016/j.bbalip.2008.08.001 BBACAQ 0006-3002 Google Scholar
F. P. Kuhajda,
“Fatty acid synthase and cancer: new application of an old pathway,”
Cancer Res., 66
(12), 5977
–5980
(2006). http://dx.doi.org/10.1158/0008-5472.CAN-05-4673 CNREA8 0008-5472 Google Scholar
C. R. SantosA. Schulze,
“Lipid metabolism in cancer,”
FEBS J., 279
(15), 2610
–2623
(2012). http://dx.doi.org/10.1111/ejb.2012.279.issue-15 1742-464X Google Scholar
J. SuburuY. Q. Chen,
“Lipids and prostate cancer,”
Prostaglandins Other Lipid Mediators, 98
(1–2), 1
–10
(2012). http://dx.doi.org/10.1016/j.prostaglandins.2012.03.003 0090-6980 Google Scholar
J. V. Swinnenet al.,
“Androgens, lipogenesis and prostate cancer,”
J. Steroid Biochem. Mol. Biol., 92
(4), 273
–279
(2004). http://dx.doi.org/10.1016/j.jsbmb.2004.10.013 JSBBEZ 0960-0760 Google Scholar
D. Chalboset al.,
“Progestin-induced fatty acid synthetase in human mammary tumors: from molecular to clinical studies,”
J. Steroid Biochem. Mol. Biol., 43
(1–3), 223
–228
(1992). http://dx.doi.org/10.1016/0960-0760(92)90211-Z JSBBEZ 0960-0760 Google Scholar
I. R. Schlaepferet al.,
“Progestin modulates the lipid profile and sensitivity of breast cancer cells to docetaxel,”
Mol. Cell. Endocrinol., 363
(1–2), 111
–121
(2012). http://dx.doi.org/10.1016/j.mce.2012.08.005 MCEND6 0303-7207 Google Scholar
H. Luiet al.,
“Real-time Raman spectroscopy for in vivo skin cancer diagnosis,”
Cancer Res., 72
(10), 2491
–2500
(2012). http://dx.doi.org/10.1158/0008-5472.CAN-11-4061 CNREA8 0008-5472 Google Scholar
J. Surmackiet al.,
“Raman imaging at biological interfaces: applications in breast cancer diagnosis,”
Mol. Cancer, 12
(48), 1
–12
(2013). http://dx.doi.org/10.1186/1476-4598-12-48 MCOACG 1476-4598 Google Scholar
J. X. Cheng,
“Coherent anti-Stokes Raman scattering microscopy,”
Appl. Spectrosc., 61
(9), 197
–208
(2007). http://dx.doi.org/10.1366/000370207781746044 APSPA4 0003-7028 Google Scholar
I. P. Imranet al.,
“Coherent anti-Stokes Raman scattering for label-free biomedical imaging,”
J. Opt., 15
(9), 094006
(2013). http://dx.doi.org/10.1088/2040-8978/15/9/094006 JOOPDB 0150-536X Google Scholar
J. P. Pezackiet al.,
“Chemical contrast for imaging living systems: molecular vibrations drive CARS microscopy,”
Nat. Chem. Biol., 7
(3), 137
–145
(2011). http://dx.doi.org/10.1038/nchembio.525 1552-4450 Google Scholar
L. Gaoet al.,
“Label-free high-resolution imaging of prostate glands and cavernous nerves using coherent anti-Stokes Raman scattering microscopy,”
Biomed. Opt. Express, 2
(4), 915
–926
(2011). http://dx.doi.org/10.1364/BOE.2.000915 BOEICL 2156-7085 Google Scholar
G. J. Tserevelakiset al.,
“Label-free imaging of lipid depositions in C. elegans using third-harmonic generation microscopy,”
PLoS One, 9
(1), e84431
(2014). http://dx.doi.org/10.1371/journal.pone.0084431 1932-6203 Google Scholar
T. T. LeS. YueJ. X. Cheng,
“Shedding new light on lipid biology with coherent anti-Stokes Raman scattering microscopy,”
J. Lipid Res., 51
(11), 3091
–3102
(2010). http://dx.doi.org/10.1194/jlr.R008730 JLPRAW 0022-2275 Google Scholar
T. LeT. HuffJ.-X. Cheng,
“Coherent anti-Stokes Raman scattering imaging of lipids in cancer metastasis,”
BMC Cancer, 9
(42), 1
–14
(2009). http://dx.doi.org/10.1186/1471-2407-9-42 BCMACL 1471-2407 Google Scholar
A. FolickW. MinM. C. Wang,
“Label-free imaging of lipid dynamics using coherent anti-stokes Raman scattering (CARS) and stimulated Raman scattering (SRS) microscopy,”
Curr. Opin. Genet. Dev., 21
(5), 585
–590
(2011). http://dx.doi.org/10.1016/j.gde.2011.09.003 COGDET 0959-437X Google Scholar
T. Hellereret al.,
“Monitoring of lipid storage in Caenorhabditis elegans using coherent anti-Stokes Raman scattering (CARS) microscopy,”
Proc. Natl. Acad. Sci. U. S. A., 104
(37), 14658
–14663
(2007). http://dx.doi.org/10.1073/pnas.0703594104 PNASA6 0027-8424 Google Scholar
J. Zhuet al.,
“A dynamic, cytoplasmic triacylglycerol pool in enterocytes revealed by ex vivo and in vivo coherent anti-Stokes Raman scattering imaging,”
J. Lipid Res., 50
(6), 1080
–1089
(2009). http://dx.doi.org/10.1194/jlr.M800555-JLR200 JLPRAW 0022-2275 Google Scholar
D. FeuersteinK. H. ParkerM. G. Boutelle,
“Practical methods for noise removal: applications to spikes, nonstationary quasi-periodic noise, and baseline drift,”
Anal. Chem., 81
(12), 4987
–4994
(2009). http://dx.doi.org/10.1021/ac900161x ANCHAM 0003-2700 Google Scholar
A. Nijssenet al.,
“Discriminating basal cell carcinoma from perilesional skin using high wave-number Raman spectroscopy,”
J. Biomed. Opt., 12
(3), 034004
(2007). http://dx.doi.org/10.1117/1.2750287 JBOPFO 1083-3668 Google Scholar
R. Fisher,
“The use of multiple measurements in taxonomic problems,”
Ann. Eugen., 7
(2), 179
–188
(1936). http://dx.doi.org/10.1111/j.1469-1809.1936.tb02137.x 0036-8075 Google Scholar
J. W. Chanet al.,
“Raman spectroscopic analysis of biochemical changes in individual triglyceride-rich lipoproteins in the pre- and postprandial state,”
Anal. Chem., 77
(18), 5870
–5876
(2005). http://dx.doi.org/10.1021/ac050692f ANCHAM 0003-2700 Google Scholar
L. J. den Hartighet al.,
“Fatty acids from very low-density lipoprotein lipolysis products induce lipid droplet accumulation in human monocytes,”
J. Immunol., 184
(7), 3927
–3936
(2010). http://dx.doi.org/10.4049/jimmunol.0903475 JOIMA3 0022-1767 Google Scholar
I. W. Schieet al.,
“Label-free imaging and analysis of the effects of lipolysis products on primary hepatocytes,”
J. Biophoton., 4
(6), 425
–434
(2011). http://dx.doi.org/10.1002/jbio.201000086 JBOIBX 1864-063X Google Scholar
J. R. BeattieS. E. BellB. W. Moss,
“A critical evaluation of Raman spectroscopy for the analysis of lipids: fatty acid methyl esters,”
Lipids, 39
(5), 407
–419
(2004). http://dx.doi.org/10.1007/s11745-004-1245-z LPDSAP 0024-4201 Google Scholar
C. J. FrankR. L. McCreeryD. C. B. Redd,
“Raman spectroscopy of normal and diseased human breast tissues,”
Anal. Chem., 67
(5), 777
–783
(1995). http://dx.doi.org/10.1021/ac00101a001 ANCHAM 0003-2700 Google Scholar
Y. M. Wenget al.,
“Structural analysis of triacylglycerols and edible oils by near-infrared Fourier transform Raman spectroscopy,”
Appl. Spectrosc., 57
(4), 413
–418
(2003). http://dx.doi.org/10.1366/00037020360625952 APSPA4 0003-7028 Google Scholar
C. Nievaet al.,
“The lipid phenotype of breast cancer cells characterized by Raman microspectroscopy: towards a stratification of malignancy,”
PLoS One, 7
(10), e46456
(2012). http://dx.doi.org/10.1371/journal.pone.0046456 1932-6203 Google Scholar
J. W. Chanet al.,
“Raman spectroscopic analysis of biochemical changes in individual triglyceride-rich lipoproteins in the pre- and postprandial state,”
Anal. Chem., 77
(18), 5870
–5876
(2005). http://dx.doi.org/10.1021/ac050692f ANCHAM 0003-2700 Google Scholar
Y. Fujimotoet al.,
“Long-chain fatty acids induce lipid droplet formation in a cultured human hepatocyte in a manner dependent of Acyl-CoA synthetase,”
Biol. Pharm. Bull., 29
(11), 2174
–2180
(2006). http://dx.doi.org/10.1248/bpb.29.2174 BPBLEO 0918-6158 Google Scholar
G. E. Dressinget al.,
“Progesterone receptor-cyclin d1 complexes induce cell cycle-dependent transcriptional programs in breast cancer cells,”
Mol. Endocrinol., 28
(4), 442
–457
(2014). http://dx.doi.org/10.1210/me.2013-1196 MOENEN 0888-8809 Google Scholar
J. V. Swinnenet al.,
“Androgens, lipogenesis and prostate cancer,”
J. Steroid Biochem. Mol. Biol., 92
(4), 273
–279
(2004). http://dx.doi.org/10.1016/j.jsbmb.2004.10.013 JSBBEZ 0960-0760 Google Scholar
S. Sieriet al.,
“Dietary fat intake and development of specific breast cancer subtypes,”
J. Natl. Cancer Inst., 106
(5), 1
–6
(2014). http://dx.doi.org/10.1093/jnci/dju068 Google Scholar
J. H. KimM. E. CoxK. M. Wasan,
“Effect of simvastatin on castration-resistant prostate cancer cells,”
Lipids Health Dis., 13
(56), 1
–19
(2014). http://dx.doi.org/10.1186/1476-511X-13-56 LHDIA7 1476-511X Google Scholar
S. Yueet al.,
“Cholesteryl ester accumulation induced by PTEN loss and PI3K/AKT activation underlies human prostate cancer aggressiveness,”
Cell Metab., 19
(3), 393
–406
(2014). http://dx.doi.org/10.1016/j.cmet.2014.01.019 CMEEB5 1550-4131 Google Scholar
BiographyMariana C. Potcoava received her PhD degree in applied physics from the University of South Florida in 2009. She is a research associate in bioengineering at the University of Colorado Denver, Anschutz Medical Campus. Her current research interests include optical imaging instrumentation and methods for design, evaluation, and implementation of minimally invasive biomedical devices that provide greater imaging depth, spatial resolution, and acquisition speed than currently achievable. She is a member of SPIE. Gregory L. Futia is pursuing a Ph.D. degree in bioengineering at the University of Colorado Denver, Anschutz Medical Campus. He earned a BS degree in electrical engineering from Purdue University in 2007 and an MS degree in electrical engineering from Colorado State University in 2011. His research is focused on developing image cytometry methods combined with new biomarkers for the identification of circulating tumor cells. Jessica Aughenbaugh is an undergraduate at New Mexico State University in chemical engineering. She is interested in earning a PhD degree in biological engineering, and investigating fields related to optical imaging and the application of such technology in evaluating neural anatomy. Isabel R. Schlaepfer received her PhD in integrative physiology from the University of Colorado, Boulder. She is an instructor of pharmacology at the University of Colorado Denver Anschutz Medical Campus. Her research interest focuses on the role of lipid metabolism in hormone-related cancers, using Raman spectroscopy to elucidate how lipid changes correlate with patient tumor grade and outcome. Emily A. Gibson received her PhD degree in physics from University of Colorado, Boulder specializing in nonlinear optics. She is an assistant professor in the Bioengineering Department at the University of Colorado Denver, Anschutz Medical Campus. Her research interests include the development and application of minimally invasive nonlinear optical imaging and spectroscopy for improving clinical diagnostics. |
||||||||||||||||||||||||||||||||||||||||||||||||||||||||||||||||||||||||||||||||||||||||||||||||||||||||||||||||||||||||||||||||||||||||||||||||||||||||||||||||||||||||||||||||


