
|
|
1.IntroductionRecently, brain–computer interface (BCI) has received great attention as a promising alternative communication method. People with motor disorders who cannot use typical augmentative technologies can have opportunities to communicate or control prostheses using BCI.1–3 BCI has been investigated using electroencephalography (EEG) and electrocorticography.4–6 Particularly, EEG has many advantages, such as noninvasiveness, high temporal resolution, and convenience for the user. However, susceptibility to electrical interference from the environment and difficulties with the fixation of electrodes have been reported as disadvantages.7,8 Although magnetoencephalography and functional magnetic resonance imaging have been considered as alternative modalities, they are impractical, since the instruments are large, expensive, and lack flexibility.9,10 Functional near-infrared spectroscopy (fNIRS) is one of the promising technologies for BCI. fNIRS is a powerful tool for monitoring the real-time concentration changes of hemoglobin in the blood. fNIRS has distinct advantages such as affordability, portability, and flexibility of use.11 Since the first investigation of fNIRS for measuring brain activity,12 many studies have been devoted to overcoming the drawbacks of fNIRS for BCI. Since the signal quality is affected by motion artifacts, Sato et al.,13 Cui et al.,14 and Scholkmann et al.15 proposed novel methods for the reduction of motion artifacts. Robertson et al.16 compared motion artifact reduction methods in previous studies, such as recursive linear square adaptive filtering, wavelet filtering, independent component analysis, and linear regression. As the signal strength is attenuated by hair on the head, Holper et al.,17 Coyle et al.,18 and Kozel et al.19 brushed out the hair from the measurement sites, and Young et al.20 measured the signal from participants with shaved hair. Khan et al.21 suggested novel brush optodes to overcome poor optical contact with the scalp. Because the physiological interferences (regarding cardiac and respiratory activities) overlap with the signals activated by stimulation, it is difficult to distinguish between them. Zhang et al.22,23 used an adaptive filter to effectively remove the physiological interferences. Many researchers investigated the classification of the fNIRS signal, Sitaram et al.,24 Falk et al.,25 Power et al.,26 Gottemukkula and Derakhshani,27 and Ayaz et al.28 investigated the performance of binary classification methods using a support vector machine, hidden Markov models, Gaussian mixture models, the K-nearest neighbor classifier, and the naive Bayes (NB) classifier, respectively, which are all well-known traditional classifiers. The information transfer rate (ITR) can be used to evaluate the practicability of classification.29 It is clear that the ITR depends on the accuracy of classification, which decreases with increases in the number of data classes. Because these investigations considered only the binary classification, the ITR using fNIRS for BCI was limited to 1 bit/trial.29 Multiclass classification (i.e., ternary and quaternary classifications) can theoretically provide a better chance to increase the ITR up to 2 bits/trial, while the multiclass classification makes it difficult to obtain higher classification accuracy. It is important to apply the appropriate data processing methods to improve the performance of the system. Power et al.30 used ternary classification for increasing the performance of fNIRS-based BCI. Moreover, since the bit transfer rate per minute (BPM) depends on the time, reducing the task and rest duration is another important issue. In this paper, we carried out the experiments with eight participants. During the experiments, the participants execute the four kinds of motor executions (overt left/right arm lifting and knee extension). To increase the ITR of fNIRS-based BCI, quaternary classification should be applied. Quaternary classification is usually more difficult to implement than simple binary classification. Because this is the first investigation on quaternary classification using hemodynamic responses measured from fNIRS, it may be necessary to use distinct hemodynamic responses evoked by overt motor execution instead of motor imagery.24 The task duration is reduced while maintaining a sufficient level of classification accuracy. Two different kinds of light-emitting diodes (LEDs) and avalanche photodiodes (APDs) were utilized as the sources and detectors of the system. The detected signals were filtered with band-pass and Savitsky–Golay smoothing filters as a simple method to remove the physiological and system interference.19 The hair was brushed out from the measurement sites to obtain enough intensity of the received light. The hemodynamic responses by the concentration changes of the oxy-hemoglobin were estimated using the modified Beer–Lambert law (MBLL). To increase BPM, we tried to reduce the task duration while maintaining the classification accuracy of larger than 70%. Various tasks and rest durations were set to measure the hemodynamic responses. The measured hemodynamic responses were classified using binary, ternary, and quaternary classifications. Based on the classification results, the available ITR and BPM were calculated. So far, fNIRS studies have addressed the binary classification, whereas in the present study, binary, ternary, and quaternary classifications are addressed. Moreover, the effectiveness of quaternary classification has been determined using only eight channels for fNIRS-based BCI. The available BPM estimated demonstrates the possibility of increasing the BPM of the fNIRS-based BCI. This paper is organized as follows. The experimental protocol, system setup, and the data processing method used in this study are first introduced in Sec. 2. In Sec. 3, the proper task duration to increase BPM and the classification accuracy according to the number of classes of data are explained. In Sec. 4, the present results are compared with the previous studies, and the ITR and BPM are calculated based on the estimated classification accuracy. Finally, in Sec. 5, conclusions are presented. 2.Methods2.1.Participants and Experimental ProtocolsEight healthy participants participated in the study (seven males and one female, age: 26.8 ± 1.6 years). None of the participants had histories of neurological or psychiatric issues. All the eight participants performed the experiments related to the four-class classification while only three participants among them were able to finish the experiments to determine the task duration. The experiments were approved by the Institutional Review Board of Korea University (KU-IRB-10-34-A-2). Written consent was obtained from all participants. Considering quaternary classification, it is necessary to obtain the hemodynamic responses evoked by four kinds of distinct behaviors. Since lifting up and down an arm or leg are more active movements than finger tapping, we adopted the active movements in our experiment. Figure 1 indicates the graphical motions of the active movements. Hemodynamic responses evoked by the motor tasks were collected from each participant while performing overt motor execution. Figure 2 shows the experimental design for motor execution. The task consisted of 40 cycles of 6, 8, 10, or 15-s motor task and rest. The durations of the task period () and rest period () were kept the same. The participant sat on a chair in front of a screen displaying instructions and the progress of the experiment. In the prewaiting period, a red light was displayed. At the beginning of the task period, a green light was turned on. During this period, self-paced motor execution was performed. In the rest period, the color of the light was changed from green to red. The participant was asked not to think or move while staying in the rest state. The green and red lights were turned on and off repeatedly in the task and rest periods. In the postwaiting period, a yellow light was displayed and a red light was turned on when all the periods were finished. Fig. 1Graphical motions of (a) arm lifting and (b) knee extension. Participant sits on a chair and lifts up and down his/her arm or leg. 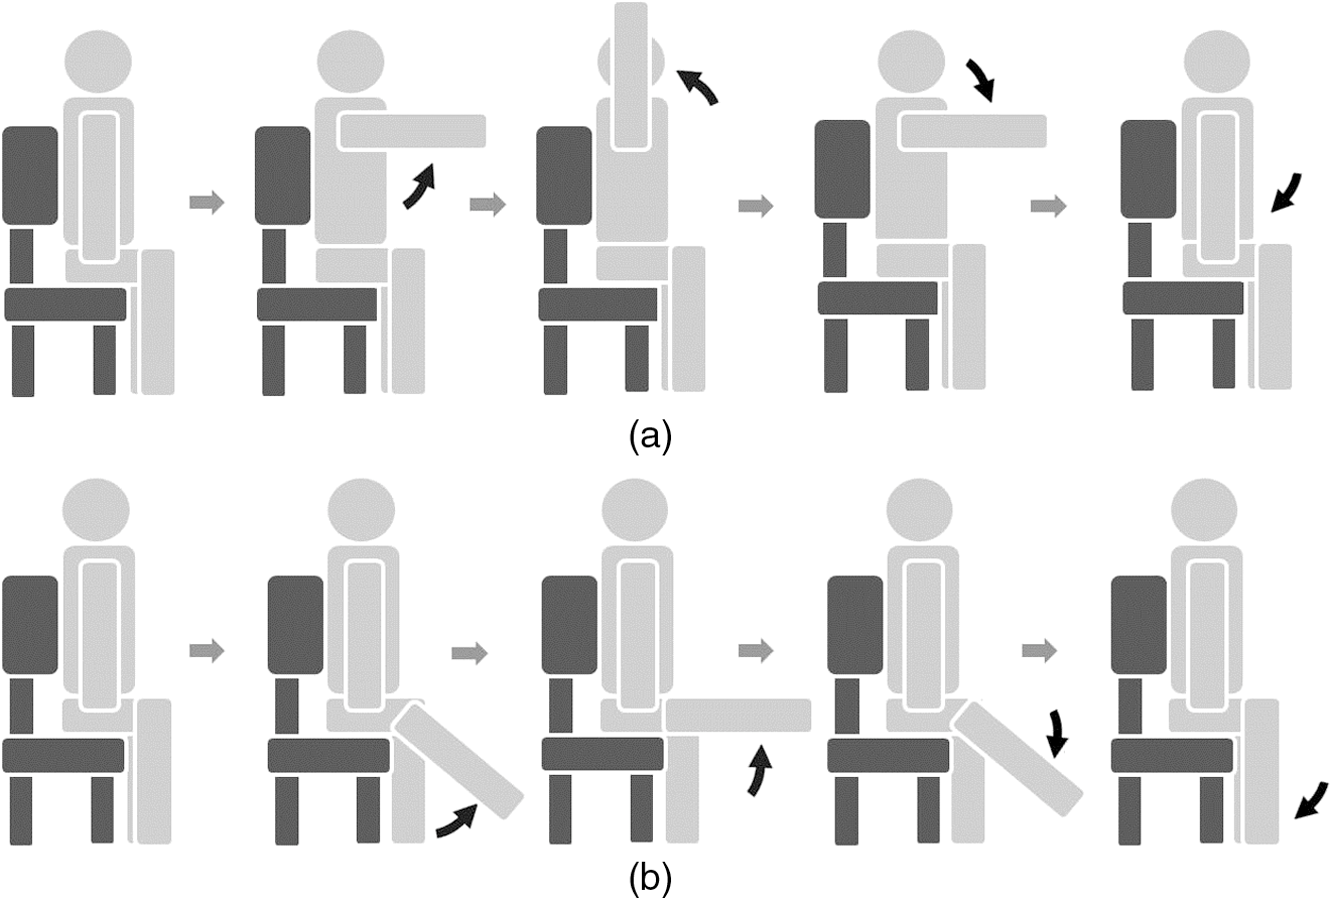 Fig. 2Experimental design of motor tasks for the measurement of hemodynamic responses using functional near-infrared spectroscopy (fNIRS). Each experiment was composed of a prewaiting time ( seconds), repetitions of rest periods for seconds and task periods for seconds, and postwaiting time ( seconds). Hemodynamic responses evoked by four kinds of motor tasks (left/right arm lifting and knee extension) were measured separately. 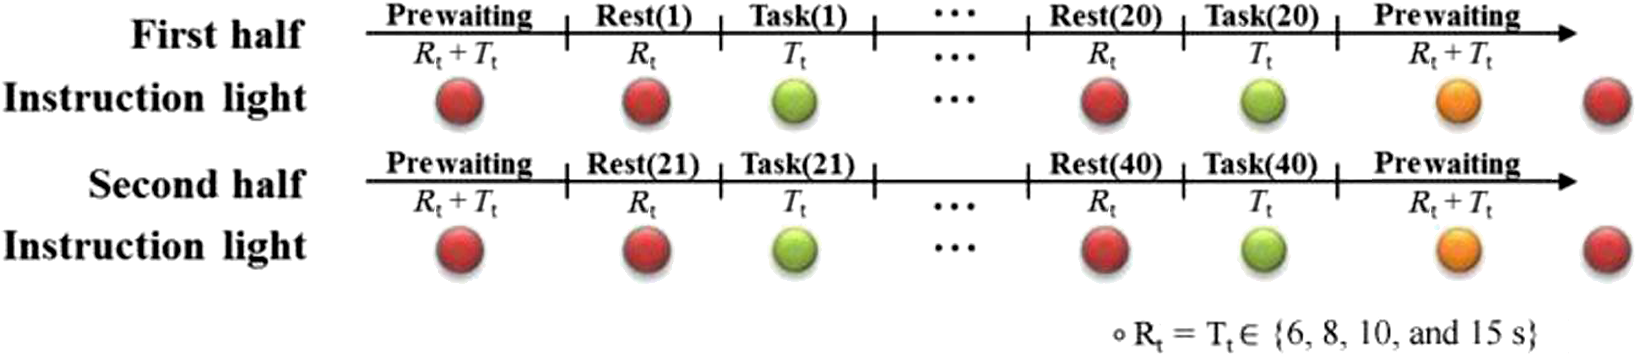 A single experimental run was composed of a prewaiting period, 40 repetitions of rest and task periods, followed by a postwaiting period. Each participant first completed 20 repetitions of the rest and task periods in the first half. After a short rest, the participant completed the same number of repetitions again in the last half. Each half experimental run (20 repetitions) lasted 264, 352, 440, and 660 s for 6, 8, 10, and 15 s per one task period (), respectively. Each participant conducted a single task repeatedly in each experimental run. Hence, four sets of experimental runs (i.e., for left/right arm lifting and knee extension) were completed for each participant. The tasks were performed in the order of left arm lifting, right arm lifting, left knee extension, and right knee extension. Between each experimental run, the participants took a rest for a minute. Each participant was allowed to do some stretching and speak lightly, but was not allowed to leave the seat during the rest period. 2.2.System Setup and Data ProcessingAll windows of the experiment room were covered by blackout curtains, and lights were turned off to keep out ambient light. An eight-channel custom-built continuous-wave fNIRS system was used to measure the hemodynamic responses. The fNIRS system uses LEDs operated at two different wavelengths of 670 nm (L6112-01, Hamamatsu photonics, Hamamatsu, Shizuoka, Japan) and 890 nm (L2656-03, Hamamatsu) which are similar to the wavelength of LEDs used by Coyle et al., because the fNIRS system used in this investigation was implemented based on their system.11 The LEDs were placed in direct contact with the scalp. The lights were modulated with 4- and 5-kHz sinusoidal waves. The detectors used in the system were APDs (C5460-01, Hamamatsu), which collected the lights via 3-mm diameter multimode optical fibers. The detected light signals were first demodulated by a lock-in amplifier implemented by LabVIEW software (National Instruments, Austin, Texas). The data were recorded by a 16-bit data acquisition card (PXI-8106, National Instruments) and downsampled with a sampling frequency of 12.5 Hz. The whole system architecture is schematically illustrated in Fig. 3. Fig. 3Block diagram of an fNIRS-based brain–computer interface (BCI) system. 670- and 890-nm LEDs are modulated at 4 and 5 kHz, respectively. Avalanche photodiodes collect the lights, which are demodulated by lock-in amplifiers. The data are recorded by a 16-bit data acquisition card. Normalization, band-pass filtering, and Savitzky–Golay smoothing are applied for signal processing. 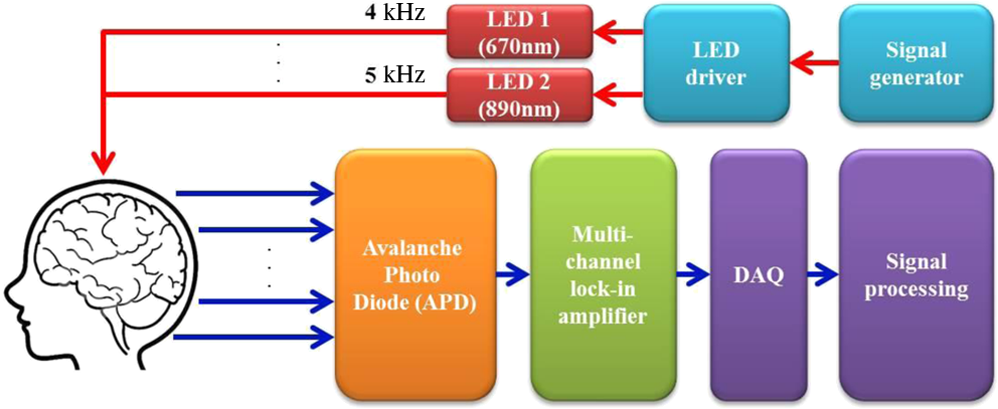 Figure 4 shows the arrangement of the fNIRS optodes. An fNIRS cap was made of elastic Lycra and shaped very similarly to a conventional EEG cap. The receiver optodes were fixed at a distance of 30 mm from the source optodes. The optodes were arranged on both sides of a hemisphere around the motor cortex areas around the , , and positions of the international 10 to 20 systems. The source and detector optode pairs consist of eight channel arrangements. The concentration changes of oxy-hemoglobin were calculated from the changes in raw optical intensity data received using the MBLL given by31 where and denote the absorption coefficients of oxy- and deoxy-hemoglobin at wavelengths and , respectively. denotes absorbance and [differential path length factor between source and detector] is the total mean path length at wavelengths and .31 Because we did not estimate a precise DPF value, a DPF of approximately 6.0 was used for both wavelengths.24Fig. 4Optode arrangements for fNIRS. Yellow and green circles represent the source (S1 and S2) and detector optodes (D1 to D7), respectively. The source and detector are spaced 30 mm apart. The optodes were placed around the motor cortex area according to the international 10 to 20 systems.  The calculated concentration changes of oxy-hemoglobin of the task and rest periods, , were normalized by subtracting the mean of the amplitude of the signal in the whole periods of each channel, and dividing by the standard deviation of the amplitude of the signal in the whole periods of each channel [i.e., ]. We used a zero-phase distortion filter (third-order Chebyshev I with a ripple factor of 0.5 dB) with a passband of 0.03 to 0.07 Hz to remove the baseline drift and physiological noise because the fundamental frequency of the evoked hemodynamic response was expected to be in the passband. If we increase the bandwidth of the BPF, the evoked hemodynamic responses can be distorted by low frequency oscillation signals.23,32 The correlation-based signal improvement method was used for minimizing the effect of head movements,14 and a third-order Savitzky–Golay smoothing filter was used to determine the smoothed values for each point.15 Figure 5 shows the measured hemodynamic responses () from all the participants evoked by left arm lifting. Participant 1 result shows the clear change of the hemodynamic responses because the participant has shaved his/her hair so as not to weaken the intensity of the light. Since participants 2 and 3 have thin hair, we could obtain the relatively distinct evoked hemodynamic responses. Figure 6 shows the time-frequency analysis results of measured from participant 1 using a continuous-time wavelet transform (Morlet wavelet). The fundamental frequency components of are explicitly presented. Fig. 5Hemodynamic responses () measured from eight participants evoked by left arm lifting (). (a)–(h) from participants 1 to 8, respectively. Shaded regions represent task durations. Twenty motor task executions are repeated. Yellow, magenta, cyan, red, green, blue, and black lines indicate the hemodynamic responses measured at D1, D2, D3, D4, D5, D6, and D7 positions, respectively.  2.3.Feature SpaceAmong (1) mean, (2) max, (3) slope, (4) delay, (5) var, and (6) median, several features were chosen individually to obtain the highest classification accuracy. Individually chosen features are presented in Table 1. We set the calculation window with a length of seconds to calculate the features after 8 s from the onset of a motor task. For example, when , the features were calculated for 15 s after 8 s from the onset of a motor task. Forty-two features were calculated for each participant [ ()]. To the best of our knowledge, this is the first investigation using the max, slope, and median in the four-class classification of fNIRS signals. Figure 7 shows the grand average of the spatial hemodynamic responses of all the participants evoked by the four kinds of motor tasks. The contralateral hemispheres were more activated by the motor tasks. Since the knee and leg areas of Homunculus are near , the knee extension activated more around (D4 position) than the arm lifting.33 From this physiological reason, we can classify the hemodynamic responses evoked by arm lifting and knee extension using the at D4. Table 1Chosen features of fNIRS signals for classification.
Fig. 7Grand average of the spatial hemodynamic responses () of all the participants evoked by motor task of (a) left arm lifting, (b) right arm lifting, (c) left knee extension, and (d) right knee extension. (a)–(d) The relatively large on the contralateral hemisphere channels. (c) and (d) The large compared with (a) and (b). Knee extension evokes larger than arm lifting at D4. 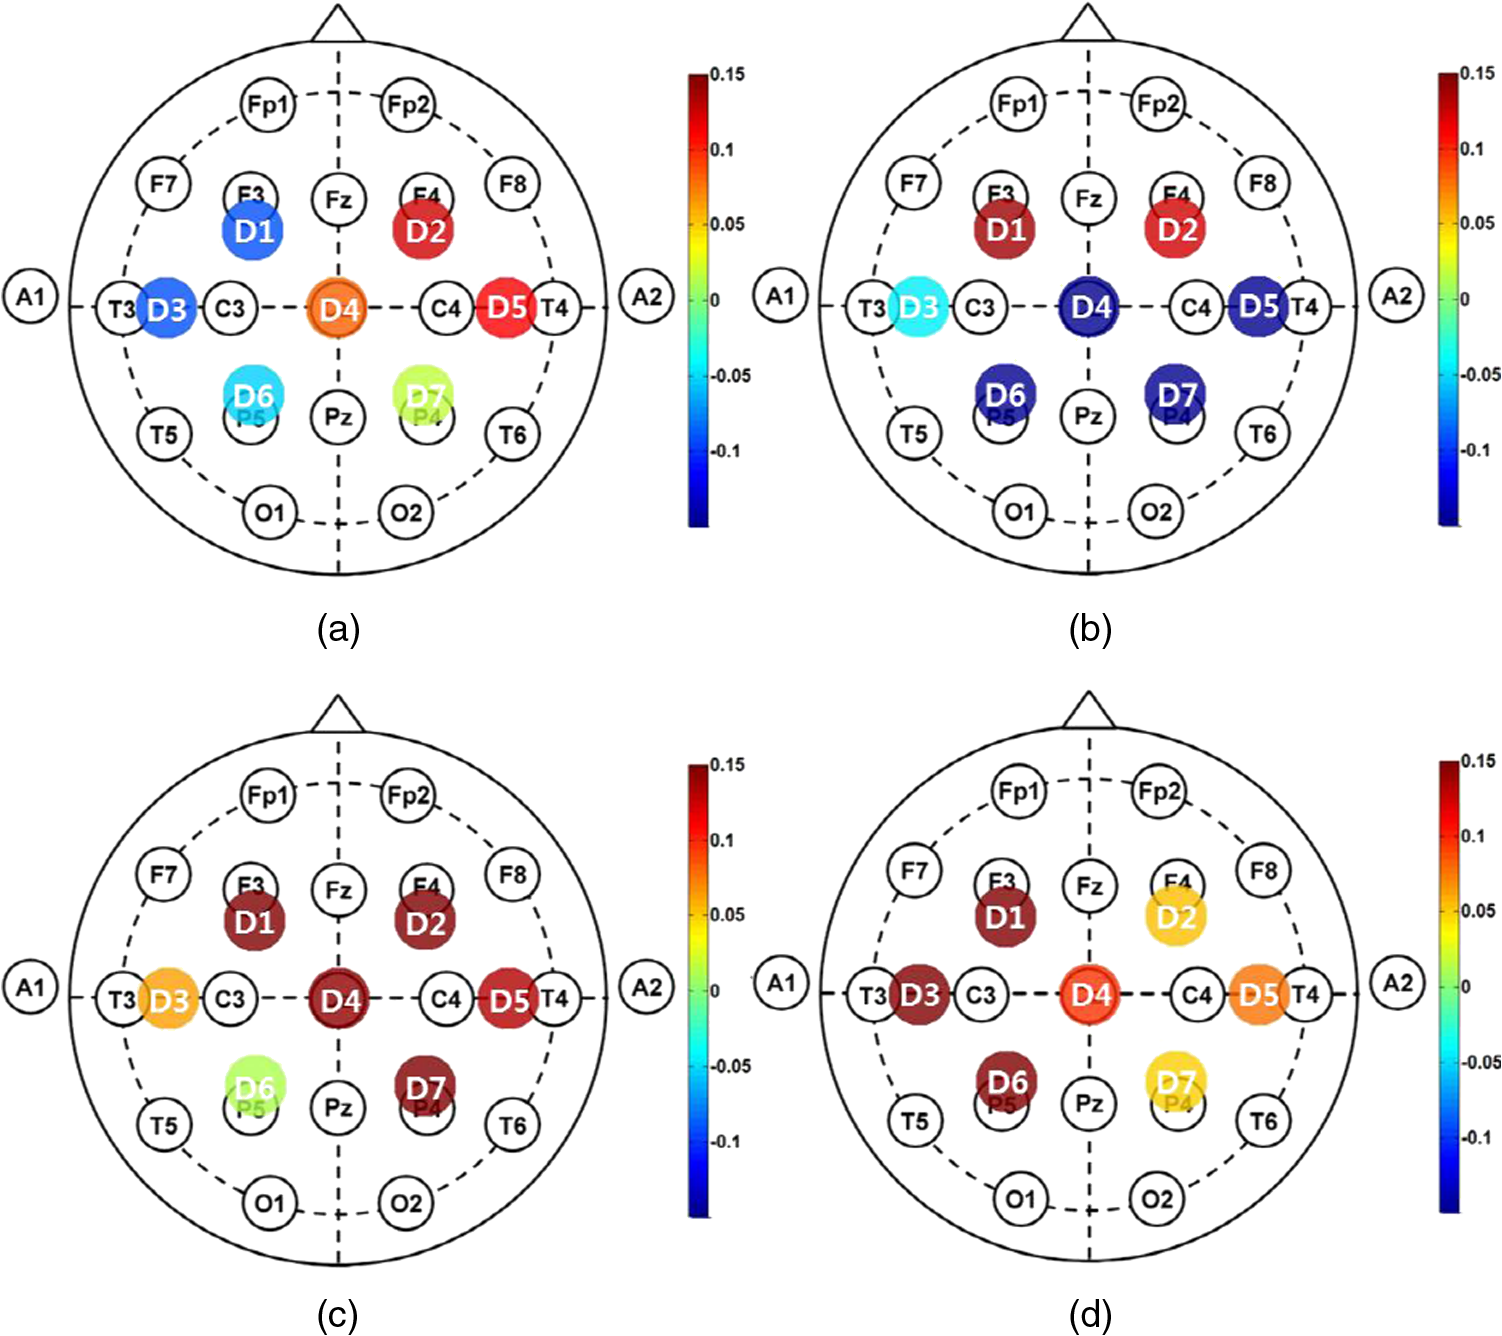 2.4.Dimension Reduction MethodA high-dimensional feature set is difficult to handle, since high dimensionality may increase the noise in the data set, which may degrade the performance of the classifier. This is known as “the curse of dimensionality.”34 To prevent this phenomenon, principal component analysis (PCA) and linear discriminant analysis (LDA) were used to reduce the dimension of each channel data.35 PCA converts a set of the correlated data into a set of the uncorrelated components. LDA maximizes the ratio of between-class variance to within-class variance in the data set.36 After that, we considered every possible dimensionality of the feature set, and the dimensionality of the feature set which shows the highest classification accuracy was found and then used. Dimension reduction was performed using the entire measured data. Figure 8 shows the signal processing flow of fNIRS signals. 2.5.Classification and Outlier EliminationThe NB classification based on the Bayesian theorem was used. NB assumes that all the features are independent. Based on the Bayes’ theorem, the sample data were classified under the maximum likelihood rule (ML rule). Outliers were eliminated to remove the unreliable data. Ten out of 40 sample data were selected as outliers. Outliers were the farthest data from the average of the measured data. After excluding the outliers, 10 runs of the threefold cross-validation method were used to validate the results using the training and validation (test) subsets. Thirty samples were randomly divided into three subsets. Each subset consisted of 10 samples. Two subsets were designated as the training subsets and the remaining subset was used for validation of the trained classifier. In the training step, NB estimates the parameters of the probability distribution of the samples by using the training samples in the training subsets. In the classification step, using the test samples in the validation subsets, NB calculates the posterior probability of the sample and determines the class of the test samples in accordance with the maximum posterior probability (i.e., he ML rule).37 Because NB only requires a small amount of training data to estimate the parameters necessary for classification, NB is extremely fast compared to other more sophisticated methods.38 2.6.Data Transfer RateThe ITR was calculated in bits/trial as follows:29 where is the number of classes of the data and is the classification accuracy to evaluate the performance of BCI. Based on ITR, the BPM can be given by3.Classification Results3.1.Task DurationNaseer and Hong39 considered various task durations with constant rest durations based on a binary classification. We estimate the proper task duration to increase BPM while maintaining a quaternary classification accuracy of larger than 70%. Figure 9 shows the average quaternary classification accuracy of four different tasks for participants 1–3 as a function of task duration. The highest classification accuracies were observed at different task durations. For participant 1, a maximum classification accuracy of 91.5% was observed at a task duration of 8 s. At a task duration of 6 s, the classification accuracy was estimated to be below 70% for all the participants according to the threshold of the sufficient classification accuracy for BCI.40–42 Among the task durations that achieve classification accuracy above 70%, values of 8 s each can be chosen as the task duration. Fig. 9Average quaternary classification accuracies as a function of the task duration. Square, circle, and triangle symbols indicate the classification accuracies of participants 1, 2, and 3, respectively. Error bar indicates the standard deviation. At a window length of 6 s, the classification accuracies of all the participants were below 70%.  3.2.Multiclass ClassificationThe classification performance of the binary, ternary, and quaternary classifications was investigated at the . For binary classification, the six combinations () of two data classes among four data classes (LA: left arm lifting, RA: right arm lifting, LK: left knee extension, and RK: right knee extension) were compared [i.e., LA versus RA), (LA versus LK), (LA versus RK), (RA versus LK), (RA versus RK), and (LK versus RK)]. Four combinations () of three data classes [i.e., LA versus RA versus LK), (LA versus RA versus RK), (LA versus LK versus RK), and (RA versus LK versus RK)], and one combination () of four data classes [i.e., LA versus RA versus LK versus RK)] were considered for ternary and quaternary classifications, respectively. Figure 10 shows the average classification accuracy of four different classes of the data for eight participants according to the number of classes of the data. The classification accuracy decreases with increases in the number of data classes. The binary classification shows the highest classification accuracy for each participant, ranging from 87.1% to 95.5%, and the quaternary classification shows the lowest classification accuracy for each participant, from 73.8% to 91.5%. Table 2 shows the average classification accuracies according to the number of data classes. The features set of each participant which showed the highest classification accuracy was selected. Because 10 runs of cross-validation were conducted, the results are presented as the . The highest classification accuracy was obtained using PCA for participants 1, 3, 6, 7, and 8, because the LDA could not be applied to the high-dimensional feature vector because of the singular scatter matrix problem.43 However, the classification accuracy obtained by LDA and applied to a low-dimensional feature vector was comparable to that obtained by PCA. Fig. 10Average classification accuracies of eight participants according to the number of data classes (, 3, and 4) for . Error bar indicates the standard deviation. The highest and lowest classification accuracies are observed when the number of classes of the data is 2 () and 4 (), respectively.  Table 2Average classification accuracies according to the number of data classes for binary, ternary, and quaternary classifications for Tt=Rt=8 s. Principal component analysis (PCA) and linear discriminant analysis (LDA) are applied, and the reduced dimensions by PCA or LDA are represented in the brackets. Among mean (1), max (2), slope (3), delay (4), var (5), and median (6), the feature sets are determined for obtaining the highest classification accuracy. Because 10 runs of cross-validation were conducted, the classification accuracies are presented in the form of mean±standard deviation (SD).
3.3.Data Transfer RateThe ITR for all the participants with the number of data classes ranging from two to four are presented as a function of classification accuracy in Fig. 11. The maximum and minimum classification accuracies were achieved when the number of data classes was two () and four (), respectively. For all the participants, the ITR increases as the number of classes increases. The maximum ITR values were 1.44, 1.08, 1.22, 1.08, 0.75, 0.80, 1.08, and for participants 1 through 8, respectively. At , the available BPMs were 2.81 to [0.75 to ()]. 4.Discussion4.1.Comparison to Previous StudiesIn many studies, classification has been performed using finger tapping as the motor imagery task. For an EEG-based BCI, quaternary classification using motor imagery tasks has been investigated, while binary or ternary classifications have been considered for fNIRS-based BCI.29,30 Although motor imagery is more suitable for BCI, in this study, overt motor execution was performed for motor tasks to obtain distinct hemodynamic responses, because overt execution leads to more distinct activated signals. In spite of the quaternary classification, the classification accuracies achieved in this study were comparable to those of the binary classification in other studies.17,24,26 4.2.Experimental ConsistencySince the classification results can potentially be affected by the global changes in the signals by the contact condition of the optodes, ambient light, participant fatigue, attention, and physiological change, a custom-built head cap was used to maintain the optode contact conditions and to totally prevent the effects of ambient light on the experimental results. Physiological changes of the participants were filtered out at the preprocessing step. Because the experiments lasted for a long time, an exhausted participant could not participate in some experiments, as shown in Fig. 9. 4.3.Data Transfer RateAn experiment was designed to investigate four-choice fNIRS-based BCI, since the achievable BPM using a binary system is just 1 to . The suggested quaternary system could achieve a BPM of up to with lower accuracy as a trade-off. Although Blankertz et al. achieved using a 128-channel EEG system,4 it is impossible for an fNIRS-based BCI system to achieve a comparable ITR because of the inherent hemodynamic delay. A task duration and rest duration time longer than 16 s ( is enough to obtain sufficient accuracy based on the results. Therefore, [ (theoretically maximum B) ] may be the maximum BPM using a four-choice fNIRS-based BCI system. This result shows the limitation of the fNIRS-based BCI using the quaternary system. 5.ConclusionsThe performance of BCI has been improved in terms of the ITR using fNIRS by reducing the task duration as much as possible. The task duration should be 8 s while maintaining a sufficient level of classification accuracy for fNIRS-based BCI. The calculated average classification accuracy was as high as 95.5% for binary classification, 92.4% for ternary classification, and 91.5% for quaternary classification. Using the four-choice system, sufficient classification accuracy to increase the ITR was obtained. As a result, an available BPM of 2.78 to was achieved using the BCI. From the experimental results, we have successfully classified the hemodynamic responses evoked by short motor tasks using multiclass classification to increase the BPM. AcknowledgmentsThis research was supported in part by Korea University Grant and Brain Korea 21 plus project in 2014. ReferencesM. A. LebedevM. A. L. Nicolelis,
“Brain–machine interfaces: past, present and future,”
Trends Neurosci., 29
(9), 536
–546
(2006). http://dx.doi.org/10.1016/j.tins.2006.07.004 TNSCDR 0166-2236 Google Scholar
X. Gaoet al.,
“A BCI-based environmental controller for the motion-disabled,”
IEEE Trans. Neural Syst. Rehabil. Eng., 11
(2), 137
–140
(2003). http://dx.doi.org/10.1109/TNSRE.2003.814449 ITNSB3 1534-4320 Google Scholar
G. Pfurtschelleret al.,
“Graz-BCI: state of the art and clinical applications,”
IEEE Trans. Neural Syst. Rehabil. Eng., 11
(2), 177
–180
(2003). http://dx.doi.org/10.1109/TNSRE.2003.814454 ITNSB3 1534-4320 Google Scholar
B. Blankertzet al.,
“The Berlin brain–computer interface: EEG-based communication without subject training,”
IEEE Trans. Neural Syst. Rehabil. Eng., 14
(2), 147
–152
(2006). http://dx.doi.org/10.1109/TNSRE.2006.875557 ITNSB3 1534-4320 Google Scholar
H. SerbyE. Yom-TovG. F. Inbar,
“An improved P300-based brain–computer interface,”
IEEE Trans. Neural Syst. Rehabil. Eng., 13
(1), 89
–98
(2005). http://dx.doi.org/10.1109/TNSRE.2004.841878 ITNSB3 1534-4320 Google Scholar
T. Pistohlet al.,
“Prediction of arm movement trajectories from ECoG-recordings in humans,”
J. Neurosci. Methods, 167
(1), 105
–114
(2008). http://dx.doi.org/10.1016/j.jneumeth.2007.10.001 JNMEDT 0165-0270 Google Scholar
J. ZengY. Sun,
“Motor disability assistance based on novel noninvasive electroencephalographic decoding,”
in GCIS 2012,
92
–94
(2012). Google Scholar
N. A. ChadwickD. A. McMeekinT. Tan,
“Classifying eye and head movement artifacts in EEG signals,”
in DEST 2011,
285
–291
(2011). Google Scholar
J. Mellingeret al.,
“An MEG-based brain–computer interface (BCI),”
NeuroImage, 36
(3), 581
–593
(2007). http://dx.doi.org/10.1016/j.neuroimage.2007.03.019 NEIMEF 1053-8119 Google Scholar
S. S. Yooet al.,
“Brain–computer interface using fMRI: spatial navigation by thoughts,”
Neuroreport, 15
(10), 1591
–1595
(2004). http://dx.doi.org/10.1097/01.wnr.0000133296.39160.fe NERPEZ 0959-4965 Google Scholar
S. Coyleet al.,
“On the suitability of near-infrared (NIR) systems for next-generation brain–computer interfaces,”
Physiol. Measure., 25
(4), 815
–822
(2004). http://dx.doi.org/10.1088/0967-3334/25/4/003 PMEAE3 0967-3334 Google Scholar
F. F. Jobsis,
“Noninvasive, infrared monitoring of cerebral and myocardial oxygen sufficiency and circulatory parameters,”
Science, 198
(4323), 1264
–1267
(1977). http://dx.doi.org/10.1126/science.929199 SCIEAS 0036-8075 Google Scholar
H. Satoet al.,
“Wavelet analysis for detecting body-movement artifacts in optical topography signals,”
NeuroImage, 33
(2), 580
–587
(2006). http://dx.doi.org/10.1016/j.neuroimage.2006.06.028 NEIMEF 1053-8119 Google Scholar
X. CuiS. BrayA. L. Reiss,
“Functional near infrared spectroscopy (NIRS) signal improvement based on negative correlation between oxygenated and deoxygenated hemoglobin dynamics,”
NeuroImage, 49
(4), 3039
–3046
(2010). http://dx.doi.org/10.1016/j.neuroimage.2009.11.050 NEIMEF 1053-8119 Google Scholar
F. Scholkmannet al.,
“How to detect and reduce movement artifacts in near-infrared imaging using moving standard deviation and spline interpolation,”
Physiol. Measure., 31
(5), 649
–662
(2010). http://dx.doi.org/10.1088/0967-3334/31/5/004 PMEAE3 0967-3334 Google Scholar
F. C. RobertsonT. S. DouglasE. M. Meintjes,
“Motion artifact removal for functional near infrared spectroscopy: a comparison of methods,”
IEEE Trans. Biomed. Eng., 57
(6), 1377
–1387
(2010). http://dx.doi.org/10.1109/TBME.2009.2038667 IEBEAX 0018-9294 Google Scholar
L. HolperM. BiallasM. Wolf,
“Task complexity relates to activation of cortical motor areas during uni- and bimanual performance: a functional NIRS study,”
NeuroImage, 46
(4), 1105
–1113
(2009). http://dx.doi.org/10.1016/j.neuroimage.2009.03.027 NEIMEF 1053-8119 Google Scholar
S. Coyleet al.,
“A mechanical mounting system for functional near-infrared spectroscopy brain imaging studies,”
in Opto-Ireland 2005: Optical Sensing and Spectroscopy,
618
–627
(2005). Google Scholar
F. A. Kozelet al.,
“Using simultaneous repetitive transcranial magnetic stimulation/functional near infrared spectroscopy (rTMS/fNIRS) to measure brain activation and connectivity,”
NeuroImage, 47
(4), 1177
–1184
(2009). http://dx.doi.org/10.1016/j.neuroimage.2009.05.016 NEIMEF 1053-8119 Google Scholar
A. E. R. Younget al.,
“Behaviour of near-infrared light in the adult human head: implications for clinical near-infrared spectroscopy,”
Br. J. Anaesth., 84
(1), 38
–42
(2000). http://dx.doi.org/10.1093/oxfordjournals.bja.a013379 BJANAD 0007-0912 Google Scholar
B. Khanet al.,
“Improving optical contact for functional near-infrared brain spectroscopy and imaging with brush optodes,”
Biomed. Opt. Express, 3
(5), 878
–898
(2012). http://dx.doi.org/10.1364/BOE.3.000878 BOEICL 2156-7085 Google Scholar
Q. ZhangE. N. BrownG. E. Strangman,
“Adaptive filtering for global interference cancellation and real-time recovery of evoked brain activity: a Monte Carlo simulation study,”
J. Biomed. Opt., 12
(4), 044014
(2007). http://dx.doi.org/10.1117/1.2754714 JBOPFO 1083-3668 Google Scholar
Q. ZhangG. E. StrangmanG. Ganis,
“Adaptive filtering to reduce global interference in non-invasive NIRS measures of brain activation: how well and when does it work?,”
NeuroImage, 45
(3), 788
–794
(2009). http://dx.doi.org/10.1016/j.neuroimage.2008.12.048 NEIMEF 1053-8119 Google Scholar
R. Sitaramet al.,
“Temporal classification of multichannel near-infrared spectroscopy signals of motor imagery for developing a brain–computer interface,”
NeuroImage, 34
(4), 1416
–1427
(2007). http://dx.doi.org/10.1016/j.neuroimage.2006.11.005 NEIMEF 1053-8119 Google Scholar
T. H. Falket al.,
“Improving the performance of NIRS-based brain–computer interfaces in the presence of background auditory distractions,”
in Proc. IEEE Int. Conf. on Acoustics, Speech and Signal Processing,
(2010). Google Scholar
S. D. PowerT. H. FalkT. Chau,
“Classification of prefrontal activity due to mental arithmetic and music imagery using hidden Markov models and frequency domain near-infrared spectroscopy,”
J. Neural Eng., 7
(2), 026002
(2010). http://dx.doi.org/10.1088/1741-2560/7/2/026002 1741-2560 Google Scholar
V. GottemukkulaR. Derakhshani,
“Classification-guided feature selection for NIRS-based BCI,”
in Proc. 5th Int. IEEE/EMBS Conf. on Neural Engineering (NER),
72
–75
(2011). Google Scholar
H. Ayazet al.,
“Assessment of cognitive neural correlates for a functional near infrared-based brain–computer interface system,”
Foundations of Augmented Cognition. Neuroergonomics and Operational Neuroscience, 699
–708 Springer, Berlin, Heidelberg
(2009). Google Scholar
B. Obermaieret al.,
“Information transfer rate in a five-classes brain–computer interface,”
IEEE Trans. Neural Syst. Rehabil. Eng., 9
(3), 283
–288
(2001). http://dx.doi.org/10.1109/7333.948456 ITNSB3 1534-4320 Google Scholar
S. D. PowerA. KushkiT. Chau,
“Automatic single-trial discrimination of mental arithmetic, mental singing and the no-control state from prefrontal activity: toward a three-state NIRS-BCI,”
BMC Res. Notes, 5 141
(2012). http://dx.doi.org/10.1186/1756-0500-5-141 BRNMAT 1756-0500 Google Scholar
L. KocsisP. HermanA. Eke,
“The modified Beer–Lambert law revisited,”
Phys. Med. Biol., 51
(5), N91
–N98
(2006). http://dx.doi.org/10.1088/0031-9155/51/5/N02 PHMBA7 0031-9155 Google Scholar
R. W. S. AlanV. OppenheimJ. R. Buck, Discrete-Time Signal Processing, Prentice-Hall, Inc., Upper Saddle River, New Jersey
(1999). Google Scholar
G. D. Schott,
“Penfield’s homunculus: a note on cerebral cartography,”
J. Neurol. Neurosurg. Psychiatry, 56
(4), 329
–333
(1993). http://dx.doi.org/10.1136/jnnp.56.4.329 JNNPAU 0022-3050 Google Scholar
R. E. Bellman, Dynamic Programming, Courier Dover Publications, Mineola, NY
(2003). Google Scholar
A. Bashashatiet al.,
“A survey of signal processing algorithms in brain–computer interfaces based on electrical brain signals,”
J. Neural Eng., 4
(2), R32
–R57
(2007). http://dx.doi.org/10.1088/1741-2560/4/2/R03 1741-2560 Google Scholar
K. Fukunaga, Statistical Pattern Recognition, Academic Press, San Diego, California
(1990). Google Scholar
H. Zhang,
“The optimality of naive Bayes,”
in Proc. 17th Int. Florida Artificial Intelligence Research Symposium,
(2004). Google Scholar
D. Lewis,
“Naive (Bayes) at forty: the independence assumption in information retrieval,”
Machine Learning: ECML-98, 4
–15 Springer, Berlin, Heidelberg
(1998). Google Scholar
N. NaseerK. S. Hong,
“Classification of functional near-infrared spectroscopy signals corresponding to the right- and left-wrist motor imagery for development of a brain–computer interface,”
Neurosci. Lett., 553 84
–89
(2013). http://dx.doi.org/10.1016/j.neulet.2013.08.021 NELED5 0304-3940 Google Scholar
A. Kubleret al.,
“Patients with ALS can use sensorimotor rhythms to operate a brain–computer interface,”
Neurology, 64
(10), 1775
–1777
(2005). http://dx.doi.org/10.1212/01.WNL.0000158616.43002.6D NEURAI 0028-3878 Google Scholar
A. Kubleret al.,
“BCI meeting 2005—workshop on clinical issues and applications,”
IEEE Trans. Neural Syst. Rehabil. Eng., 14
(2), 131
–134
(2006). http://dx.doi.org/10.1109/TNSRE.2006.875585 ITNSB3 1534-4320 Google Scholar
F. Nijboeret al.,
“An auditory brain–computer interface (BCI),”
J. Neurosci. Methods, 167
(1), 43
–50
(2008). http://dx.doi.org/10.1016/j.jneumeth.2007.02.009 JNMEDT 0165-0270 Google Scholar
H. GaoJ. W. Davis,
“Why direct LDA is not equivalent to LDA,”
Pattern Recognit., 39
(5), 1002
–1006
(2006). http://dx.doi.org/10.1016/j.patcog.2005.11.016 PTNRA8 0031-3203 Google Scholar
BiographyJaeyoung Shin received a BS and PhD degree in radio communications engineering from Korea University, Seoul, Korea, in 2007 and 2013, respectively. His current research interests include power-line communications, functional near-infrared spectroscopy, and brain computer interface. Jichai Jeong received a BS degree from Korea University, Seoul, Korea, in 1980, the M.S. degree from KAIST, Daejeon, Korea in 1982, and a PhD degree in electrical engineering from Carnegie Mellon University, Pittsburgh, USA, in 1988. He has been with the Faculty of Department of Brain and Cognitive Engineering, Korea University since 2008. His current research interests include brain-computer interface, optical coherence tomography. |


